Buffer Considerations for LC and LC–MS
LCGC North America
The authors examine some critical factors with regard to buffers in LC and LC-MS research.
In this article, the buffer capacity concept is revisited, particularly concerning its behavior in hydroorganic mobile phases. The buffer capacity of a polyprotic acid, or a mixture of monoprotic acids, depends upon the concentration of each weak acid–conjugate base pair, and the pH of its maximum value mainly fits to the acid–base pKA, but it is shifted to a certain degree according to the ionic strength of the buffered solution. Consequently, when an organic solvent is added to an aqueous buffer to prepare a particular mobile phase, the buffer capacity of the hydroorganic mixture is reduced due to the dilution effect, and the maximum buffer capacity is shifted to lower or higher pH values according to the nature of the buffering acid–base pair.
In reversed-phase high performance liquid chromatography (HPLC), the pH of the mobile phase is a fundamental parameter that significantly affects the retention of ionizable analytes. The buffer capacity is a very important quality of a buffer solution, because it gives information about the resistance of a solution to pH change. Between December 2002 and February 2003, a series of interesting and informative articles from Tindall and Dolan dealing with mobile-phase buffers was published in LCGCEurope (1–3). These articles were about pH interpretation in partially aqueous mobile phases and buffer selection and preparation. They also included a brief introduction about buffer capacity in aqueous solutions. The objective of this article is to describe buffer capacity more fully, particularly in hydroorganic mobile phases.
Some Essential Foundations for the Concept of Buffer Capacity
In 1922, Van Slyke (4) proposed the following differential ratio as a quantitative measure of the buffer action in aqueous solution:

expressing the relationship between the increment of the concentration of a strong base B, CB (or strong acid A, CA) added to a buffer solution and the resultant increment in pH. Buffer capacity (β) is always a positive numerical value: if base is added to a buffered solution the pH is increased, so both dCb and dpH are positive and the ratio is also positive; if acid is added, dCA is positive but dpH is negative, thus the minus sign before the dCA/dpH turns the negative ratio into a positive function. β is an additive quantity that depends upon the buffer capacities of the acid–base pair that make up the particular buffer system, and the unavoidable acid–base pairs of water (H3O+ /H2O and H2O/OH- ).

In the case of a polyprotic acid buffer (for example, phosphoric) or a mixture of monoprotic acids (for example, ammonium carbonate or ammonium formate), the total buffer capacity of the system can be expressed as follows (5):

where C1, C2. . . refers to the total concentration of each weak acid-conjugate base pair, K'ai is the concentration acidity constant at the working ionic strength, and Kap is the autoprotolysis constant of water. This equation is correctly applicable to acids presenting a ratio of successive ionization constants (Ka2 /Ka1) lower than 0.05, a condition fulfilled by most of the common polyprotic acids. When this condition is not satisfied (for example, with tartaric and adipic acids), more complex equations are required. For example, the exact expression for buffer capacity of a diprotic acid is as follows (6):

Buffer capacity is proportional to the concentration of the buffering species and depends upon its pK'a. It must be noticed that activity correction has not been carried out in equations 3 and 4. For an acid–base equilibrium like HAz € Az-1 + H+ the concentration acidity constant (K'ai) is defined as follows:

whereas for the same equilibrium, the thermodynamic acidity constant includes the activity coefficients (γi):

General interconversion between thermodynamic and concentration acidity constants is possible using the Debye–Hückel equation

, with A = 0.5 and α0B = 1.5 for water solvent) to calculate the particular activity coefficients of the acidic and basic species of the buffer. Then, from equations 5 and 6 and taking logarithms, the following expression can be established:

In fact, the effect of activity coefficients is not significant in diluted aqueous solution, especially in the case of low ionic strength. Nevertheless, activity correction can play an important role when the organic solvent content increases in the preparation of mobile phases and the ionic strength of the solution is relatively high due to charge of the buffer species. Although equations 1–4 were developed for aqueous solutions, they can be generalized to any amphiprotic solvent (that is, self-ionizing solvent possessing both characteristics of Brønsted acids and bases) or mixtures of them, such as the ones used in LC mobile phases.
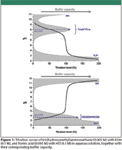
Figure 1
pH of Maximum Buffer Capacity
According to equation 1, buffer capacity also can be defined as proportional to the reciprocal of the slope of a titration curve. Figure 1 shows the titration curves of tris(hydroxymethyl)amino-methane (Tris) and formic acid, together with the corresponding profiles of the buffer capacity of the system. The hydrogen and hydroxide ions contributions to the buffer capacity become relevant below pH 3 and above pH 11, respectively, and they can be large compared to the buffer capacity of the weak acid–base pair. Maximum buffer capacity of this weak acid–base pair buffer is achieved at the half titration point, where the concentration of the acid is equal to the concentration of its corresponding conjugate base, or in other words, when the pH of the solution is equal to the pK'a of the buffer compounds. In the case of the formic acid–formate pair, its buffer capacity is directly overlapped by the inevitable H2O–H3O+ because of its low pKA. We should pay special attention to not confuse the pK'a value of a selected buffer in a particular solution and the pKA value often obtained in the literature corrected to zero ionic strength. In Table I, the aqueous pKA values (at zero ionic strength and 25 °C, from reference 7) of commonly used buffers are shown, together with their calculated pH values of maximum buffer capacity with activity correction (equivalent to pK'a) at three concentrations covering the usual HPLC range. In the case of neutral acids (for example, acetic acid) and neutral bases (for example, ammonia and Tris), the variation of the maximum of buffer capacity does not change relevantly with concentration, because the ionic strength is relatively low (only the acid or the conjugate base has a positive charge). But for anionic acids (for example, dihydrogen citrate, hydrogen phosphate, and hydrogen citrate) and cationic bases (for example, piperazonium), the apex of buffer capacity can be shifted in a significant way in relation to the thermodynamic pKA, about a half unit at 0.1 mol/L for species with two charges, and about 0.8 units for trivalent species. This fact is important because buffer capacity sharply decreases when the solution pH move away from the buffer pK'a. When the pH is one unit below or above the pK'a, the buffer capacity is reduced to 1/3 of its maximum value, and it is only about 4% when pH equals to pK'a ± 2. An illustrative example is provided by the hydrogen citrate–citrate buffer: according to the literature pKA value (Table I), one would think that the best buffer capacity for this buffer at a concentration of 0.1 M is achieved when the pH of the solution is 6.40, but in fact, the correct pH is 0.83 units lower, and therefore, this prepared solution of pH 6.40 has only about the 40% of the presupposed buffer capacity. These phenomena are even more notable when an organic solvent is added to the aqueous buffer, because of its significant effects on activity coefficients. For example, in the case of mixtures containing 50% in volume of methanol or acetonitrile and a buffer concentration of 0.05 mol/L, the buffer capacity apex for dihydrogen citrate–hydrogen citrate or hydrogen carbonate–carbonate is shifted down about 0.5 units in relation to the thermodynamic pK A , and about 1 unit in the case of hydrogen citrate–citrate (instead of 0.34 and 0.73, respectively, for water solvent, as shown in Table I).
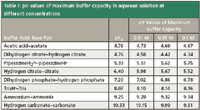
Table I: pH values of maximum buffer capacity in aqueous solution at different concentrations
What Happens to an Aqueous Buffer When Organic Solvent Is Added?
When an organic solvent is added to an aqueous buffer to prepare a particular mobile phase, two different phenomena take place: the buffer capacity of the mixture is reduced due to the dilution effect, because β is proportional to the concentration of the buffer; and the maximum of buffer capacity is shifted according to the pK'a shift of the buffer species, including the contribution of the activity coefficients. There are data available about the pKa variation of commonly used HPLC buffers in acetonitrile–aqueous (8) and methanol–aqueous (9) solution up to 60% and 80% in volume, respectively. In this studied range of solvent compositions, the pKA of neutral and anionic acids is shifted to higher values, whereas the pKA of cationic acids shows the reverse trend. Both phenomena are depicted in Figure 2 for phosphoric and citric acids buffering systems. It must be mentioned that in the present article, the pH in the hydroorganic mixture is expressed in the sw pH scale — that is, the pH quantity is referred to water as the standard state. In other words, the pH is measured in the mixture, but the glass electrode is calibrated using standard aqueous buffers. After this clarification and coming back to Figure 2, the citric acid system shows a good buffer capacity in an outstanding wide range of pH, up to pH 6.5–7 in aqueous solution and up to pH 8 in 60% of acetonitrile, whereas in the case of the phosphoric acid system, there is a poor buffered zone around pH 5 because of the large difference between the first and the second pKa values.
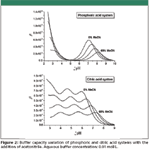
Figure 2
MS-Friendly Buffer Mixtures: Ammonium Carbonate, Acetate, and Formate
Buffers composed of two buffering species are used commonly in HPLC systems. In particular, ammonium formate, ammonium acetate, and ammonium carbonate are used widely when HPLC is coupled to mass spectrometry (MS). Ammonium acetate and formate are employed in separations performed at low pH, in which the buffering species are formate or acetate, and ammonium plays only the role of a volatile MS-friendly co-ion, instead of sodium or potassium ions. Figure 3 shows buffer capacity profiles of ammonium acetate and formate in aqueous solution, and how they vary when acetonitrile is added to the aqueous buffers to prepare particular mobile phases. In these plots, the individual buffer capacities corresponding to ammonium–ammonia and acetic acid–acetate or formic acid–formate species are described, together with the contribution of a hydrogen ion (H3O+ ) at very acidic pH and hydroxyl ion (OH- ) at very alkaline pH. In the case of ammonium acetate, there is a difference of 4.6 units between the pKa values of both buffering species (ammonium–ammonia and acetic acid–acetate) in aqueous solution, leaving a broad nonbuffered zone between them. In the case of ammonium formate, this nonbuffered zone is even wider (5.5 units) because formic acid is more acidic than acetic acid. These pKa differences are reduced progressively with the addition of the organic solvent (ammonium is a cationic acid and formate and acetate are conjugate bases of neutral acids), but in spite of this fact, the difference between pKa values is still substantial at high organic solvent concentrations. Therefore, when these buffers are used for low pH separations, there is no contribution from ammonium in the improvement of acetate buffer capacity, and their buffer capacity at intermediate pH values is really poor.
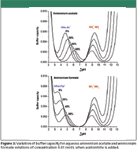
Figure 3
Ammonium hydrogen carbonate has been described as an excellent buffer for the analysis of basic drugs by HPLC–MS (10). In fact, this mixed buffer presents a good buffer capacity in a relatively wide pH range, because the buffer capacity of ammonium–ammonia species is added up to the one corresponding to hydrogen carbonate–carbonate (Figure 4). In this case, in contrast to ammonium formate or acetate, the difference on aqueous pKa values is only about 1 unit. Therefore, there is a wide pH range of excellent buffer capacity at least from pH 8 to 11 in aqueous solution, and if the concentration of the buffer is high enough, it might be wider. When acetonitrile is added, ammonium becomes more acidic and hydrogen carbonate more basic, so differences in pKa values are increased. But the pKa values of the buffering species are still close enough to provide a wide range of good buffer capacity, and it widens with the addition of acetonitrile. McCalley (11) reported the instability of ammonium hydrogen carbonate solutions at pH around 7, probably because of the poor buffering capacity of this buffer in the valley between the first and the second pKa values.
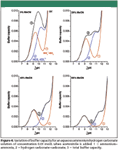
Figure 4
Summary
Going a step forward from the "Mobile-Phase Buffers" series by Tindall and Dolan published in this journal, the dependence of maximum buffer capacity on ionic strength and organic modifier content is discussed here. It is also pointed out that the definition of buffer capacity as an additive quantity of buffer capacities of the acid–base pairs that constitute the particular buffer system, together with the contribution of H+ and OH- at very low and high pH values, respectively. Finally, the buffer capacity profile of usual MS-friendly buffers containing ammonium as co-ion has been presented.
Xavier Subirats, Elisabeth Bosch, and Martí Rosés. are with the Departament of Analytical Chemistry, University of Barcelona, Barcelona, Spain.
References
(1) G.W. Tindall and J.W. Dolan, LCGC Eur. 15, 776 (2002).
(2) G.W. Tindall and J.W. Dolan, LCGC Eur. 16, 10 (2003).
(3) G.W. Tindall and J.W. Dolan, LCGC Eur. 16, 64 (2003).
(4) D.D. Van Slyke, J. Biol. Chem. 52, 525 (1922).
5) L. Šucha and S. Kotrlý, Solution Equilibria in Analytical Chemistry (Van Nostrand Reinhold, London, UK, 1972).
(6) J.N. Butler, Ionic Equilibrium. A Mathematical Approach (Addison-Wesley, Reading, Massachusetts, 1964).
(7) R.N. Goldberg, N. Kishore, and R.M. Lennen, J. Phys. Chem. Ref. Data 31, 231 (2002).
(8) S. Espinosa, E. Bosch, and M. Rosés, Anal. Chem. 74, 3809 (2002).
(9) I. Canals, F.Z. Oumada, M. Rosés, and E. Bosch, J. Chromatogr., A 911, 191 (2001).
(10) A. Espada and A. Rivera-Sagredo, J. Chromatogr., A 987, 211 (2003).
(11) D.V. McCalley, J. Chromatogr., A 987, 17 (2003).
Common Challenges in Nitrosamine Analysis: An LCGC International Peer Exchange
April 15th 2025A recent roundtable discussion featuring Aloka Srinivasan of Raaha, Mayank Bhanti of the United States Pharmacopeia (USP), and Amber Burch of Purisys discussed the challenges surrounding nitrosamine analysis in pharmaceuticals.
Extracting Estrogenic Hormones Using Rotating Disk and Modified Clays
April 14th 2025University of Caldas and University of Chile researchers extracted estrogenic hormones from wastewater samples using rotating disk sorption extraction. After extraction, the concentrated analytes were measured using liquid chromatography coupled with photodiode array detection (HPLC-PDA).

