Biomonitoring: Polybrominated Diphenyl Ethers and Polybrominated Biphenyls Using Capillary GC with Electron...
LCGC North America
A selective and highly sensitive capillary gas chromatographic-mass spectromic approach has been developed for the detection of PBDEs and PBBs that utilizes dissociative resonance electron capture and selected ion monitoring.
Biomonitoring: Polybrominated Diphenyl Ethers and Polybrominated Biphenyls Using Capillary GC with Electron-Capture Negative Ion Mass Selective
Polybrominated diphenyl ethers (PBDEs) have emerged as a significant class of persistent organic pollutants (POPs). These POPs join the organochlorine pesticides (OCs) and polychlorinated biphenyl (PCB) and polybrominated (PBB) biphenyl congeners as environmentally significant POPs that must be biomonitored continuously. Potential threats to human and animal health include developmental neurotoxicity, endocrine disruption, peripheral nervous system damage and cancer (1,2). Morland and colleagues (3) cite two reported adverse health outcomes in laboratory animals dosed with high levels of PBDEs to include neurologic deficiencies and endocrine disruption . Sjödin and colleagues (4) at the Centers for Disease Control and Prevention (CDC) report an increase in the concentration of PBDEs measured in 40 human serum pools collected in the southeastern United States from 1985 through 2002 and in Seattle, Washington, from 1999 through 2002. In contrast, 2,2',4,4',5,5'-hexabromobiphenyl (BB-153), the principal PBB congener from the original Firemaster (Formerly the Michigan Chemical Corporation, St. Louis, Missouri) fire retardant product that inadvertently contaminated livestock and entered the human food chain in Michigan in 1973 (5,6) as well as 2,2',4,4',5,5'-hexachlorobiphenyl (CB-153) also were measured and found to be decreasing over this time period. Sjödin and colleagues (7) at the CDC recently reported serum concentration levels of 10 BDE congeners and BB-153 in representative sampling of U.S. residents in 2003 and 2004. Out of 2062 serum samples, almost all serum samples contained detectable levels of BDE-47.
Covaci and colleagues (8) recently reviewed the literature on the isolation and recovery of PBDEs from both environmental and human samples. They stated that when it is impossible to use 13C-labeled PBDEs as internal standards, PBDE congeners that are not present in technical mixtures or environmental samples are suitable as internal standards. Fluorinated derivatives (F-PBDEs) also make suitable internal standards. Many laboratories cannot afford high resolution mass spectrometers that would allow use of 13C-labeled PBDEs to be able to quantitate PBDEs by isotope dilution. Korytár and colleagues (9) established elution orders for seven different GC stationary phases and concluded that one of the columns resulted in the least number of coelutions.
For biomonitoring purposes, only a small number of PBDE congeners have been found in environmental and biological samples in contrast to PCBs. The following congeners are suggested as targeted analytes for biomonitoring: BDEs 28 (2,4,4'-tribromo-diphenylether), 47 (2,2',4,4'-tetrabromo-diphenylether), 99 (2,2',4,4'5-pentabromo-diphenylether), 100 (2,2',4,4',6-pentabromo-diphenylether), 153 (2,2',4,4'5,6'-hexabromo-diphenylether), 154 (2,2',4,4'5,6'-hexabromodiphenylether) and 183 (2,2',3,4,4',4',6-heptabromo-diphenylether). Björklund and colleagues (10) in Sweden investigated the influence of several injection techniques while testing 10 different wall-coated open tubular (WCOT) columns including the use of retention gaps. They conclude from their studies that the programmed temperature vaporizing (PTV) injector operated in temperature programmed pulsed pressure injection mode is recommended for PBDEs.
In this article, we demonstrate how a PTV injector was incorporated along with a 30-m WCOT column in a capillary GC–MS system utilizing electron capture negative ion with selected ion monitoring (ECNI-MSD) detection using methane as buffer or reagent gas to achieve sufficient chromatographic resolution of the most commonly detected PBDE congeners. Baseline chromatographic resolution of BB-153 from BDE-154 without resorting to a longer WCOT column was demonstrated. We show that the incorporation of an internal standard mode of instrument calibration led to a significant cost reduction to quantitate PBDEs and PBBs in sample extracts from biological matrices. To assess instrument sensitivity, we then studied the calibration data generated over a six-month period. Using an ordinary (nonweighted) least squares regression approach, the author established decision levels, decision limits, and instrument detection limits (IDLs) for each congener based upon calibration statistics using computer programs published elsewhere (11). Our objective was to achieve the lowest IDLs for nine BDE congeners and two BB congeners and, thus, to add value to an existing biomonitoring program in public health for the state of Michigan.
Experimental
Materials and reagents: Chemical reference standards containing PBDEs and PBBs were placed in 300-μL conical glass inserts with and without polymer feet (Agilent Technologies, Inc., Wilmington, Delaware). The inserts were placed in 2-mL, 12 mm × 32 mm glass screw-top vials (Target DP, VWR, West Chester, Pennsylvania). The 2-mL vials containing the inserts were placed in the GC autosampler and injected automatically. PBDEs tenaciously cling to glass surfaces. Silanized 2-mL GC vials (amber target SC I-D vial, National Scientific, Rockwood, Tennessee) are recommended for long-term storage of PBDE chemical reference standards. Compressed cylinders containing helium and methane (Airgas, Radnor, Pennsylvania) supplied carrier gas and chemical ionization reagent gas to the instrument.
Chemical Reference Standards
PBDE stock solutions in nonane were obtained from Cambridge Isotope Laboratories Inc. (Andover, Massachusetts). PBDE stock solutions in iso-octane were obtained from AccuStandard, Inc. (New Haven, Connecticut). Stock solutions were diluted serially in 1:3 n-hexane–iso-octane and stored at -20 °C in sealed ampoules until used as calibration reference standards, initial calibration verification reference standards (ICVs) and continuing calibration verification reference standards (CCVs) in this work. The choice of the diluent solvent composition was dictated by our desire to keep the chemical composition of the extractant obtained from sample preparation identical to that in the calibration and reference quality control standards.
Instrumentation and operating conditions: A model 6890 gas chromatograph with a model 7683 automated liquid sampler interfaced to a model 5973N mass selective detector utilizing ChemStation software, version D.01.02 (Agilent Technologies) operating within Windows XP version 5.1 (Microsoft Corporation, Redmond, Washington). A chemical ionization source (Agilent Technologies) was installed with methane as the chemical ionization reagent gas. Protocols for the methane pre-tune, positive ion tune using PFDTD followed by a negative ion tune using PFDTD were adhered to. The PTV inlet (Agilent Technologies) was utilized throughout the study. A Graphpack-3D ferrule, a baffled deactivated glass liner, and a Graphpack-2M ferrule for a 0.25-mm i.d. and 0.40-mm o.d. WCOT (all from Gerstel, GmbH & Co. KG, Mülheim an der Ruhr, Germany) were required to set up the PTV.
Results and Discussion
WCOT column selection: Environmentally significant PCBs and PBBs are coeluted with with the BDE-154/BB-153 pair of interest (12). Mazdai and colleagues (13) report that a 60-m DB-5MS column (Agilent Technologies) was required to separate BDE-154 from BB-153 to adequately separate and detect all six BDE congeners in maternal and fetal serum samples under capillary GC–ECNI-MSD conditions. Kuhn and colleagues (14) reported their findings using a 30-m DB-XLB column (Agilent Technologies) with cool-on-column injection under electron ionization selective ion monitoring (EI-SIM) conditions.
We asked our clients to review the toxicology and epidemiology literature and recommend which BDE congeners should be biomonitored in our laboratory. We also informed them that attempting to target BDE-209 would be problematic. Päpke and colleagues (15) reported that individual PBDE congeners show a certain sensitivity to light exposure. They cited a study that revealed a ~70% decomposition of BDE-209 when stored for 24 h in a transparent vial. It has been recommended that a short (10-m) WCOT column be used to separate and detect BDE-209. Our initial attempts to include BDE-209 as a targeted analyte for biomonitoring purposes was abandoned when we found very poor reproducibility for the injection of chemical reference standards containing BDE-209. We so informed our clients that we would not include BDE-209. Our objectives were to not only baseline resolve all nine targeted PBDEe but to obtain baseline resolution with a suitable internal standard for calibration purposes and baseline resolution of two PBB congeners.
Attempts to obtain baseline resolution of all PBDEs and PBBs targeted using a 30 m × 0.25 mm HP-5MS WCOT column (Agilent Technologies) or a 30 m × 0.25 mm CP-Sil 19 WCOT column (Varian, Inc., Walnut Creek, California) did not succeed. Although BB-155 was baseline resolved from BDE-100, BB-153 was coeluted with BDE-154. BB-155 is added to all samples during sample preparation as a surrogate in our laboratory to assess method percent recoveries. By this time we had settled on a fixed temperature program for the GC oven that satisfied the first objective, that is, to obtain baseline resolution of all PBDEs in a reasonable length of time.
The fundamental equation (most applicable to isothermal conditions) for column chromatographic resolution follows (16):

We sought then to keep N, the theoretical number of plates (N is directly proportional to the column length) the same. We were satisfied with the retention factors, k, that spanned the range from the tribromo congener (BDE-28) to the heptabromo congener (BDE-183) and included both BB-155 (hexabromo) and BB-153 (hexabromo). We thought that we could increase column selectivity, α, by choosing a WCOT column with a more selective liquid phase. Choosing the DB-XLB WCOT column and selective temperature programming gave the optimized GC resolution. Figure 1 shows a capillary GC–ECNI-MSD chromatogram for the separation of 10 targeted PBDE congeners (including BDE-66 used as the internal standard for calibration) as well as baseline resolution between PBB-155 and BDE-100 and baseline resolution between BB-153 and BDE-154 using a 30 m × 0.25 mm DB-XLB column. The top chromatogram in Figure 1 is the SIM chromatogram from monitoring m/z 79 while the bottom chromatogram is the SIM chromatogram from monitoring m/z 81. All other SIM chromatograms in this work were nearly identical to Figure 1 and were very reproducible from injection to injection over time. Quantification of a specific PBDE congener is performed in all subsequent results reported here using SIM m/z 79. The qualifier ion being equally abundant is found using SIM m/z 81. Instrumental conditions including the experimentally optimized column temperature program for capillary GC–ECNI-MSD are presented in Table I.
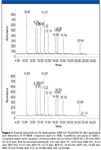
Figure 1
Choice of internal standard: Almost any BDE congener that is not found in samples, does not co-elute with any of the target BDE congeners, and is commercially available, makes for a suitable internal standard. ECNI-MSD-SIM, whereby conditions are such as to generate Br ions vs. molecular fragments, lends itself nicely to using BDE congeners. If there were differences in using a tetrabromo-diphenylether (BDE-66) to quantitate hexa- and heptabromo-BDE congeners, we would have seen them in the results reported in Tables II–IV. This was not the case. The significantly lower cost of using BDE congeners versus 13 C-labeled BDE congeners greatly contributes to the cost effectiveness of the approach taken and described in this article.

Table I: Capillary GCâECNI-MSD conditions used to separate, detect, and quantitate trace concentration levels of nine BDE and two BB congeners
Choice of GC injector and injector temperature: Björklund and coworkers (10) reported difficulties due to high molecular weight PBDE discrimination when using a split–splitless injector. A PTV injector and liner is of much lower mass than the split–splitless injector. Ferrule and nut connections to a WCOT column differ as well. The excellent reproducibility that we observed for the targeted analytes coupled with the fact that we decided against including BDE-209 encouraged us to abandon the need to temperature program the PTV. We kept the PTV at 300 °C throughout all analyses reported in this article.
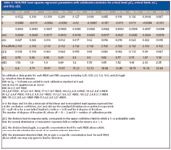
Table II: PBDE/PBB least squares regression parameters with callabration statistics for critical level y[C], critical limits x[C], and IDLs x[D]
GC programmed temperature considerations: The temperature program (TP) that optimized the separation of all 11 analytes and used throughout the study reported here is shown in Table I. Two critical TP parameters emerged. The first is the hold time following TP Rate 1 (Refer to Table I). It proved critical to have this 1.0 min plateau following TP Rate 1 for the "cool" initial splitless injection. The second critical TP parameter is the rate for TP Rate 2. A compromise was reached between a TP rate that is high enough to yield a reasonable GC run time while low enough to yield adequate GC resolution.
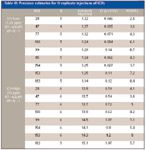
Table III: Precision estimates for N replicate injections of ICVs
ECNI-MS considerations: PBDEs are amenable to EI-MS fragmentation, resonance electron capture and dissociative resonance electron capture (ECNI-MS). By moving away from EI conditions, reducing energetic (70-eV) electrons to thermal (0–15-eV) electrons by introducing reagent gas into the ion source, enables the elevated gas pressure in the ion source to form secondary electrons with energies low enough (so-called thermal electrons) to yield resonance and dissociative electron capture. Early application of dissociative electron capture of PBBs to biomonitoring can be found from the literature during the Michigan incident discussed earlier. Roboz and colleagues (17) over 25 years ago used dissociative electron-capture negative ion MS operated in the SIM mode to conduct the quantitative analysis of human serum from those exposed to Firemaster fire retardant. This work was conducted during an era when packed GC columns dominated the practice of GC and GC inlets were not anywhere as sophisticated as a split–splitless or a PTV injector. ECNI-MS-SIM yielded an instrument detection limit for the hexabromobiphenyl isomer of 2 pg. The range of detector linearity using BP-6 (the chemical reference standard for the BB-153 congener at that time) as the calibration standard ranged from 0.1 ppb to 50 ppb. Ong and Hites (18) have reviewed the more recent literature on ECNI-MS while pointing out the large abundance of "bromine ions" [Br]– at m/z 79 and 81 under dissociative electron-capture MS conditions (18). Bromine exhibits a natural abundance of two stable isotopes at 50.69% (79 Br) and 49.31% (81 Br) respectively (19).
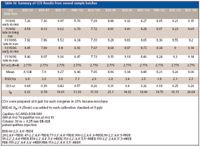
Table IV: Summary of CCV Results from several sample batches
Ackerman and colleagues (20) recently demonstrated that 39 mono- to hepta-BDEs could be separated and detected if ECNI conditions were altered so that appreciable high-mass fragment ions [M - xH - yBr]— specific to the particular BDE congener were generated. In other words, moving from dissociative resonance capture which yields predominately Br— to resonance capture yields high-mass fragment ions. Such high-mass fragment ions enable the use of 13 C12 labeled PBDEs. This choice of an isotopic internal standard for each PBDE serves to facilitate more precise and accurate trace quantitative analysis via isotope dilution calibration. A significant finding from this study was that the relative high-mass fragment in abundance for each congener decreased as a function of increasing ECNI source temperature, while the relative Br— abundances slightly increased with increasing source temperature . Hence, the use of 13 C12-labeled PBDEs requires that dissociative ECNI conditions be changed to resonance ECNI conditions. To do this for the purpose of biomonitoring compromises the high sensitivity afforded by dissociative ECNI-MS with respect to organobromine compounds as well as to significantly increase the cost of analysis. We also saw no need to increase the ion source temperature much above the suggested 150 °C according to the Agilent 5973 hardware manual, since we were observing sufficient [Br]— abundance that enabled IDLs to reach concentration levels appropriate for biomonitoring. An ion source temperature of 166 °C seems to be reached relatively quickly and is constant over time.
Dissociative ECNI-MS is not without its limitations. We found that injection of PBDEs dissolved in polar solvents such as 2-propanol significantly suppresses [Br]— abundances. This suppression is not observed when PBDEs are dissolved in non-polar solvents such as hexane or iso-octane or even the moderately polar solvent ethyl acetate. Quantification, although very sensitive, lacks the selectivity of resonance ECNI as well as EI-MS. We realized that to achieve the lowest possible IDLs, we had to accept the trade off between selectivity and sensitivity. This required that we achieve the baseline resolution between coeluted analytes. Baseline resolution is demonstrated in Figure 1 and was typical of all capillary GC–ECNI-MSD-SIM chromatograms.
Critical levels, yC , decision limits xC , IDLs, xD, and estimates of instrument precision: The case for calculating detection limits based upon applying calibration statistics to the least squared regressed calibration curve while abandoning the traditional "3σ" view has been recently articulated (11,21). Table II presents results using calibration statistics to calculate the critical level, yC , the decision limit, xC, and the IDL, xD, for each of the nine targeted BDE congeners and the two targeted BB congeners against BDE-66 as internal standard. Note that IDLs calculated based upon the application of calibration versus blank statistics yield higher values since a 100 (1-β) probability also can be defined. In the application of blank statistics, only the 100 (1-α) probability can be obtained. Einax and colleagues point out that if the decision limit is taken to be the IDL, as is the case when IDLs are calculated using blank statistics, there exists a 50% probability of mistaking an analyte signal for a blank (22). In other words, an unacceptable large β is realized in contrast to β being defined as 0.05 when IDLs are calculated from application of calibration statistics. Another advantage of applying calibration statistics is in the use of Student's t statistics. Student's t statistics is most applicable in cases where we have only an estimate of the standard deviation (the population variance is unknown) based upon a limited number of observations.
Decision limits, x C , range from a low of 0.25 ppb (BB-155) to a high of 1.18 ppb (BDE-183). IDLs range from a low of 0.49 ppb (BB-155) to a high of 2.35 ppb (BDE-183) as is shown in Table II. Method detection limits (MDLs) that incorporate the percent recovery for each congener from a biological matrix such as human serum combined with the established phase ratio in our method have the potential to reach low parts-per-trillion levels, which is appropriate for effective biomonitoring. MDLs for PBDEs and BB-155 and BB-153 from our laboratory using both liquid–liquid extraction and reversed-phase solid-phase disk extraction techniques from sheep and human serum have been published recently elsewhere (23).
Following the establishment of the calibration curve for each congener and ordinary least squares regression, replicate GC injections were then made using ICVs reference standards. Results for a ICV-Low and for a ICV-High are presented in Table III for each BDE congener. Confidence intervals (CIs) for a two-tailed t test assuming that 100 (1-α) % probability that of all future measurements would fall to within the mean is presented. RSDs also are given for each BDE congener. CIs and RSDs are important statistical parameters that assess instrument precision. We are currently evaluating the method's accuracy using serum specimens from both the National Institute of Standards and Technology (NIST) and the Artic Monitoring and Assessment Program of Canada (AMAP).
Over the past year, our laboratory has been conducting sample preparation and determining trace concentration level of PBDEs in human serum using capillary GC–ECNI-SIM techniques as described in this paper. Table IV shows a summary of five continuous calibration verification (CCVs) reference standards that were placed in the autosampler tray at a frequency of approximately one CCV for every 20 sample extracts. With the exception of BDE-28 and BB-155, all other RSDs fall to within the 2–4% range. Typical batches include anywhere between 20 and 50 sample extracts derived from human serum.
Conclusion
This article has demonstrated that selected BDE and BB congeners, POPs that are significant to environmental health can be resolved chromatographically while utilizing dissociative ECNI-MS. We demonstrated that capillary GC–ECNI-MSD-SIM techniques coupled with a PTV injector and a selective WCOT column can reliably separate and detect PBDEs down to and below 1 ppb. Using a non-targeted BDE congener as an internal standard resulted in good precision. The approach shown in this paper can lead to more cost effective biomonitoring when coupled to streamlined sample preparation techniques. We coupled this determinative technique with liquid–liquid extraction and reversed-phase solid-phase disk extraction and recently reported our findings (23). We are currently coupling this determinative technique with stir-bar sorptive extraction techniques.
Acknowledgments
David Isenga prepared, ran, and quantitated the calibration, ICV, and CCV reference standards reported here. Michael O'Keefe transferred stock PBDE standards into sealed ampoules while Mark Knottnerus suggested that the author attempt to separate PBDEs using an XLB column. Kevin Cavanagh, our Division Director, strongly encouraged this study and edited the author's first draft. The Michigan Public Health Institute, the CDC sponsored Biomonitoring Planning Grant provided financial support. The Department of Health and Human Services, Center for Disease Control and Prevention, Public Health Emergency Preparedness provided the analytical instrumentation.
References
(1) J. Focant, A. Sjödin, W. Turner, and D. Patterson, Anal.Chem.76, 6313–6320 (2004).
(2) A. Schecter, M. Pavuk, O. Päpke, J. Ryan, L. Birnbaum, and R. Rosen, Environmental Health Perspectives 111(14), 1723–1729 (2003).
(3) K.Morland, P.Landrigan, A.Sjödin, A. Gobeille, R. Jones, E. McGahee, L. Needham, and D. Patterson, Environmental Health Perspectives 113(12), 1689–1692 (2005).
(4) A. Sjödin, R. Jones, J. Focant, C. Lapeze, R. Wang, E. McGahee, Y. Zhang, W. Turner, B. Slazyk, L. Needham, and D. Patterson, Environmental Health Perspectives 112(6), 654–658 (2004).
(5) F. Halbert and S. Halbert, Bitter Harvest. The Investigation of the PBB Contamination: A Personal Story (Eerdmans Pub. Co., Grand Rapids, Michigan, 1978).
(6) G. Fries, CRC Crit Rev. Toxicol. 16, 105 (1985).
(7) A. Sjödin, L. Wong, R.Jones, A. Park, Y. Zhang, C. Hodge, E. Dipietro, C. McClure, W. Turner, L. Needham, and D. Patterson, Jr., Env. Sci. Tech. 42, 1377–1384 (2008).
(8) A. Covaci, S. Voorspoels, L. Roumos, H. Neels, and R. Blust. J. Chromatogr., A 1153, 145–171 (2007).
(9) P. Korytá, A. Covaci,, J. deBoer, A. Gelbin, and U. Brinkman, J. Chromatogr., A 1065, 239–249 (2005).
(10) J. Björklund, P. Tollbäck, C. Hiärne, E. Dyremark, and C. östman, J. Chromatogr., A 1041, 201–210 (2004).
(11) P.R. Loconto. Trace Environmental Quantitative Analysis, 2nd ed. (CRC/Taylor and Francis, Boca Raton, Florida, 2006), Chapter 2 and Appendix C.
(12) A. Covaci, S. Voorspoels, and J. de Boer, Enviroment Int. 29, 735-756 (2003).
(13) A.Mazdai, N. Dodder, M. Abernathy, R. Hites, and R. Bigsby, Environmental Health Perspectives 111, 1249 (2003).
(14) E. Kuhn, J. Ellis, and A. Vickers. "GC/MS Analysis of Polybrominated Flame Retardants, Poster, 2003 Pittsburgh Conference on Analytical Chemistry and Applied Spectroscopy, Orlando, Florida.
(15) O. Päpke, P. Fürst, and T. Herrmann, Talanta. 63, 1203 (2004).
(16) B. Karger, L. Synder, and C. Horvath, An Introduction to Separation Science (Wiley, New York, 1973), p.150.
(17) J. Roboz, J. Greaves, J. Holland, and J. Bekesi. Anal.Chem. 54(7), 1104–1108 (1982).
(18) V. Ong and R. Hites, Mass Spectrometry Reviews 13, 259 (1995).
(19) J. Emsley. The Elements (Clarendon Press, Oxford, 1989), p. 35.
(20) L. Ackerman, G. Wilson, and S. Simonich. Anal.Chem. 77, 1979 (2005).
(21) P.R. Loconto, Am. Lab. News Edition 37(4), 36 (2005).
(22) J. Einax, H. Zwanziger, and S. Gei, Chemometrics for Environmental Analysis (VCH, Weinheim, Germany, 1997), p. 68.
(23) P.R. Loconto, D. Isenga, M. O'Keefe, and M. Knottnerus, J. Chromatographic Sci. 46, 53-60 (2008).

Sorbonne Researchers Develop Miniaturized GC Detector for VOC Analysis
April 16th 2025A team of scientists from the Paris university developed and optimized MAVERIC, a miniaturized and autonomous gas chromatography (GC) system coupled to a nano-gravimetric detector (NGD) based on a NEMS (nano-electromechanical-system) resonator.
Miniaturized GC–MS Method for BVOC Analysis of Spanish Trees
April 16th 2025University of Valladolid scientists used a miniaturized method for analyzing biogenic volatile organic compounds (BVOCs) emitted by tree species, using headspace solid-phase microextraction coupled with gas chromatography and quadrupole time-of-flight mass spectrometry (HS-SPME-GC–QTOF-MS) has been developed.
Fundamentals of Benchtop GC–MS Data Analysis and Terminology
April 5th 2025In this installment, we will review the fundamental terminology and data analysis principles in benchtop GC–MS. We will compare the three modes of analysis—full scan, extracted ion chromatograms, and selected ion monitoring—and see how each is used for quantitative and quantitative analysis.


