Extracolumn Effects
LCGC North America
All the buzz lately about LC columns packed with particles smaller than 3 mm often comes with warnings about extracolumn effects. This month's installment will take a look at what these effects are and more.
All the buzz lately about liquid chromatography (LC) columns packed with particles smaller than 3 μm often comes with warnings about extracolumn effects. For this month's LC Troubleshooting installment we will take a look at what these effects are and how they might influence the separations obtained from your LC system. I also will share a simple method that you can use to estimate the amount of extracolumn volume in your LC system.

John W. Dolan
What are Extracolumn Effects?
Extracolumn effects, also called extracolumn band broadening, are all the processes outside the column that increase the width of chromatographic peaks. One common way to describe extracolumn effects is

where σobs is the observed standard deviation of peak from the chromatogram, σcol is the standard deviation of the peak resulting from band spreading inside the column, and σec is the band spreading that takes place outside the column, also called the extracolumn volume. All peaks broaden as they pass through the column, and the longer the retention time, the broader the peaks (isocratic conditions assumed). Thus, we observe that peaks with small retention times are narrow and large retention times generate broader peaks. This is normal. Several different contributions make up σec, such as the injection solvent choice and injection volume, the connecting tubing volume (length and diameter), how well the fittings are assembled, the detector cell, the detector time constant, and the data collection rate. These various contributions add up as the square-root of the sum-of-squares of each contribution to give σec. It is easy to understand that if σec is small compared to σcol, there won't be much contribution to the overall band width, but if the column contribution to peak width is small, extracolumn effects can significantly increase the observed peak width. Fortunately, when using 150–250 mm x 4.6 mm columns packed with 5-μm diameter particles, extracolumn effects are rarely an issue if we take the simple precautions of using 0.007-in. i.d. connecting tubing in conveniently short lengths and making sure the connections are made properly. However, as we'll see in the following discussion, the story can change dramatically when we use conditions that generate small-volume peaks.
Estimating Extracolumn Volume
Critical to the determination of extracolumn effects is the measurement of peak width. If we assume that a normal chromatographic peak is Gaussian in shape (a reasonable assumption), tangents drawn to the sides of the peak will intersect the baseline at ±2σ from the midpoint. In other words, the baseline width of a peak, w, is

This σ is σobs in equation 1, the observed peak width.
We use the peak width to calculate the column plate number, N, also called the column efficiency

which, when combined with equation 2 becomes

where tR is the retention time of the peak. (We need to remember to keep all the units sorted out properly; I want σ in volume units but am making my chromatographic measurements in time units, so before I'm done I need to correct for the flow rate to convert to extracolumn volume.) If we assign σ from equation 3a to σcol, we get

Substituting equation 4 into equation 1,

From our beginning algebra class we remember that a straight line is defined as y = mx + b. So if we plot σobs 2 on the y axis and tR2 on the x axis, we should get a straight line with a slope of 1/N and a y intercept of σec 2 .

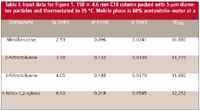
Table I: Input data for Figure 1. 150 x 4.6 mm C18 column packed with 5-μm diameter particles and thermostated to 35 °C. Mobile phase is 60% acetonitrileâwater at a
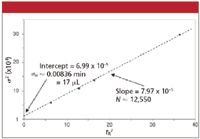
Equation 5 assumes that N and, thus, σcol are constant, which is a reasonable assumption. To use this technique, we need to use compounds that are well-behaved under reversed-phase conditions, which precludes the use of most real samples that generate tailing peaks and otherwise compromise column efficiency. I took data for a set of aromatic compounds shown in Table I and plotted it in Figure 1. I used an Excel spreadsheet to do the calculations and make the plot. In the output of the linear regression in Excel, the "Intercept coefficient" is the value of σ2 where the regression line crosses the y axis, and the "X variable coefficient" is the slope of the line. Taking the square root of each of these values gives us a value ofN≈ 12,550, which is within the 80–100,000 plates/m often quoted by manufacturers for the expected performance of a new 5-μm column with well-behaved test compounds. I made the plot in Figure 1 in time units, so σec ≈ 0.00836 min needs to be converted to volume by multiplying by the flow rate, 2 mL/min to get σec ≈ 17 μL, which is reasonable for a well-plumbed conventional LC system. You can see the influence of this extracolumn band broadening by comparing the 12,550 plate number from the column alone with the observed plate number in the last column of Table I. As expected, the later (and, thus, broader) peaks are less influenced by extracolumn band broadening than are early peaks. It is unlikely that we would observe any degradation of the separation of real compounds using this column and LC system.

Figure 1: Determination of extracolumn volume by a plot of Ïobs2 vs. tR2 for the data of Table I.
When are Extracolumn Effects Important?
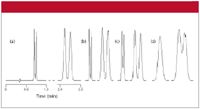
As we saw previously, the 150 mm x 4.6 mm and larger columns packed with 5 μm or larger particles are not negatively impacted by extracolumn effects if we use reasonable care. However, the results change markedly when conditions are changed that result in narrower peak widths. This is illustrated with the data of Table II and partial chromatograms of Figure 2 when 50-mm-long columns were packed with 3-μm packing material. The first peak in each chromatogram of Figure 2 hask = 1 and the third peak is k=5; the retention of peaks 2 and 4 were adjusted for baseline resolution, Rs = 1.5, in the absence of extracolumn effects (Figure 2a). It can be seen that σec = 10 μL of extracolumn band broadening does not affect the separation on the 4.6-mm i.d. column (Figure 2b) — this is because the peaks are still fairly broad. When the column diameter is decreased, the peak volume will decrease with the inverse square of the diameter change. So a change from 4.6 mm to 2.1 mm gives (2.1/4.6)2 ≈ 0.2, or 1/5 the peak width (note that the flow was adjusted in each case for equal linear velocity). If σcol is reduced fivefold and σec remains the same, the extracolumn effects will have a much larger influence on the total bandwidth. This is confirmed with Figure 2c and the corresponding data of Table II showing a loss of 30% in resolution for the first peak. The second peak still has a loss of only 5% in resolution, which likely would go unnoticed in with real samples. The 1.0-mm i.d. column drops the peak width another fivefold and the results are devastating for all peaks in the chromatogram (Figure 2d). In fact, peaks 1 and 2 have merged into a single peak.

Table II: Influence of Ïec = 10 μL on separations on 50-mm-long columns containing 3-μm packing material.
These data serve to illustrate a basic tenant of extracolumn effects: as long as the peak volumes are relatively large, extracolumn effects will be minimal. There are two primary factors contributing to σcol, the column volume and the particle size. Table II and Figure 2 illustrate the influence of the column diameter. Similarly, column length influences peak volume, so longer columns are less susceptible to problems than their shorter counterparts. The particle size also is important. Data similar to those of Table II demonstrate that for a 4.6-mm column, the loss in resolution for the first peak is small for 5 μm particles (1% loss), as it is with 3-μm particles (2% loss, Table II), or even 2-μm particles (3% loss). However, the combination of narrower columns and smaller particles can be a real problem. For example, a 2.1-mm column (other conditions as in Table II) packed with 5-μm particles show 20% loss in resolution, 3-μm particles lose 30% (Table II), and 2-μm particles lose 40% of the resolution.

Figure 2: Influence of Ï = 10 μl extracolumn volume on resolution for 50-mm-long columns packed with 3-μm diameter packing. (a) Ideal case, no extracolumn volume; (b) 4.6-mm i.d. column; (c) 2.1-mm i.d. column; (d) 1.0-mm i.d. column. Data of Table II; see text for discussion.
The Bottom Line
So are we stuck using 150 mm x 4.6 mm columns with 3- or 5-μm particles unless we buy a special low-volume system? Fortunately, the answer is no. You can use 3-μm and even 2-μm particles with reasonable performance in 50-mm-long columns as long as you stay with 4.6-mm i.d. columns. Also, if you develop the methods so that there is a little excess resolution, your method won't suffer too much if you lose 25% of the potential separation you could obtain from an ideal system. This is the strategy used with LC-mass spectrometry (MS) methods which use 50 mm x 2.1 mm columns and 3-μm diameter packings. Yes, the broader peaks will mean that sensitivity will suffer a bit relative to a system that generates narrower (and, thus, taller) peaks. The use of sub-3-μm particles will result in more system pressure, but nearly all of the normal LC equipment is designed to operate up to 6000 psi (400 bar), even though we tend to use it more in the 2000-3000 psi range for most applications.
I encourage you to use the technique of equation 5 and Figure 1 to determine the extracolumn band broadening of your LC system (remember to use the same units throughout). Then you can decide if you need to try to reduce the extracolumn volume. For example, if the example of Figure 1 showed σec > ≈ 25 μL, I would see if I could reduce this by using shorter runs of smaller-diameter connecting tubing, making sure all the fittings were properly assembled, and determining if a smaller detector time constant or faster data collection rate would improve the results.
John W. Dolan "LC Troubleshooting" Editor John W. Dolan is Vice-President of LC Resources, Walnut Creek, California; and a member of LCGC's editorial advisory board. Direct correspondence about this column to "LC Troubleshooting," LCGC, Woodbridge Corporate Plaza, 485 Route 1 South, Building F, First Floor, Iselin, NJ 08830, e-mail John.Dolan@LCResources.com.
For an ongoing discussion of LC troubleshooting with John Dolan and other chromatographers, visit the Chromatography Forum discussion group at http://www.chromforum.com.

Investigating 3D-Printable Stationary Phases in Liquid Chromatography
May 7th 20253D printing technology has potential in chromatography, but a major challenge is developing materials with both high porosity and robust mechanical properties. Recently, scientists compared the separation performances of eight different 3D printable stationary phases.
Characterizing Polyamides Using Reversed-Phase Liquid Chromatography
May 5th 2025Polyamides can be difficult to characterize, despite their use in various aspects of everyday life. Vrije Universiteit Amsterdam researchers hoped to address this using a reversed-phase liquid chromatography (RPLC)-based approach.
New Method Explored for the Detection of CECs in Crops Irrigated with Contaminated Water
April 30th 2025This new study presents a validated QuEChERS–LC-MS/MS method for detecting eight persistent, mobile, and toxic substances in escarole, tomatoes, and tomato leaves irrigated with contaminated water.
University of Tasmania Researchers Explore Haloacetic Acid Determiniation in Water with capLC–MS
April 29th 2025Haloacetic acid detection has become important when analyzing drinking and swimming pool water. University of Tasmania researchers have begun applying capillary liquid chromatography as a means of detecting these substances.

.png&w=3840&q=75)

.png&w=3840&q=75)


.png&w=3840&q=75)


.png&w=3840&q=75)


