Back to Basics: The Role of pH in Retention and Selectivity
LCGC North America
The mobile phase pH can be a powerful tool to control retention and selectivity, but it can also get you in trouble if not controlled properly.
The mobile-phase pH can be a powerful tool to control retention and selectivity, but it can also get you in trouble if it is not controlled properly.
The adjustment of mobile-phase pH can be a powerful tool to obtain liquid chromatographic (LC) separations, but at the same time, poor control of the pH can be a source of serious problems with separations. In this installment of “LC Troubleshooting” I’d like to focus on mobile-phase pH and its role in retention and selectivity.
pH and Retention
In reversed-phase LC, retention is dominated by the overall hydrophobic or nonpolar nature of the analytes. Compounds that are more polar tend to have shorter retention times than their nonpolar counterparts. As a result, the elution order of the typical chromatogram proceeds from polar to nonpolar compounds. If all the sample components are neutral, the mobile-phase pH generally can be ignored as an important factor in retention. This situation is observed in the chromatograms of Figure 1, where the unlabeled peaks eluted between approximately 3 and 9 min are neutral compounds. Notice that the retention of the neutrals is not altered with a change in pH from 7.0 (Figure 1a) to 3.0 (Figure 1b).
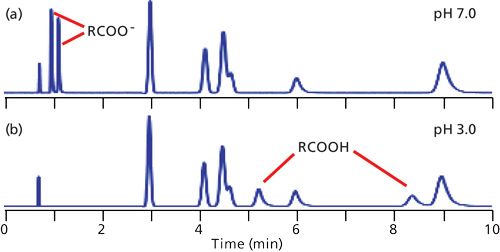
Figure 1: Simulated chromatograms for a mixture of six neutral compounds (unlabeled peaks between approximately 3 and 9 min) and two carboxylic acids at (a) pH 7.0 and (b) pH 3.0. The peak at approximately 0.75 min is t0.
When ionizable analytes are present, dramatic changes in retention can take place when the mobile-phase pH is altered. In Figure 1a, the carboxylic acid components are strongly ionized at pH 7.0, so their negative charge makes them more polar than the same molecules at pH 3.0 (Figure 1b). Thus we can see that pH can have a significant affect on retention of ionizable compounds.
I often cite my “Nothing’s Magic” rule, which says that, in general, we can assume a continuous change in the appearance of a chromatogram between two observed conditions and often can safely extrapolate somewhat beyond the observation points. In the current example, this rule suggests that between pH 7.0 and 3.0, the retention times of the acids will fall between those of Figures 1a and 1b.
Retention of Acids and Bases
The changes in retention for acids and bases with a change in pH, not surprisingly, are in the opposite direction, as shown in Figure 2. In Figure 2a, we see that acids have good retention at low pH and poor retention at high pH, just as we observed in Figure 1. Just the opposite happens for bases (Figure 2b), because at high pH, bases are neutral and well retained, whereas at low pH they are ionized and poorly retained.
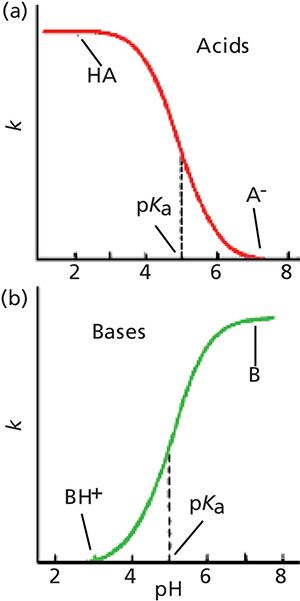
Figure 2: Generalized plots of retention versus mobile-phase pH for (a) acidic samples and (b) basic samples. These plots do not directly correspond to any of the example chromatograms, but rather show the general retention behavior of acids and bases as pH is changed.
At the midpoint of these curves is the pKa of the acid or base, where half of the molecules present are ionized and half are not ionized. Note that although both ionized and nonionized species are present at the pKa, only a single peak is observed. This occurs because the equilibrium between the two forms is so rapid compared to the time it takes for the sample to travel through the column that the analyte behaves chromatographically as the average of the molecules present. As the pH is shifted to a lower pH for acids, the portion of the total molecules present in the un-ionized form increases and the number of ionized molecules decreases, so the overall polarity of the acid decreases, resulting in longer retention times (moving left in Figure 2a). Bases have the opposite response to a change in pH.
Although the change in ionization is significant within approximately 1 pH unit of the pKa, you can see that the curves flatten out at both ends by the point the pH is 2 or more pH units above or below the pKa. It is generally considered that at 2 pH units from the pKa, an acid or base is fully ionized or ionization is fully suppressed. So the effect of a change in mobile-phase pH depends on the pH value compared to the pKa of a compound of interest. This means that if we want to use pH to adjust retention, this will be most effective within approximately 11.5 pH units of the pKa. On the other hand, for the most robust retention conditions, the mobile-phase pH should be >1.5 pH units from the compound’s pKa.
The Selectivity Power of pH
The real beauty of exploring mobile-phase pH during method development for samples that contain acids or bases is that the pH versus retention response curve varies somewhat from one compound to the next, especially if their pKa values differ. In practical terms, this means that significant changes in retention and peak spacing can be obtained with a change in mobile-phase pH. An example of this, as well as further elucidation of the generalized retention behavior of bases in Figure 2b, is shown in Figure 3 for separation of four substituted anilines (1). The peaks in Figure 3a are numbered and they are color-coded for all the peaks in Figure 3 for easier peak tracking. Analyte identities and pKa values for the peaks of Figure 3 are summarized in Table I. Note that the pKa values for these compounds vary from 2.66 to 3.98. The discussion above indicated that pH values within ±1.5 pH units of the pKa will be most effective at changing retention, so we’d expect to see the most peak movement in the pH range of (2.66–1.5) = 1.1 to (3.98 + 1.5) = 5.5. I have shown simulated chromatograms in Figure 3 of 2 ≤ pH ≤ 5.5; pH < 2 may cause column damage and pH > 5.5 showed almost no change from pH 5.5 for these analytes.
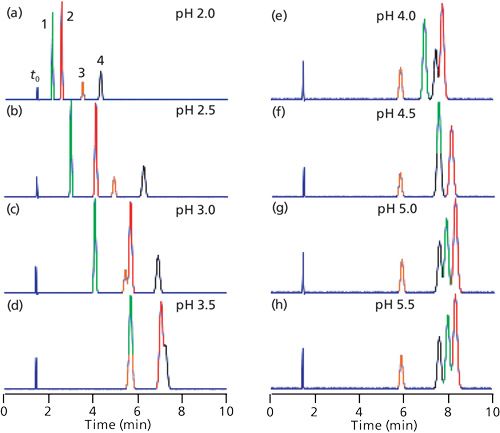
Figure 3: Simulated chromatograms for four substituted anilines at the pH values shown in the figure. Data of Table I of (reference 1), but adjusted for a 150 mm x 4.6 mm column size. Column type: StableBond CN column (Agilent); mobile phase: 25:75 buffer–methanol; buffer: 25 mM sodium citrate (pH ≥ 4.0) or potassium phosphate (pH < 4.0); flow rate: 1 mL/min; temperature: 35 °C. See Table I for compound identities and pKa values (2). The peak at ~1.7 min is t0.
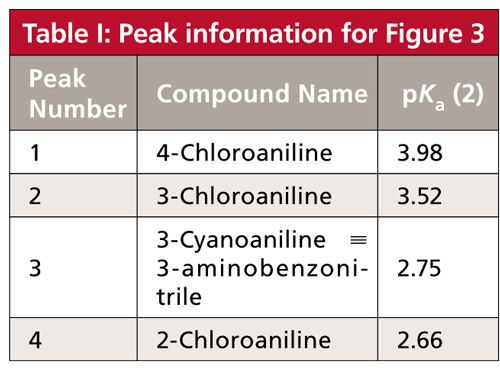
Let’s track the movement of the various peaks and see how they are affected by pH. Peak 4 (black) with pKa = 2.66 will be ionized at pH 2.0, so it is least retained at this pH. As the pH is increased above pH 2.5, the nonionized species predominates and retention increases, as expected. By the point pH 4.0 is reached, ~1.5 pH units above the pKa, the ionization is suppressed (flat region to the right of Figure 2b), and little if any further change in retention is observed in the pH 4.0–5.5 chromatograms. Peak 3 (orange) has a similar pKa (2.75), so very similar behavior is seen for peaks 3 and 4, with stable retention above pH 4.0. Although the retention times of these two peaks change with pH, the selectivity, α, changes only a small amount (range of α = 1.36–1.40), so they nicely separated at all pH values shown. (Recall that α is the ratio of retention factors, k, for two adjacent peaks; in this case, α = k4/k3.)
We can similarly track peak 1 (green, pKa = 3.98) and peak 2 (red, pKa = 3.52). These peaks also move to higher retention times as the pH is increased and ionization subsequently is decreased. However, because the pKa values for peaks 1 and 2 are approximately 1 pH unit higher than those for peaks 3 and 4, the retention times do not stabilize until approximately 1 pH unit higher, as well, at pH 5.0 and above. Unfortunately, the selectivity between peaks 1 and 2 drops with increasing pH, from α = 1.64 at pH 2.0 to 1.05 at pH 5.5, so the separation of these peaks worsens with increased pH.
Mobile-Phase pH and Robustness
Many pharmaceutical laboratories are adopting the quality by design (QbD) guidelines (3) from the International Conference on Harmonization (ICH). These guidelines encourage establishing a design space that encompasses the boundaries of the process variable settings that provide acceptable quality. From a chromatographic standpoint, this means identifying the range that a chromatographic variable can be changed and will still provide acceptable analytical results. In the current context, this means performing robustness experiments to determine how much the mobile-phase pH can be varied and still provide adequate separation.
An example of a method with poor robustness to pH is shown in the chromatograms of Figure 4 for a sample of bile acids (4). In Figure 4a, all the peaks are separated to baseline at a mobile-phase pH of 5.1. However, when the pH is shifted to 5.2 (Figure 4b), the last two peaks merge into a poorly separated doublet (arrow). When a pH meter is used to measure the pH of a solution during pH adjustment, normal laboratory variation is typically ±0.05–0.1 pH units. When the pH of a buffer is adjusted by titration, differences such as those seen between Figures 4a and 4b would not be surprising when different batches of buffer were prepared. As a result, the separation would not be sufficiently robust if a mobile-phase pH value of 5.1 were specified.
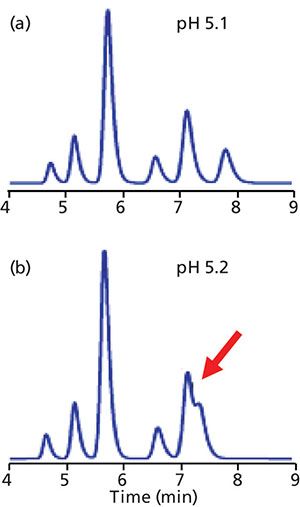
Figure 4: Simulated separations of a sample of bile acids based on data of (reference 3). Mobile-phase pH: (a) 5.1, (b) 5.2.
Let’s consider how to establish satisfactory separation conditions for the sample of Figure 3 that have acceptable robustness. Generally, we like to have isocratic retention factors, k, of 2–10, but 1–20 usually is acceptable if 2–10 is not possible. Also, let’s specify that we want baseline resolution between peaks. In addition we would like a method that tolerates as much variation in pH as possible.
The separation at pH 2.0 in Figure 2a looks good, but the k-values for the first two peaks are <1, so there is a risk of interferences at the column dead time, t0, when real samples are run. At pH 2.5 (Figure 2b), k for the first peak is ~1, and plenty of separation is observed, so this pH is acceptable. At pH 3.0 (Figure 2c), peak 2 has moved partially past peak 3, and the separation is not adequate. At pH 2.75 (chromatogram not shown), peak 3 is just baseline separated after peak 2, so this is about the maximum acceptable pH; at all larger values of pH, peak merging is observed.
With acceptable separations seen over a range of 2.0 ≤ pH ≤ 2.75, we would probably set the default pH midway between these points-for example, at pH 2.35. During validation we could then run experiments at pH 2.05 and 2.65. If these conditions gave satisfactory separation (and other method performance requirements), we could define the method pH as 2.35 and allow adjustment of the pH by up to ±0.3 pH units. Such a statement in the method document would allow the analyst to adjust the pH by up to 0.3 pH units to achieve system suitability.
To ensure that the mobile phase is as stable as possible, we use a buffer in the mobile phase. Buffers are most effective ±1 pH unit from their pKa values. Phosphate has three pKa values, at 2.1, 7.2, and 12.3, so it would be an appropriate buffer to use in the pH 2.35 ± 0.3 range. Contrast this with acetate, with a pKa of 4.8, which would not be an appropriate buffer for the sample of Figure 3. On the other hand, if it were necessary to operate the method of Figure 4 at pH 5.1, acetate would be the right buffer to use, not phosphate. A buffer concentration of 20–30 mM is common for most LC methods, although concentrations as low as 5–10 mM are suitable with today’s high-purity silica columns.
Summary
Mobile-phase pH will have little effect on the retention of neutral compounds, but if ionizable compounds are present in a sample, pH control is necessary to stabilize retention. The pH of the mobile phase can be an extremely powerful tool to move peaks around in the chromatogram during method development, but the flip side is that it needs to be carefully controlled during routine analysis to maintain robust separation conditions. When selecting a buffer to control the mobile-phase pH, be sure to select one with a pKa value within 1 pH unit of the desired pH or it may not have enough buffering capacity to stabilize retention.
References
- J.A. Lewis, D.C. Lommen, W.D. Raddatz, J.W. Dolan, L.R. Snyder, and I. Molnar, J. Chromatogr. A592, 183–195 (1992).
- http://sites.chem.colostate.edu/diverdi/all_courses/CRC%20 reference%20data/dissociation%20constants%20of% 20organic%20acids%20and%20bases.pdf.
- International Conference on Harmonization, ICH Q2(R2) Pharmaceutical Development (ICH, Geneva, Switzerland, 2009).
- D.S. Lu, J. Vialle, H. Tralongo, and R. Longeray, J. Chromatogr. A268, 118 (1983).

John W. Dolan “LC Troubleshooting” Editor John Dolan has been writing “LC Troubleshooting” for LCGC for more than 30 years. One of the industry’s most respected professionals, John is currently a principal instructor for LC Resources in McMinnville, Oregon. He is also a member of LCGC’s editorial advisory board. Direct correspondence about this column via e-mail to LCGCedit@ubm.com

New Study Reviews Chromatography Methods for Flavonoid Analysis
April 21st 2025Flavonoids are widely used metabolites that carry out various functions in different industries, such as food and cosmetics. Detecting, separating, and quantifying them in fruit species can be a complicated process.
Extracting Estrogenic Hormones Using Rotating Disk and Modified Clays
April 14th 2025University of Caldas and University of Chile researchers extracted estrogenic hormones from wastewater samples using rotating disk sorption extraction. After extraction, the concentrated analytes were measured using liquid chromatography coupled with photodiode array detection (HPLC-PDA).

.png&w=3840&q=75)

.png&w=3840&q=75)


.png&w=3840&q=75)


.png&w=3840&q=75)
