Automated Multicolumn Purification of a Histidine-Tagged Protein
The Column
Approximately 40% of recombinant proteins that are purified use a histidine tag for easy capture. This article covers how to automate the purification of histidine-tagged proteins and how purification conditions can be optimized to an automated four-step purification scheme that uses affinity-, ion exchange-, and size-exclusion columns. Using a multistep purification scheme removes the manual steps that cause loss of precious proteins and take more time, like dialysis, collection, and reinjecting samples. The final purification scheme reduces a 3–4-day process to 11.5 h from start to finish, all while improving reproducibility, yield, and comparable purity.
Photo Credit: ISSAH_RUS/Shutterstock.com

Approximately 40% of recombinant proteins that are purified use a histidine tag for easy capture. This article covers how to automate the purification of histidine-tagged proteins and how purification conditions can be optimized to an automated four-step purification scheme that uses affinity-, ion exchange-, and size-exclusion columns. Using a multistep purification scheme removes the manual steps that cause loss of precious proteins and take more time, like dialysis, collection, and reinjecting samples. The final purification scheme reduces a 3–4-day process to 11.5 h from start to finish, all while improving reproducibility, yield, and comparable purity.
Scientists purifying proteins frequently run multiple methods over multiple column chemistries to generate a sufficient amount of sample for their experiments. These individual column purifications, each with their own running conditions and method, are followed by multiple sample fractionations and fraction pooling. A significant amount of time is spent on developing these methods and running the subsequent steps necessary for the purification. A well-designed multidimensional method combines optimized methods for the individual column chemistries, resulting in an automated and highly reproducible multistep procedure.
Engineering a polyhistidine-tagged protein is a commonly performed molecular biology technique where users benefit from a quick and more efficient purification process. This article presents the development of an automated multidimensional method used to purify an N-terminal small ubiquitin-like modifier-tagged C-terminal polyhistidine-tagged superfolder green fluorescent protein (SUMO-6xHis GFPsf), referred to as GFPsf hereafter.
Using Ni2+ immobilized metal affinity chromatography (IMAC) as the capture step in a purification workflow produces sufficiently purified material for some applications. However, many workflows also incorporate intermediate and polishing steps to increase purity of the final product. GFPsf is a commonly purified recombinant engineered protein. The method development of each single-column step can easily be optimized for purity and resolution, and then incorporated into a multi-column method.
The outlined multidimensional method uses the following column chemistries: Ni2+ immobilized metal ion affinity (IMAC), desalting–size exclusion (SEC), anion exchange (AEX), and size-exclusion (SEC) to effectively automate the purification process and improve recovery and reproducibility.
Methods and Results
System Configuration: A three-tier NGC Quest 10 Plus Chromatography System (Bio-Rad Laboratories) was used, configured with a sample pump, multiwavelength UV detector, two buffer inlet valves, two column switching valves (CSVs), and a single outlet valve. The sample pump on the system was used to load sample during the single-step optimizations and for the IMAC purification during the multidimensional method. A multiwavelength UV detector was used to monitor GFP at both 495 nm and 280 nm during development and for recovery calculations. One of the CSVs was substituted with a buffer blending valve module for pH scouting during the AEX column optimization process but placed back into the system for the multidimensional method.
Sample Preparation: Escherichia coli lysate containing GFPsf was clarified by centrifugation at 10,000 rpm for 10 min at 4°C and kept on ice.
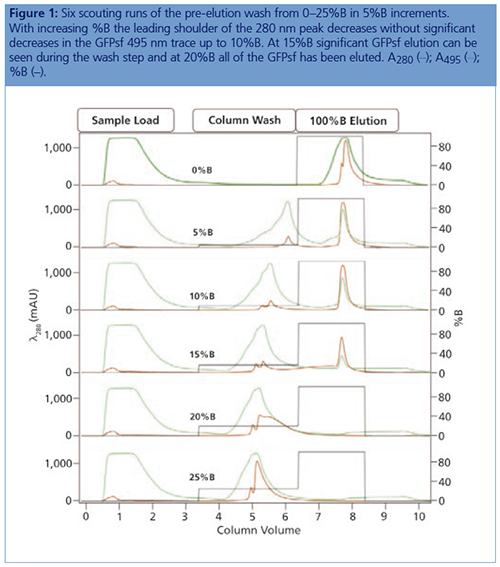
IMAC Capture Optimization: Using a step gradient for the IMAC (IMAC step gradient template in ChromLab Software [Bio-Rad Laboratories]), 2 mL of clarified lysate was loaded onto a 5 mL Bio-Scale Mini Nuvia IMAC Cartridge (Bio-Rad Laboratories) for each run and was equilibrated with 50 mM sodium phosphate, 300 mM NaCl, and 10 mM imidazole pH 7.5. The elution buffer B was 50 mM sodium phosphate, 300 mM NaCl, and 125 mM imidazole pH 7.5. To better understand the binding and elution profile of GFPsf on the cartridge, the scouting feature within the software was used on the 3%B pre-elution column wash phase to generate a series of ten runs with increasing %B column wash steps (0–45% at 5% increments). Figure 1 shows a subset of those runs with an overlay of 0–25%B column wash where contaminating proteins are predominantly being eluted up to 10%B as seen by the decreasing front shoulder of the 280 nm elution peak. At 15%B, the GFPsf begins to elute from the column as seen by the decreasing intensity of the 495 nm peak. Based on these data, the 10%B pre-elution wash and an elution volume of 6 mL were determined to be optimal and used to generate the multidimensional method.
Desalting and AEX Intermediate Optimization: Using a 50-mL Bio-Scale Mini Bio-Gel P-6 Desalting Cartridge (Bio-Rad Laboratories) the IMAC buffer B with imidazole was removed, and the protein was placed into a low ionic strength buffer suitable for loading onto a 5 mm × 50 mm, 1-mL ENrich Q anion exchange column (Bio-Rad Laboratories). IMAC-purified protein (6 mL) was loaded onto the cartridge and eluted by an isocratic flow of AEX buffer A to a final sample volume of ~14 mL.
Anion Exchange Conditions: A linear gradient (an anion exchange step gradient template in the software used) was used to load the desalted GFPsf (~14 mL) onto a 5 mm × 50 mm, 1-mL ENrich Q anion exchange column (Bio-Rad Laboratories). The optimal pH value of Tris buffer was determined using the scouting feature within the software to determine the ideal binding strength and elution profiles; pH scouting runs used Tris pH 7.5, 8.0, and 8.5 (Figure 2[a]). As expected, an increase in binding strength was observed as the pH moved further away from the pI of the protein (pI = 6.2). The final %B concentration in the linear gradient step of the elution phase was scouted against, creating a series of runs from 20–70%B (Figure 2[b]). The scouting data shows a shift in the elution peak during the 50%B endpoint that continued until the entire GFPsf peak was in the linear gradient during the 70%B linear gradient step in ~2 mL elution volume.
SEC Polish Optimization: A 16 mm × 600 mm, 120-mL SEC column (GE Healthcare) was used as the final column in the purification workflow. The purified protein was eluted with an isocratic flow using 25-mM NaPO4 + 150-mM NaCl, pH 7.2 at 0.5 mL/min; no optimization was necessary.
Discussion
Scientists purify proteins to obtain samples necessary for their downstream experiments. It is commonly a multiday, labour-intensive process involving repetitions of single-column purifications, sodium dodecyl sulfate polyacrylamide gel electrophoresis (SDS-PAGE) visualizations, and fraction pooling to get to the desired level of purity and yield. Much time is spent optimizing the binding and elution steps for each individual column. Once the ideal conditions are determined, the method can be routinely followed for subsequent purification runs. Automating this process frees up a significant amount of time for other research activities. Additionally, small batch-to-batch variations between purification runs or by different individuals performing or monitoring the purification are largely eliminated.
One noteworthy observation during the initial IMAC purification was the importance of the %B pre-elution column wash. Weakly or nonspecifically bound proteins washed off with just a small amount of imidazole in the wash. One benefit of using a GFP analogue is the ability to monitor only the protein of interest at 495 nm using multiwavelength detection, an easier way to comparatively analyze runs without depending on SDS-PAGE visualizations. In addition, using a GFP analogue that absorbs at 495 nm prevents interference with other possible coeluting proteins and the imidazole in IMAC buffer B, which absorbs at 280 nm, enabling more accurate peak integration and recovery statistics.
Elution volume is important to consider for any multidimensional method. A good starting point is to use a volume ~2× the column volume (that is, a 2-mL loop for a 1-mL column) because the volume of the column needs to be accounted for even in reverse column elution circumstances. The exception here is desalting columns. Assuming the entire eluted IMAC sample needs to be injected for desalting, a 50-mL desalting cartridge would be required for the eluted IMAC protein stored in the 10-mL sample loop. Running a cartridge with a 10-mL sample loop shows an elution volume of ~15 mL. Since an AEX column follows desalting, a larger volume presents no issues because the protein binds to the column and is concentrated in the process.
Ion exchange offers several different variables to scout against but two of the most common are pH and %B endpoint of a linear gradient. Figure 2(a) shows a simple pH scouting. As expected, the protein binds more tightly with increasing pH and increased displacement from the theoretical pI of 6.2. Peak integration shows a 2% difference in peak area for the three runs in both the 495 nm and 280 nm traces (data not shown) indicating no real binding or elution differences under the various pH conditions. For pH continuity with the PBS used for the IMAC purification, buffer at pH 8.0 was selected.
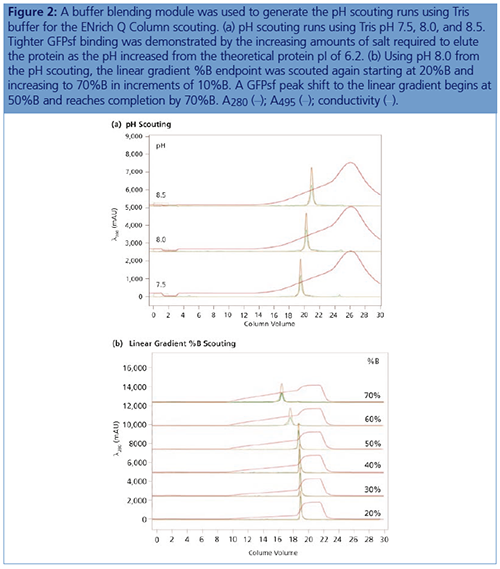
With this information, the elution gradient endpoint was scouted against. Eluting with a linear gradient typically gives the greatest chance of separation from contaminants. Figure 2(b) shows the GFPsf elution peak starting to shift at the 50%B gradient endpoint, transitioning at 60%B with a small population of tighter binding GFP, and finally eluting by the 70%B linear gradient.
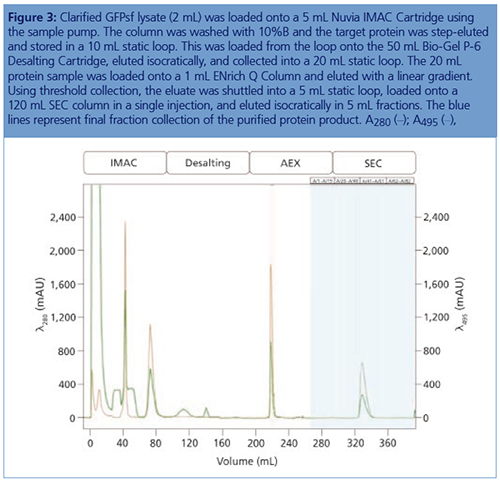
A dextran gel cross-linked with acrylamide column was used as the final polishing column in the purification workflow. Optimization was minimal because the sample volume dictates which SEC column will be used to ensure a single sample injection to maximize recovery. Optimal conditions that provided the best peak separations for individual steps were combined with elution volume information to create the multidimensional method.
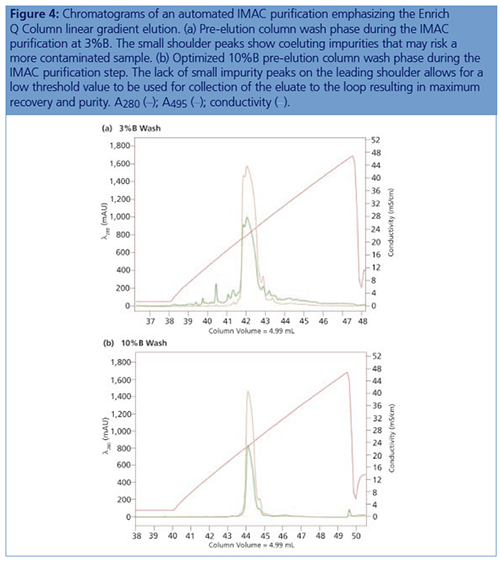
Figure 4 shows the difference between following a standard IMAC–Affinity template 3%B column wash and the optimized 10%B column wash. This helps underline the importance of optimizing each individual step of the purification when constructing a multidimensional method, because choices on the first column affect the efficiency and recovery.
The final automated method took ~11.5 h to run from start to finish, a significant time saving compared to the traditional sequential approach, which would take 3–4 days per sample. Typically, SDS-PAGE is performed and visualized between each step, along with dialysis of the IMAC eluate overnight to remove buffer salts and imidazole. A large part of the multidimensional run is spent on equilibration and elution from a 120-mL SEC column during the traditional approach. Multiple injections on a smaller, more pressure-tolerant SEC column could produce purified protein in ~4.5 h, representing even greater time savings. Beyond time savings an automated workflow increases reproducibility between purification batches by removing potential human error or variability. Ultimately, automated purification shows the most promise for consistent protein production at the laboratory scale.
Conclusion
The creation of an automated multidimensional purification method is often seen as a barrier to achieving truly automated protein purification. Several pieces of data are required prior to generating the multidimensional method. First, optimized conditions for each individual column in the purification must be established. These optimized conditions can be determined by using a variety of methods from simple univariate scouting to more complex multivariate analysis utilizing design of experiment (DoE). Regardless of which method is used, the information about variables such as optimal pH, %B elution, sample loading, and flow rate must be incorporated into the multidimensional method. With this information, the multidimensional method can be constructed from scratch or by using a prewritten 2D template, replicating its method phases with minor edits. Though the method creation in this study uses the example of an automated IMAC purification, most protein purification workflows can be converted into a multidimensional method.
Katie McLaughlin is a global product manager in the Protein Purification Marketing Group at Bio-Rad Laboratories. Katie has 10 years of chromatography experience, focusing primarily on resins and applications.
Candice Cox is a global product manager in the Protein Purification Marketing Group at Bio-Rad Laboratories. She has been with Bio-Rad for over 13 years and has held different marketing and R&D positions within the Life Science Group.
E-mail:katie_mclaughlin@bio-rad.comWebsite: www.bio-rad.com/ResinsAndColumns

New Study Reviews Chromatography Methods for Flavonoid Analysis
April 21st 2025Flavonoids are widely used metabolites that carry out various functions in different industries, such as food and cosmetics. Detecting, separating, and quantifying them in fruit species can be a complicated process.
Quantifying Terpenes in Hydrodistilled Cannabis sativa Essential Oil with GC-MS
April 21st 2025A recent study conducted at the University of Georgia, (Athens, Georgia) presented a validated method for quantifying 18 terpenes in Cannabis sativa essential oil, extracted via hydrodistillation. The method, utilizing gas chromatography–mass spectrometry (GC–MS) with selected ion monitoring (SIM), includes using internal standards (n-tridecane and octadecane) for accurate analysis, with key validation parameters—such as specificity, accuracy, precision, and detection limits—thoroughly assessed. LCGC International spoke to Noelle Joy of the University of Georgia, corresponding author of this paper discussing the method, about its creation and benefits it offers the analytical community.


