Application of Microbore UHPLC–MS-MS to the Quantitation of In Vivo Pharmacokinetic Study Samples
Special Issues
Liquid chromatography coupled with tandem mass spectrometry (LC–MS-MS) is the primary bioanalytical technique used today within the pharmaceutical industry for the quantitation of small molecules in biological matrices such as plasma. In recent years, chromatographic resolution has been improved with the development of ultrahigh-pressure liquid chromatography (UHPLC) systems that utilize smaller diameter particles (< 3 μm) and operate at pressures > 5000 psi. While most LC systems utilized for this application are optimized for columns with internal diameters (i.d.) between 2.0 and 4.6 mm, a new UHPLC system designed for microbore columns (≤ 1 mm i.d.) has been introduced recently. This article will discuss the advantages of using a microbore UHPLC system coupled with a tandem mass spectrometer for the quantitation of in vivo pharmacokinetic samples. These advantages include reduced sample and solvent consumption, improved chromatographic resolution and speed, and reduced mass spectrometer source..
The main bioanalytical technique utilized by preclinical drug metabolism–pharmacokinetic (DMPK) groups for the analysis of small molecule drug entities is liquid chromatography coupled with tandem mass spectrometry (LC–MS-MS) (1–4). The majority of bioanalytical LC–MS-MS systems in pharmaceutical companies utilize 4.6-mm i.d. (analytical) or 2.1-mm i.d. (narrow-bore chromatography) columns with stationary phase particles in the 3–5 μm range. Analytical techniques that provide improved separations and higher throughput are beneficial for addressing the ever-increasing number of samples requiring analysis. Additionally, the ability to analyze smaller sample volumes with increased sensitivity provides new opportunities for designing bioanalytical studies with limited volumes (for example, cerebrospinal fluid, exposure in a single mouse to support pharmacokinetic and pharmacodynamic studies).
One high performance liquid chromatography (HPLC) tool that has recently demonstrated effectiveness for small molecule bioanalysis is microbore HPLC. Microbore columns (≤ 1 mm i.d.) can be packed with the same stationary phases used in conventional 2.1- and 4.6-mm i.d. columns, providing the same separation efficiency (plate counts) and chromatographic selectivity. Stationary phases typically have a lower flow resistance factor when they are packed in microbore columns (5–7). This means that the same linear velocity can be achieved with lower column pressures, or that operation of a microbore system at the same high pressure can provide faster linear velocities and faster analyses than available with conventional systems. The major differences in moving to microbore LC are the reduced column volumes and reduced volumetric flow rates needed for equal linear flow velocities. These reduced volumetric flow rates provide two additional benefits for conducting fast analyses. First, gradient mixing can be accomplished without active mixers and in substantially smaller volumes (both absolute volume and relative to column volume) than those required in conventional LC systems. Second, the thermal burden required to bring the mobile phase to the temperature of the column is reduced substantially and can be accomplished, depending upon flow rate, with no additional hardware or with a simple, very small-volume precolumn heater.
The low flow rates of microbore columns also significantly reduce the amount of mobile phase and therefore solvent consumed per analysis and are readily amenable to interfacing with mass spectrometers using atmospheric pressure ionization (API) interfaces. Reduced solvent consumption results in lower operational costs. Lower flow rates also decrease the energy/heat needed by the API interface, which can increase the life of mass spectrometer components. Microbore columns require smaller sample volumes than their larger diameter counterparts to achieve the same peak concentration and can therefore provide higher sensitivity, particularly when sample volume is limited. Because smaller sample volumes are injected and there is a lower mobile phase burden on the MS interface, less frequent MS source maintenance is required. However, to ensure optimal performance, postmixing volumes — and in particular postcolumn dead volumes — need to be minimized.
Experimental
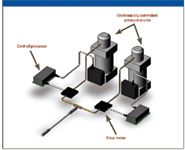
An ultrahigh-pressure liquid chromatography (UHPLC) system (Eksigent ExpressHT-Ultra, Dublin, California) for use with small-bore columns that ensures accurate, precise flow rates and repeatable, precise gradient delivery profiles was used in this study. As illustrated schematically in Figure 1, microfluidic flow control (MFC) employs pneumatically actuated amplifiers to provide high-pressure delivery of each mobile phase. Each pressure source is coupled to a fast response flow meter that monitors the fluid delivery of each channel. A feedback loop makes real-time adjustments to the flow rate. By continuously monitoring the flow from each of the binary systems pumps, the flow rate can be adjusted many times per second. The MFC system has been previously employed in instrumentation for both nanoflow (50–1000 nL/min) and microflow (1–30 μL/min) chromatography in capillary columns. In the ExpressHT-Ultra instrument, the MFC-based fluid delivery system has been extended to provide fast separations at both higher flow rates (up to 200 μL/min) and higher pressures (up to 10,000 psi column pressure).

Figure 1: Schematic of microfluidic flow control (MFC) fluid delivery system used in the ExpressHT-Ultra. The MFC system employs pneumatically actuated amplifiers to provide high-pressure delivery of each mobile phase. Each pressure source is coupled to a fast response flow meter that monitors the fluid delivery of each channel. A feedback loop makes real-time adjustments to the flow rate. By continuously monitoring the flow from each of the binary systems pumps, the flow rate can be adjusted many times per second.
All commercially available reagents and solvents were of either analytical or HPLC grade and were obtained from Burdick & Jackson (Muskegon, Michigan). Several commercially available compounds including haloperidol, verapamil, and buspirone (Sigma-Aldrich, St. Louis, Missouri) were selected for analysis. Samples, standards, and QCs were prepared in rat plasma. Samples underwent protein precipitation before LC–MS-MS analysis. The LC–MS-MS system consisted of an Eksigent ExpressHT-Ultra UHPLC system coupled to a Sciex API 4000 triple-quadrupole mass spectrometer (Life Technologies Corporation, Foster City, California). The system was run under Analyst software (Analyst 1.4.1, Life Technologies Corporation) control.
The UHPLC system consisted of an autosampler, an injection valve with rapid wash, and a binary gradient pumping system capable of delivering flow rates in the 20–200 μL/min range at pressures of up to 10,000 psi. Analytical separations were performed using a 50 mm × 1.0 mm column packed with 2.7-μm HALO C18 stationary phase (Eksigent). Mobile phase A consisted of HPLC-grade water with 0.1% formic acid; mobile phase B contained HPLC-grade acetonitrile with 0.1% formic acid. Compounds were quantitated using selected transitions in a multiple reaction monitoring (MRM) experiment.
The mass spectrometer was operated with the TurboV ionspray source in positive ion mode. A low dispersion ionspray probe (Eksigent) was used. The probe differed from the standard Sciex ionspray probe in that it had a modified union and needle with a smaller inner diameter. Peak area determination, calculation of the ratio between the analyte peak area to IS peak area, and generation of standard curves were performed using Analyst version 1.4.1 software.
Results and Discussion
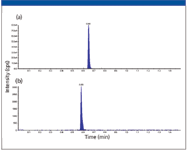
Chromatograms from each of the MRM transitions for two compounds extracted from rat plasma (haloperidol at 200 ng/mL, buspirone at 5 ng/mL) are shown in Figure 2. A rapid gradient method (0.15 min hold at 10% B followed by a 0.85 min gradient to 90% B) at a flow rate of 150 μL/min was used for the separation, with a total cycle time of approximately 1.5 min. The two compounds are detected within 0.75 min and have a peak width (FWHM) of approximately 0.66 s. They are chromatographically resolved from each other, providing good sensitivity and quantitation.

Figure 2: LCâMS-MS chromatogram of a two-component mixture extracted from rat plasma: (a) haloperidol standard at 200 ng/mL and (b) buspirone internal standard at 5 ng/mL extracted from rat plasma. Both compounds were monitored by MRM. The standard was injected onto the UHPLC system using a 1-μL metered injection. The separation was performed on a 50 mm à 1 mm, 2.7-μm Halo C18 column.
A benefit of small diameter columns is a reduction of the required mixing volume. For these experiments, the precolumn mixing volume was approximately 3.5 μL and less than 15% of the column volume. The small mixing volume enables short gradient delays, faster separations, and rapid column and system reequilibration. Cycle times as short as 60 s for high analytical throughput are possible. Because of the fast chromatography, the main limitation to shorter cycle times is the need to perform a thorough cleaning of the injection port and autosampler syringe. A pneumatic wash pump has been developed to provide dual solvent high-speed washing of the injection valve and sample loop. This high-pressure washing is coupled with an injection fountain to provide low carryover with minimized autosampler movement and fast injection-to-injection cycle times. In quantitation studies of verapamil in rat plasma (discussed later), carryover below 0.01% was measured on a blank injection following injection of the high standard (2500 ng/mL).
To study the precision and robustness of the microbore separations, 250 repeated injections of the haloperidol and buspirone sample extracted from rat plasma were performed. As shown in Table I, standard deviations of less than 50 ms and relative standard deviations of <0.15% were measured for the retention times of both compounds. These measurements are limited by the data acquisition rate of the MS system and demonstrate the capabilities of MFC to generate repeatable, rapid gradients over the 6–7 h time course of the experiment.

Table I: Retention times and peak areas for LCâMS-MS chromatograms*
By coupling the precision of the MFC fluid delivery system with a small-volume, high-speed injection valve, a time-slice injection mode can be used to provide reproducible metered injections. This system allows the user to inject very small volumes with high accuracy and low dispersion, to conduct multiple injections from a single filling of the loop, and to inject a wide range of sample volumes without changing hardware or reducing the autosampler speed. The peak area reproducibility for two compounds extracted from rat plasma (haloperidol at 200 ng/mL, buspirone at 5 ng/mL) during the 250 injections described previously are also shown in Table I. Peak area precision below 5% RSD (well within the limits typically required for these assays) was measured for both compounds using a 1-μL metered injection.

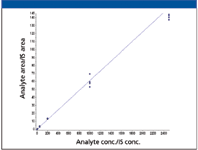
Figure 3: A verapamil standard curve (1â2500 ng/mL) was extracted from rat plasma and injected n = 4 times on the UHPLC system. Linear regression with 1/x 2 weighting was applied (y = 0.161x + 0.0281, r = 0.9947).
One of the applications in an in vivo PK laboratory is the quantitation of small molecules in biological matrices such as plasma. The precision and robustness demonstrated with the microbore LC–MS-MS system are key to obtaining reliable and quantitative results. A calibration curve for verapamil using the same method described previously is presented in Figure 3. Four replicates of samples with standard concentrations between 1 and 2500 ng/mL and three QC concentrations were analyzed and the results are shown in Table II. The calibration curve has a correlation coefficient (r) >0.995. All calibration standards had an accuracy within 9% of nominal concentrations and QC samples at three concentrations were within 7%. Relative standard deviations (RSD) were <12% for all calibration standards and <6% for QC samples. These quantitation results are consistent with a similar study conducted with a conventional LC–MS system using 2.1-mm i.d. columns and a 10-μL injection volume (8) and illustrate that microbore LC–MS can provide accurate results for quantitative bioanalytical studies.

Table II: Verapamil standard curve data
Conclusions
Fueled by the demands for high-throughput analytical methods, the need for faster LC separations and instrumentation continues to grow. This is particularly true in the bioanalytical laboratories supporting pharmaceutical development as the number of samples to be analyzed in drug screening, metabolism, and pharmacokinetic studies increases. The ability to analyze these samples faster, using smaller sample volumes, and with reduced operational costs are attractive drivers for the development of new instrumentation. Microbore LC–MS builds upon currently accepted methods to provide a solution that addresses these needs.
The chromatographic performance and robustness of microbore LC–MS has been illustrated, and the ability to conduct quantitative studies of drug-like compounds in typical sample matrix has been shown. Excellent quantitative performance has been demonstrated using 10% of the injected sample volume and approximately 15% of the overall solvent consumed with a conventional narrow-bore (2.1-mm i.d. column) HPLC system, showing that microbore LC–MS-MS is not only viable, but also a valuable option for bioanalytical laboratories.
Acknowledgments
The authors would like to sincerely thank Heather Skor, David Gale, and Ravi Rahavendran at Pfizer Global Research and Development in LaJolla, California, for participating in the evaluation of the ExpressHT-Ultra system and sharing some of the data collected during that evaluation for presentation here.
David Neyer and Steve Hobbs are with Eksigent Technologies, Dublin, California.
References
(1 M. Jemal and Y.-Q. Xia, Current Drug Metabolism 7, 491–502 (2006).
(2) S. Bansal and A. DeStefano, The AAPS Journal 9, E109–E114 (2007).
(3) C.T. Viswanathan, S. Bansal, B. Booth, A.J. DeStefano, M.J. Rose, J. Sailstad, V. Shah, J.P. Skelly, P.G. Swann, and R. Weiner, The AAPS Journal 9, E30–E42 (2007).
(4) G. Hopfgartner, C. Husser, and M. Zell, Therapeutic Drug Monitoring 24, 134–143 (2002).
(5) Application Note LC-AN-0808-1000, "Lower backpressures for MicroLC columns allow for faster separations," Eksigent Technologies (www.eksigent.com).
(6) D.C. Shelly and T.J. Edkins, J. Chromatogr. 411, 185–199 (1987).
(7) J.P.C. Vissers, H.A. Claessens, J. Laven, and C.A. Cramers, Anal. Chem. 67, 2103–2109 (1995).
(8) Data not shown. Personal communication from H. Skor, D. Gale, and R. Rahavendran.

New Study Reviews Chromatography Methods for Flavonoid Analysis
April 21st 2025Flavonoids are widely used metabolites that carry out various functions in different industries, such as food and cosmetics. Detecting, separating, and quantifying them in fruit species can be a complicated process.
Quantifying Terpenes in Hydrodistilled Cannabis sativa Essential Oil with GC-MS
April 21st 2025A recent study conducted at the University of Georgia, (Athens, Georgia) presented a validated method for quantifying 18 terpenes in Cannabis sativa essential oil, extracted via hydrodistillation. The method, utilizing gas chromatography–mass spectrometry (GC–MS) with selected ion monitoring (SIM), includes using internal standards (n-tridecane and octadecane) for accurate analysis, with key validation parameters—such as specificity, accuracy, precision, and detection limits—thoroughly assessed. LCGC International spoke to Noelle Joy of the University of Georgia, corresponding author of this paper discussing the method, about its creation and benefits it offers the analytical community.


