Anatomy of an Ion's Fragmentation After Electron Ionization, Part I
Special Issues
The authors discuss the use of electron ionization to determine a compound's structure.
Consider the mass spectrum of hexacosane shown in Figure 1. It is easy to understand that the peaks separated sequentially by 14 m/z units represent ions formed by the loss of successively larger alkyl radicals of the form CnH(2n + 1) from different molecular ions. Different molecular ions fragment with the loss of different-sized radicals to produce correspondingly different-sized fragment ions. Clusters of peaks with lower intensities are observed near the peak representing each of these fragment ions. Careful examination of the spectrum reveals that each of the peaks representing fragment ions (which are primary carbenium ions) in the mass spectrum (at odd m/z values) has an associated peak one m/z unit higher, which is the carbon-13 isotope peak. Moreover, as the m/z value of the fragment ion decreases, peaks one, two, and in some cases three or four m/z units less begin to become obvious (see Figures 2 and 3 for an expanded view of the spectrum).

Figure 1
As the m/z values of these primary carbenium ions become smaller, the intensities of adjacent peaks representing the ions at lower m/z values become greater relative to the intensity of the principal peak representing the primary carbenium ion. Also, the intensity of the peaks representing these primary carbenium ions at lower m/z values increases. It has been shown that the ion current for all the primary carbenium ions with an m/z value greater than that of C½nH½(2n + 1) (where n is the total number of carbon atoms) is due only to fragmentation of molecular ions (1). The ion current for all the primary carbenium ions with an m/z value less than that of C½nH½(2n + 1) is due to secondary fragmentation of the higher-mass fragment ions as well as fragmentation of molecular ions. Evidence for this is available from tandem mass spectrometry (MS-MS) studies such as the results shown in Figure 4. For example, some of the ion current at m/z 57 results from the loss of a molecule of ethene (H2C=CH2) from the primary carbenium ion with m/z 85, a hexyl ion. Some of the ion current at m/z 43 is a result of the loss of a molecule of propene (H2C=CHCH3) from other primary carbenium ions with m/z 85, these same hexyl ions. These other primary carbenium ions with m/z 85 could lose a molecule of methane (CH4) to form the ions with m/z 69 (not seen in the product-ion mass spectrum shown in Figure 4). Some of the ion current at m/z 69 does result from the loss of a molecule of hydrogen from the primary carbenium ion with m/z 71; however, the intensity of the peak at m/z 69 cannot be rationalized by this fragmentation alone. Some of these proposed fragmentations of the ion with m/z 85 are supported by the product-ion mass spectrum of m/z 85 shown in Figure 4. Most of the ion current at one m/z unit less than that of the primary carbenium ion with m/z 43 is the result of the loss of a hydrogen radical from the primary carbenium ion.
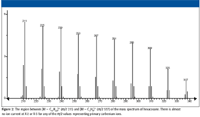
Figure 2
The cluster of peaks immediately preceding a peak that represents a primary carbenium ion often are said to be signature peaks representing an alkyl ion as opposed to an acylium ion, which would have the same integer m/z value (that is, C4H5+ and C2H5CO+ both have a nominal mass of 57 Da). The presence of these peaks usually indicates that the ion is an aliphatic ion or that aliphatic ions are present in the mass spectrum. The absence of these peaks does not necessarily indicate that the m/z value peak represents an ion other than an aliphatic ion (such as an acylium ion RC≡O+ or oxonium ion RH2C=O+H).
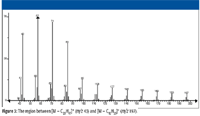
Figure 3
The above etiological diatribe regarding the meaning of some of the peaks in the mass spectrum of a straight-chain aliphatic hydrocarbon should be helpful in understanding how to extract structural information from a mass spectrum of an unknown compound.
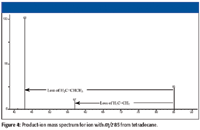
Figure 4
In the evaluation of an electron ionization (EI) mass spectrum, the first step involves determining whether an M+• peak is present. When the M+• peak is determined, the nitrogen rule must be applied to determine if the unknown contains an odd number of nitrogen atoms.
The next step should be to try to identify any odd-electron (OE+•) fragment-ion peaks that may be in the mass spectrum. These peaks will be nonisotope peaks at even m/z values in the mass spectrum where the odd-electron fragment ion does not contain an odd number of nitrogen atoms.
The presence of more than one odd-electron fragment-ion peak may indicate more than one set of γ hydrogens. Often an OE+• fragment ion will be formed by the expulsion of a molecule from the molecular ion, and this odd-electron ion will then lose a molecule to form another odd-electron ion. The presence of these odd-electron ion peaks also indicates that the analyte has nonhalogen heteroatoms present. If one of these odd-electron ion peaks has an m/z value of 58, there is a good probability that the analyte is an aliphatic ketone. A peak at m/z 58 is considered to be diagnostic for aliphatic ketones.
The next step is to determine which peaks in the mass spectrum represent logical losses from the molecular ion. A peak at [M – 15]+ indicates that there is a methyl group present on the analyte and that it is a special methyl such as that found in a methyl ketone. Peaks at [M – 29]+ can indicate the loss of a C2H5• or an H•C≡O radical. Peaks at m/z values that represent ions that have masses of multiples of 14 m/z units + 1, (n[14] + 1), can represent losses of larger carbonyl or aliphatic radicals (such as C3H7+•, C4H9+•, and so forth or CH3+•C≡O, CH3CH2+•C≡O, and so forth). A peak at m/z 99 could represent a C7H15+ ion formed by heterolytic cleavage of the molecular ion of an aliphatic ketone with a C7H15 chain on one side of the carbonyl or the heterolytic loss of CO from an acylium ion with m/z 127 formed by homolytic cleavage with the loss of the moiety on the other side of another molecular ion of the same compound. This peak could also represent an ion formed by γ cleavage from molecular ions of the same aliphatic ketone where the carbonyl is in the number four position (Figure 5) (2).

Figure 5
For a possible indication of which ion is represented, look for a peak that is 28 m/z units higher in the mass spectrum. Be careful, the peak 28 m/z units higher could represent an acylium ion that loses CO, or it could represent another aliphatic ion that loses H2C=CH2. The mass spectra of ketones usually will have peaks representing acylium ions produced by homolytic cleavage of molecular ions, peaks representing aliphatic ions formed by the loss of CO from acylium ions formed by homolytic (alpha) cleavage in response to the charge and radical sites being associated with the carbonyl oxygen, and aliphatic ions that are formed by heterolytic cleavage of the molecular ion (Figure 6). At an integer m/z value resolution, the peaks representing acylium and aliphatic ions can often be isobaric. This complicates the problem.

Figure 6
Consider the mass spectrum of 4-decanone (Figure 7). The M+• peak is at m/z 156. This is consistent with the nominal mass of the analyte being 156 Da. There appear to be two odd-electron ion peaks in the mass spectrum; one at m/z 86 and the other at m/z 58. If this were an unknown spectrum, the peak at m/z 58 would indicate that the analyte might be an aliphatic ketone. The fact that there are two odd-electron ion peaks indicates that there are two sets of γ hydrogens to participate in a γ-hydrogen shift-induced β cleavage. The molecule lost to form the first odd-electron ion has a mass of 70 Da. Assuming that this molecule is an olefin, it will contain five atoms of carbon. The olefin will have the general formula of CnH2n, which means that there are n CH2 units. Dividing 70 by 14 yields the integer 5. The so-called McLafferty Rearrangement (shown in Figure 8) indicates that to have a loss of 70 Da, there must be six atoms of carbon on one side of the carbonyl.
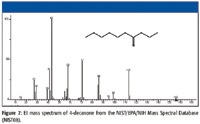
Figure 7
The odd-electron ion with m/z 86 then undergoes a γ-hydrogen shift-induced β-cleavage rearrangement to produce an ion of m/z 58, a loss of 28 Da, meaning that there are three carbon atoms on the other side of the carbonyl carbon (Figure 9). This means that there are a total of 10 carbon atoms including the carbonyl carbon; three carbon atoms on one side of the carbonyl and six on the other side. The three carbon atoms must be an n-propyl group; otherwise, there would be no γ hydrogen, which is required for a fragment ion with m/z 58 to be formed from the ion with m/z 86.

Figure 8
If this were a mass spectrum of an unknown compound, at this point it could be rationalized that the analyte was an aliphatic ketone with the carbonyl on the number 4 carbon atom. The analyte has a nominal mass of 156 Da. The three carbon atoms on the small side of the molecule constitute an n-propyl group. The next step is to determine the arrangement of the six carbon atoms on the other side of the carbonyl. The number of possible arrangements is limited considering the requisite of the analyte having two sets of γ hydrogens. The possible configurations of the six-carbon-atom side chain of the analyte are shown in Figure 10.

Figure 9
Figure 11 illustrates what products will be formed by homolytic and heterolytic cleavage of the molecular ion of this C5H11CH2 (CO)CH2C2H5 ketone. It is now clear that R can be considered to have two atoms of carbon, and R' can be considered to have five atoms of carbon. This means that the R acylium ion will have an m/z value of 71, and the R' acylium ion will have an m/z value of 113. The H2+C-R ion, produced by heterolytic cleavage of the molecular ion with the loss of a H7C3C+•=O radical or by the loss of a molecule of CO from the C6H13C≡O+ acylium ion, will have an m/z value of 85. The H2+C-R' ion, produced by heterolytic cleavage of the molecular ion with the loss of a H13C6C+•=O radical or by the loss of a molecule of CO from the C3H7C≡O+ acylium ion, will have an m/z value of 43. Examination of the mass spectrum in Figure 7 shows that these peaks are present; however, these peaks alone do not necessarily give an indication of the arrangement of the atoms in the six-carbon-atom side chain.
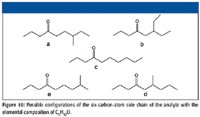
Figure 10
It will therefore be necessary to look at some of the other peaks present in the mass spectrum. Reading the mass spectrum from right to left, there are peaks at m/z 99 and m/z 95. There is a group of peaks over the range m/z 57 to 53, another group over the range m/z 29 to 27, and the obvious group of peaks just following the peak with m/z 43 (m/z 39, 41, and 42). Also, the intensity of the peak at m/z 87 is far too great to represent only the 13C isotope of the OE+• with m/z 86. Therefore, the significance of this ion must be explored.
Aliphatic ketones with a γ carbon that is a non-ω carbon will undergo a γ cleavage (analogous to an α cleavage; not the same as a γ-hydrogen shift-induced β cleavage), resulting in a four-membered cyclic oxonium ion as shown in Figure 5 for a ketone with the carbonyl on the number 4 carbon atom (2). This mechanism dominates over β cleavage or even δ cleavage or ε cleavage. This was confirmed by the examination of the mass spectra of a number of aliphatic ketones with a branch containing four atoms of carbon and another branch with four or more carbon atoms. This γ cleavage could account for the peak at m/z 99. If this is the case, then structures b and d in Figure 11 can no longer be considered to be candidates for this spectrum because of the substitution on the β carbon, which would mean that a loss due to γ cleavage would be less than 57 for molecular ions of these compounds.
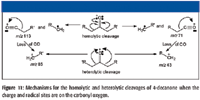
Figure 11
It has been reported, based on deuterium-labeling studies, that acylium ions will lose a molecule of water (3). Although this report did not propose a mechanism for this loss, one possibility is shown in Figure 12. This would explain the peak at m/z 95 as being the loss of H2O from the acylium ion with m/z 113. If this mechanism is true, then there should be a corresponding peak at m/z 53 formed by the loss of H2O from the acylium ion with m/z 71 (Figure 13). Examination of the cluster of peaks just below m/z 57 shows that there is a peak at m/z 53, albeit very small.

Figure 12
It would be possible for a water loss to occur from the 3-methyl or 4-methyl pentyl acylium ions that could be formed from structures a and e as well as from structure c (Figure 14).

Figure 13
Still remaining are a number of peaks unrationalized and no unambiguous resolution to the configuration of the six-carbon-atom side chain of the aliphatic ketone. As a possible solution to these unresolved questions, product-ion mass spectra were obtained. Product-ion mass spectra were also used to confirm the formation of some of the ions that had already been rationalized. The details of how these spectra were obtained are found in the Experimental section of this presentation.
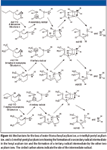
Figure 14
The product-ion mass spectra obtained in this study were produced by a tandem-in-space triple quadrupole mass spectrometer. In such an instrument, product ions formed from the precursor ion isolated by Q1 (MS1) can themselves undergo subsequent collisionally activated dissociation (CAD) in the collision cell (q2). The conversion of precursor ion to product ion is not 100% during the acquisition of the product-ion spectra. The displayed product-ion mass spectrum may contain peaks representing precursor ions, primary product ions, secondary product ions, and tertiary product ions. This fact is an important consideration in the evaluation of these mass spectra.
The first examination is that of the product-ion mass spectrum obtained for the ion with m/z 113 (Figure 15). According to the above rationalizations, some of the acylium ions with m/z 113 should undergo fragmentation to produce ions of m/z 95 (loss of water) and others will produce ions of m/z 85 (loss of CO).
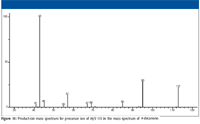
Figure 15
The peaks at m/z 57 and 43 in Figure 15 could represent ions formed by the loss of a molecule of ethene (H2C=CH2) and propene (H2C=CHCH3), respectively, from hexyl ions with m/z 85 formed by the loss of CO from the acylium ion with m/z 113. There is no other straightforward path for the formation of ions with m/z 57 and 43 from the precursor ion with m/z 113. Explanations of the peaks at m/z 45, 67, and 69 may not be as easy. It is possible that the ion current at m/z 69 is due to a loss of methane from the aliphatic ion with m/z 85, which means that the peak at m/z 67 could represent an ion formed by the loss of a hydrogen molecule from the ion with m/z 69; however, this was not observed in the MS-MS experiment (Figure 16). A rationalization for the peaks at m/z 41 and 42 may be a secondary fragmentation of the ion with m/z 43, and the peak at m/z 55 could also represent an ion formed by the loss of a molecule of hydrogen from the ion with m/z 57.
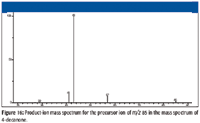
Figure 16
Examination of the product-ion mass spectrum (Figure 16) of the precursor ion of m/z 85 from the mass spectrum of 4-decanone also indicates that the ions with m/z 57 and m/z 43 are a result of the fragmentation of ions with m/z 85 with the respective losses of ethene (28 Da) and propene (42 Da). Some of the ion current at m/z 43 in the original mass spectrum is the result of heterolytic cleavage at the number 3 carbon atom of the molecular ion (Figure 11). The product-ion mass spectrum of m/z 85 also indicates that ions of m/z 41 and m/z 29 could be formed by the ions with m/z 57. This is confirmed by examination of the product-ion mass spectrum of the ion with m/z 57 (Figure 17) from the original EI mass spectrum (Figure 7). Figures 18 and 19 show possible mechanisms for the formation of ions with m/z 29 (loss of ethene) and m/z 41 (loss of methane) from the aliphatic ion with m/z 57. There is no support for the formation of the ion with m/z 69 from the product ion mass spectrum produced by the ion with m/z 85 (Figure 16), and it will be necessary to look elsewhere for the sources of the ions with m/z 67 and 69.

Figure 17
The product-ion mass spectrum of the ion with m/z 57 (Figure 17) does not strongly support the formation of the ion with m/z 55 as a product from the loss of a hydrogen molecule because of the relatively low intensity of the peak at m/z 55; however, the indication that the ion with m/z 55 is formed from the ion with m/z 57 is obvious.

Figure 18
Examination of the product-ion mass spectrum for the precursor ion with m/z 43 (Figure 20) confirms that the ion with m/z 27 is formed by the loss of a molecule of methane from the propyl ion with m/z 43.

Figure 19
The product-ion mass spectrum of ions with m/z 71 (Figure 21) supports the contention that the propyl acylium ions will lose CO to form propyl ions. However, this mass spectrum does not show any ion current at m/z 53 (loss of H2O from the acylium ion with m/z 71); therefore, the origin of the ion with m/z 53 is not revealed although a peak representing this ion is observed in the EI mass spectrum (Figure 7). The lack of a peak at m/z 53 in the product-ion mass spectrum of the ion with m/z 71 could be due to the relatively poor ion counting statistics involved in an MS-MS analysis (diminished ion current) as compared to those associated with the EI process.
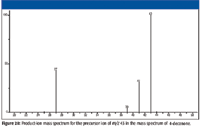
Figure 20
Product-ion mass spectra for ions with m/z 99 and m/z 95 (Figures 22 and 23) were examined to see if they could provide any additional information. Ions with m/z 99 (products of γ cleavage, Figure 5) appeared to fragment to produce ions of m/z 57. A possible mechanism is illustrated in Figure 24. This product ion with m/z 57, shown in Figure 24, is not likely to undergo secondary fragmentation supported by the product ion mass spectrum of m/z 57 (Figure 17). The product ions of precursor ions with m/z 57 represented in Figure 17 would support the fact that, at least in part, the peak with integer m/z 57 represents butyl ions (C4H9+) because the product ions with m/z 41 and m/z 29 could be rationalized by the loss of methane (CH4) and ethene (H2C=CH2) molecules, respectively. This indicates that the peak with integer m/z 57 is actually a doublet representing C4H9+ with a mass of 57.070425 Da and C3H5O+ with a mass of 57.034040 Da. Although not indicated by the product-ion mass spectrum shown in Figure 22, it is possible that the ion with m/z 55 could result from the loss of a hydrogen molecule from the ion with m/z 57, which would mean that the peak with integer m/z 55 could also be a doublet (C4H7+ with a mass of 55.054775 Da and C3H3O+ with a mass of 55.018390 Da) requiring a Δm (a mass spectral resolution) of < 0.04 for separation of the two ions.

Figure 21
As shown in Figure 12, the acylium ion with m/z 113 loses H2O to produce the even electron diene H3C–CH2–CH2=CH–CH=CH–CH2+. Then, based on the product ion mass spectrum of m/z 95, some of these ions lose ethene (H2C=CH2) to form ions of m/z 67; others lose a molecule with an elemental composition of C3H4 (H2C=C=CH2 or H3C–C≡CH) and a mass of 40 Da to form the ion with m/z 55. The mechanism for this latter loss is much more difficult to propose than the loss of ethene.
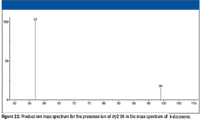
Figure 22
A search of the NIST/EPA/NIH Mass Spectral Database for spectra of the two structures yet to be eliminated (a and e) resulted in a hit for 8-methyl-4-nonanone (structure e). The spectrum for this compound is shown in Figure 25. The head-to-tail comparison of the spectra of 4-decanone and 8-methyl-4-nonanone (Figure 26) shows remarkable similarities except for the intensities of the peaks at m/z 156, 138, 95, and 69.
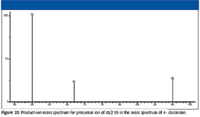
Figure 23
Perhaps the most significant differences between the two spectra are the intensities of the peaks at m/z 95 and m/z 69. It has already been established that the formation of the ion with m/z 95 in the mass spectrum of 4-decanone is the result of a complex rearrangement that goes through two 1–5 hydrogen-shift transitions followed by two 1–3 hydrogen-shift transitions (Figure 14, top), resulting in the loss of a molecule of water. The first of these reactions, which eventually results in the loss of water from the n-hexyl acylium ion with m/z 113, brings about the formation of a secondary radical. However, as can be seen from the middle and bottom mechanisms in Figure 14, if these 1–5 rearrangements occur in acylium ions formed by the loss of a propyl radical from 8-methyl- or 7-methyl-substituted 4-nonanones, the result will be a tertiary radical.

Figure 24
The stability of the tertiary radical is much greater than that of the secondary radical, and this probably accounts for the higher abundance of the ion with m/z 95, which results from a secondary fragmentation of the acylium ion by the loss of water in the mass spectrum of the 8-methyl-substituted 4-nonanone.
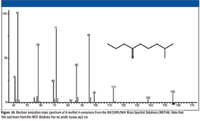
Figure 25
The difference in the stability of a primary radical and a secondary radical is often discussed with respect to the intensity of the peaks representing ions formed due to 1–5 hydrogen rearrangements associated with what is commonly called the McLafferty Rearrangement. If the intermediate in the formation of these ions is a primary radical, the intensity of the subsequent odd electron ion peak is much less than when the intermediate is a secondary radical. Examination of the mass spectra of n-propylbenzene (rearrangement results in a primary radical) and n-butylbenzene (rearrangement results in a secondary radical) shows that the intensity of the peak representing such an odd electron ion in the spectrum of n-propylbenzene is indistinguishable from the isotope peak associated with the peak representing the tropylium ion, which is the base peak in this spectrum, whereas the peak representing the same odd-electron ion in the spectrum of n-butylbenzene has an intensity that is 75% of the intensity of the base peak, which also represents a tropylium ion. Considering the dramatic differences associated with primary and secondary radical formation in the n-propyl/n-butylbenzene example, the difference in the abundances of the ion with m/z 95 represented by the spectra of 4-decanone and 8-methyl-4-nonanone, as a result of respective secondary and tertiary radical formation, is surprising.
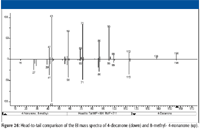
Figure 26
The mass spectra of several different alkyl-substituted linear alkyl ketones were examined to see whether peaks representing water-loss ions from acylium ions through a tertiary radical transition showed significant peak intensities for these ions, and was found to be the case for 11-methyl-4-dodecanone (CASrn 29366-35-6), 6-ethyl-3-decanone (CASrn 40237-86-3), 2,6,8-trimethyl-4-nonanone (CASrn 123-18-2), and 10-methyl-4-undecanone (CASrn 29379-12-2), whereas the acylium ion loss of water products for the n-alkyl ketones of the same elemental composition was represented by peaks more comparable in intensity to those representing the same ions in 4-decanone.
A search of the NIST08 Mass Spectral Database for spectra containing a peak at m/z 113 representing an n-hexyl acylium ion resulted in a list of 15 compounds in addition to 4-decanone. All of these spectra exhibited peaks at m/z 95 and m/z 69 with intensities similar to those for peaks at these same m/z values in the spectrum of 4-decanone.
On the basis of these observations of other spectra (both of linear alkyl ketones and branched alkyl ketones) and the above rationalizations, it is likely that if the structure of an unknown analyte were being elucidated from the mass spectrum in Figure 7, then the correct answer would be 4-decanone.
It should also be noted that the intensity of the molecular ion peak in the spectrum of 8-methyl-4-nonanone is almost an order of magnitude greater than that of the molecular ion peak for 4-decanone. The intensities of most of the other peaks in the spectrum of 8-methyl-4-nonanone relative to the base peak at m/z 43 are much greater than those in the spectrum of 4-decanone. The NIST Mass Spectral Database Archive has only one spectrum for 8-methyl-4-nonanone, and this spectrum may be saturated (evidence is presented later). There are multiple spectra for 4-decanone in the Database Archive, and all show similar intensities to one another; therefore, it is more likely that the spectrum of 4-decanone is more representative of the true spectrum than is the spectrum of 8-methyl-4-nonanone.
The three replicate spectra of 4-decanone in the NIST08 database all exhibit a peak at m/z 138; however, its relative intensity is 1 (out of 1000 counts), whereas the intensity for this peak in the spectrum of 8-methyl-4-nonanone is 40, which is another possible indication that the mass spectrum of 8-methyl-4-nonanone is saturated. On the other hand, the peak at m/z 138 probably represents an ion formed from the loss of water from the molecular ion of the enol form of the ketone (4,5). The reason this occurs to a greater extent in the fragmentation of 8-methyl-4-nonanone is possibly due to the formation of a tertiary radical when the hydrogen shift occurs in the molecular ion. This would require a 1–6 rearrangement, which might be facilitated by the double bond on the carbinol carbon.
Ions with m/z 55 are formed by fragmentation of butyl ions through the loss of a hydrogen molecule from the ions produced by the secondary fragmentation of the hexyl ions (first a loss of H2C=CH2 followed by the loss of H2), which in turn were produced by either heterolytic cleavage of molecular ions or loss of CO from acylium ions with m/z 113 or through the fragmentation of the C7H11 diene ion with m/z 95 formed by the loss of a molecule of water from the hexyl acylium ion resulting from homolytic cleavage of the molecular ion with the loss of a propyl radical through the loss of a molecule of allene (H2C=C=CH2). A third possible origin for ions with m/z 55 is through the secondary fragmentation resulting in the loss of a molecule of hydrogen from the C3H5O ion formed as a product of the γ-cleavage product (Figure 19), although this is not indicated by the product-ion mass spectrum of the ion with m/z 57 (Figure 17).
One way to sort out what might be occurring in the formation of ions with m/z 57 and m/z 55 would be to obtain accurate mass assignments for these ions. The instrumentation available for this study reported m/z values to the nearest 0.05 m/z units, and the instrument's resolution was ±0.3 m/z units. Data were acquired for 4-decanone using an Agilent 5975C Inert MSD system (Santa Clara, California) operated in the Raw Scan Acq. mode (MS SIM/Scan mode dialog box) with the threshold set to 0 in the threshold and sampling rates tab of the Edit Scan Parameters dialog box. This causes 10 measurements to be acquired and recorded for each m/z unit in the spectrum acquisition range. This is referred to as "acquiring data in the profile mode."
These data were then treated using Cerno Bioscience MassWorks software (Danbury, Connecticut), which provides accurate mass assignments for such data. The accurate mass assignments for ions in the 4-decanone mass spectrum at m/z 27, 29, 41, 43, 58, 71, 86, 95, 99, 113, and 156 (the molecular ion peak) indicated that all of these ions were monoisotopic. Their accurate mass assignments were within a few millimass units of the calculated exact masses for their believed-to-be elemental compositions. The accurate mass assignments for ions with m/z 55 and 57 were significantly different than those for any of the suspected elemental compositions. This was an indication that these peaks represented multiplets rather than monoisotopic species.
The CLIPS utility in the MassWorks software allowed for the deconvolution of the doublets comprised by the mass spectral peaks with m/z 55 and m/z 57. The peak at m/z 57 not only comprised the two ions with nominal m/z 57, but there also was a significant contribution from the peak at m/z 58, which has an intensity about twice that of the peak at m/z 57.
The one remaining unexplained peak is that at m/z 69. An accurate mass determination of this ion using the MassWorks software confirmed an elemental composition of C5H9 for this ion. A possible explanation for the origin of this ion would be the loss of a molecule of formaldehyde (H2C=O, 30 Da) from the oxygen-containing ion with m/z 99 formed by a γ cleavage of the molecular ion. Again, a mechanism for this reaction is not straightforward; but based on the m/z values, such a loss makes sense.
To identify the precursor ion or ions for m/z 69, a precursor-ion analysis was carried out using the Chromsys/Agilent triple-quadrupole gas spectrometry (GC)–MS system where the first analyzer was scanned over an m/z range of 59–167, and the second analyzer was set to allow only ions of m/z 69 to reach the detector (Figure 27). This analysis showed that there were actually two different ions that were precursors of m/z 69. The first ion was m/z 113, which is confirmed by examination of the product-ion mass spectrum of m/z 113 (Figure 15). This means that the neutral loss has a nominal mass of 44. This could be the loss of CO from the acylium ion with m/z 113 to form an aliphatic ion with m/z 85, followed by the loss of a molecule of methane. However, if this is the explanation for the origin of the ion with m/z 69, then the product-ion mass spectrum of m/z 85 should have a peak at m/z 69 (Figure 16), and that is not the case. The ion at m/z 69 appears to be formed by a single loss from the acylium ion with m/z 113. A molecular weight search of the NIST08 Database for compounds containing only C, H, and O and that have a nominal mass of 42 Da revealed two compounds: ethylene oxide and acetaldehyde (H3C–HC=O). However, although no spectrum for this compound is present in the NIST08 database, a third compound is also a possibility: vinyl alcohol.
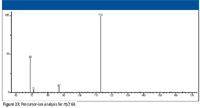
Figure 27
Part II will continue the discussion of ion fragmentation following electron ionization and will appear in an upcoming issue of Spectroscopy's "Current Trends in Mass Spectrometry."
O. David Sparkman, Patrick R. Jones, and Matthew Curtis are with the Pacific Mass Spectrometry Center, Chemistry Department, College of the Pacific, University of the Pacific, Stockton, California.
References
(1) A. Lavanchy, R. Houriet, and T. Gäumann, J. Org. Mass Spectrom. 14(2), 79–85 (1979).
(2) H. Budzikiewicz, C. Djerassi, and D.H. Williams, Mass Spectrometry of Organic Compounds (Holden-Day, San Francisco, 1967), p. 138.
(3) W. Carpenter, A.M. Duffield, and C. Djerassi, J. Am. Chem. Soc. 90, 160–164 (1968).
(4) H.E. Audier, A. Milliet, and J.C. Tabet, Helv. Chim. Acta 63, 344–358 (1980).
(5) J.R. Dias, Y.M. Sheikh, and C. Djerassi J. Am. Chem. Soc. 94(2), 473–481 (1972).

Polysorbate Quantification and Degradation Analysis via LC and Charged Aerosol Detection
April 9th 2025Scientists from ThermoFisher Scientific published a review article in the Journal of Chromatography A that provided an overview of HPLC analysis using charged aerosol detection can help with polysorbate quantification.
Analyzing Vitamin K1 Levels in Vegetables Eaten by Warfarin Patients Using HPLC UV–vis
April 9th 2025Research conducted by the Universitas Padjadjaran (Sumedang, Indonesia) focused on the measurement of vitamin K1 in various vegetables (specifically lettuce, cabbage, napa cabbage, and spinach) that were ingested by patients using warfarin. High performance liquid chromatography (HPLC) equipped with an ultraviolet detector set at 245 nm was used as the analytical technique.
Removing Double-Stranded RNA Impurities Using Chromatography
April 8th 2025Researchers from Agency for Science, Technology and Research in Singapore recently published a review article exploring how chromatography can be used to remove double-stranded RNA impurities during mRNA therapeutics production.


