Analysis of Polyethylene by Pyrolysis-GC×GC–MS
The Application Notebook
This application note shows the pyrolysis-GC×GC–HRMS profiles of crude oils for more detailed separations and more complete characterization of complex matrices, especially on the speciation of heteroatoms such as sulphur-containing compounds.
This application note shows the pyrolysis-GC×GC–HRMS profiles of crude oils for more detailed separations and more complete characterization of complex matrices, especially on the speciation of heteroatoms such as sulphur-containing compounds.
Pyrolysis, coupled to comprehensive two-dimensional gas chromatography-high resolution mass spectrometry (pyGC×GC–HRMS), is a very powerful technique for the characterization of complex, heavy matrices such as crude oils. The two-dimensional resolution provides enhanced separation of the pyrolysis products, leading to improved classification for groups and individual analytes. Additionally, the 2D pyrograms make sample comparison easier and more informative. Here we show the use of py-GC×GC for improved characterization and comparison of crude oils and the advantages arising from HRMS detection for speciation of heteroatoms such as sulphur-containing compounds.
Experimental Details
Three different crude oil samples were pyrolyzed at 750 °C for 15 s using a CDS Pyroprobe coupled to an Agilent 7890B GC equipped with a Zoex ZX2 cryogen-free thermal modulator and an Agilent 7200B QTOF detector.
Results and Discussions
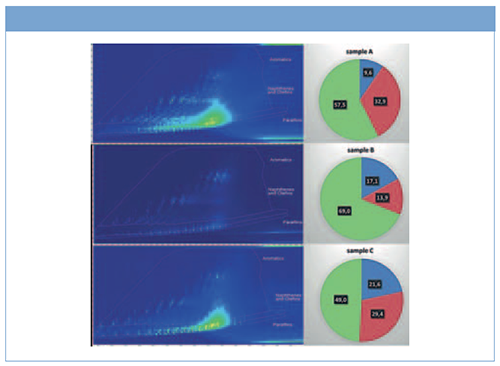
Figure 1 shows the 2D separation obtained for the crude oils with corresponding percent response for paraffins, naphthenes and olefins, and aromatics (green). The two-dimensional chromatographic separation allows for the efficient separation of different chemical groups fully coeluting on the nonpolar primary column and are hereby effectively separated based on polarity on the second dimension. The 2D plots include a template designed to outline the distribution of the main aliphatic and aromatics hydrocarbons groups. The amount of each group is clearly different in the three samples: sample B is mostly aromatic, with significant paraffinic content and very low in naphthenes; samples A and C are mostly naphthenic, but sample C has more paraffins while being clearly poorer in aromatics.


Figure 1: TIC 2D plots for crude oil A (top), B (middle), and C (bottom) and corresponding calculated percent response for paraffins (blue), naphthenes and olefins (red), and aromatics (green) for each sample.
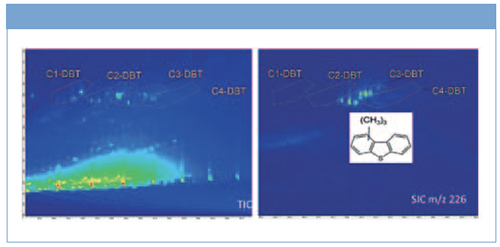
Given their high relevance for the petrochemical industry, we focused on evaluating the presence of sulphur-containing compounds of potential interest. Figure 2 shows part of a template that indicates the location of the dibenzothiophenes with different degrees of alkyl-substitution, constructed by looking for the masses corresponding to the specific molecular formulas. This figure shows the example for dibenzothiophenes with three methyl groups. These are fully separated by the large aliphatic signal on the secondary column, making detection and identification (and potentially quantification) much easier and more accurate. Numerous isomers are present, differing only on the position of the alkyl-substitutions. Some blobs are fully coeluting on the primary column and, given the fact that the MS spectra will be close to identical, can be resolved and distinguished as different compounds only thanks to the enhanced two-dimensional resolving power.

Figure 2: TIC 2D plot (left) and selected ion chromatogram (right) with template showing the location of dibenzothiophene (DBT) groups with different degree of alkyl-substitution for sample A.


CDS Analytical
465 Limestone Road
Oxford, Pennsylvania 19363, USA
Website: www.cdsanalytical.com


Free Poster: NDSRI Risk Assessment and Trace-Level Analysis of N-Nitrosamines
April 25th 2025With increasing concern over genotoxic nitrosamine contaminants, regulatory bodies like the FDA and EMA have introduced strict guidelines following several high-profile drug recalls. This poster showcases a case study where LGC and Waters developed a UPLC/MS/MS method for quantifying trace levels of N-nitroso-sertraline in sertraline using Waters mass spectrometry and LGC reference standards.
New TRC Facility Accelerates Innovation and Delivery
April 25th 2025We’ve expanded our capabilities with a state-of-the-art, 200,000 sq ft TRC facility in Toronto, completed in 2024 and staffed by over 100 PhD- and MSc-level scientists. This investment enables the development of more innovative compounds, a broader catalogue and custom offering, and streamlined operations for faster delivery. • Our extensive range of over 100,000 high-quality research chemicals—including APIs, metabolites, and impurities in both native and stable isotope-labelled forms—provides essential tools for uncovering molecular disease mechanisms and exploring new opportunities for therapeutic intervention.
New Guide: Characterising Impurity Standards – What Defines “Good Enough?”
April 25th 2025Impurity reference standards (IRSs) are essential for accurately identifying and quantifying impurities in pharmaceutical development and manufacturing. Yet, with limited regulatory guidance on how much characterisation is truly required for different applications, selecting the right standard can be challenging. To help, LGC has developed a new interactive multimedia guide, packed with expert insights to support your decision-making and give you greater confidence when choosing the right IRS for your specific needs.
Using the Carcinogenic Potency Categorisation Approach (CPCA) to Classify N-nitrosamine Impurities
April 25th 2025Learn how to manage nitrosamine impurities in pharmaceuticals with our free infographic. Discover how the CPCA approach establishes acceptable intake limits and guides the selection of NDSRI reference samples. Stay compliant and ensure safety with our ISO-accredited standards.

