Analysis of Volatile Organic Pollutants in Water Using Headspace–Trap GC–MS: Maximizing Performance for ppt‑Level VOCs
A broad range of trace-level volatile organic compounds (VOCs) was detected in drinking water using headspace–trap sampling. Analysis of a 72-component standard mix using gas chromatography–mass spectrometry (GC–MS) with selected ion monitoring (SIM) acquisition provided mean detection limits as low as 2 ppt, with excellent mean linearities (R2 0.999), recoveries (97.8%), and repeatabilities (4.7% relative standard deviation [RSD])—a performance that is comfortably lower than required by all major regulations. In addition, tap water was found to contain a range of VOCs at low-to-medium levels (2–200 ppt), in addition to ppb-level chlorinated compounds.
Chemical contamination of rivers, reservoirs, and groundwater used as sources of drinking water originates from intentional and accidental discharges from industry, agriculture, and urban pollution. This contamination requires extensive treatment, but such processes can also result in the formation of contaminants such as the trihalomethanes that are formed by the reaction of the common oxidant chlorine with organic matter. Such contamination is naturally of concern, and acceptable levels for the volatile organic compound (VOC) content of drinking water are specified by a variety of regulatory bodies, including the US Environmental Protection Agency (EPA), Chinese EPA, European Environment Agency (EEA), Canadian Drinking Water Quality Guidelines (DWQG), and the World Health Organization (WHO).
Headspace analysis is a well-established and robust method for the determination of VOCs in water, but in certain aspects it offers limited flexibility. In particular, the injection of larger headspace sample volumes to improve sensitivity can cause undesirable chromatographic effects such as broad or split peaks, and options such as multiple injections are usually not possible. There are also limited options for water management, meaning that analyses can suffer from reduced analyte response and repeatability, as well as negative impacts on column and detector lifetime.
In this study, we demonstrate how the use of a backflushed, cryogen-free focusing trap packed with multiple sorbent beds, in conjunction with gas chromatography–mass spectrometry (GC–MS), can overcome such issues for the headspace analysis of residual VOCs in drinking water. In particular, we show how selected ion monitoring (SIM) acquisition allows quantitation of target analytes at low-ppt levels, while avoiding issues relating to interference from water.
Experimental
Calibration Standards: A set of calibration standards at seven levels from 50 ppt (50 ng/L) to 20 ppb (20 µg/L) was prepared by volumetric dilution of a 2000-ppm stock solution using high performance liquid chromatography (HPLC)-grade methanol. The mix contained 72 components, including one internal standard (fluorobenzene) and two surrogate standards (4-bromofluorobenzene and 1,2-dichlorobenzene-d4). The volatility of the compounds in the standard mix ranged from dichlorodifluoromethane (b.p. –29.8 °C) to 1,2,3-trichlorobenzene and naphthalene (b.p. 218 °C) and included six compounds that are gases at ambient temperature. The methanol solutions were spiked into HPLC‑grade water (10 mL) contained in a standard 20-mL crimped‑top vial prior to headspace–trap GC–MS analysis. Calibration curves and performance results were calculated based on the on-column concentration as detected by the MS system.
Drinking Water: Tap water (10 mL) from a source in South Wales, UK, was added to a 20-mL headspace vial containing sodium sulfate (2.5 g; 25% w/v). The sample was spiked with the internal standard (2.0 ppb; 2.0 μg/L) and capped.
Sampling and Preconcentration: Instrument: Centri (Markes International); headspace–trap: headspace sample: 1 mL; incubation: 80 °C (10 min); injection: 200 °C (2 min).
Preconcentration: Focusing trap: ‘TO-15/TO‑17 Air toxics’ (part no. U-T15ATA-2S, Markes International); purge flow: 50 mL/min for 1 min; trap low: 20 °C; trap high: 280 °C (0.5 min); split ratio: 5:1.
GC: Column type: 30 m × 250 μm, 1.4-μm MEGA-624 (Mega); column flow: 2 mL/min (constant flow); purge flow: 3 mL/min; oven program: 35 °C (3 min), then 10 °C/min to 100 °C, then 30 °C/min to 220 °C (1 min). Quadrupole MS: Transfer line: 180 °C; ion source: 300 °C; mass range: m/z 35–300; SIM groups: multiple; tune type: E-tune.
Results and Discussion
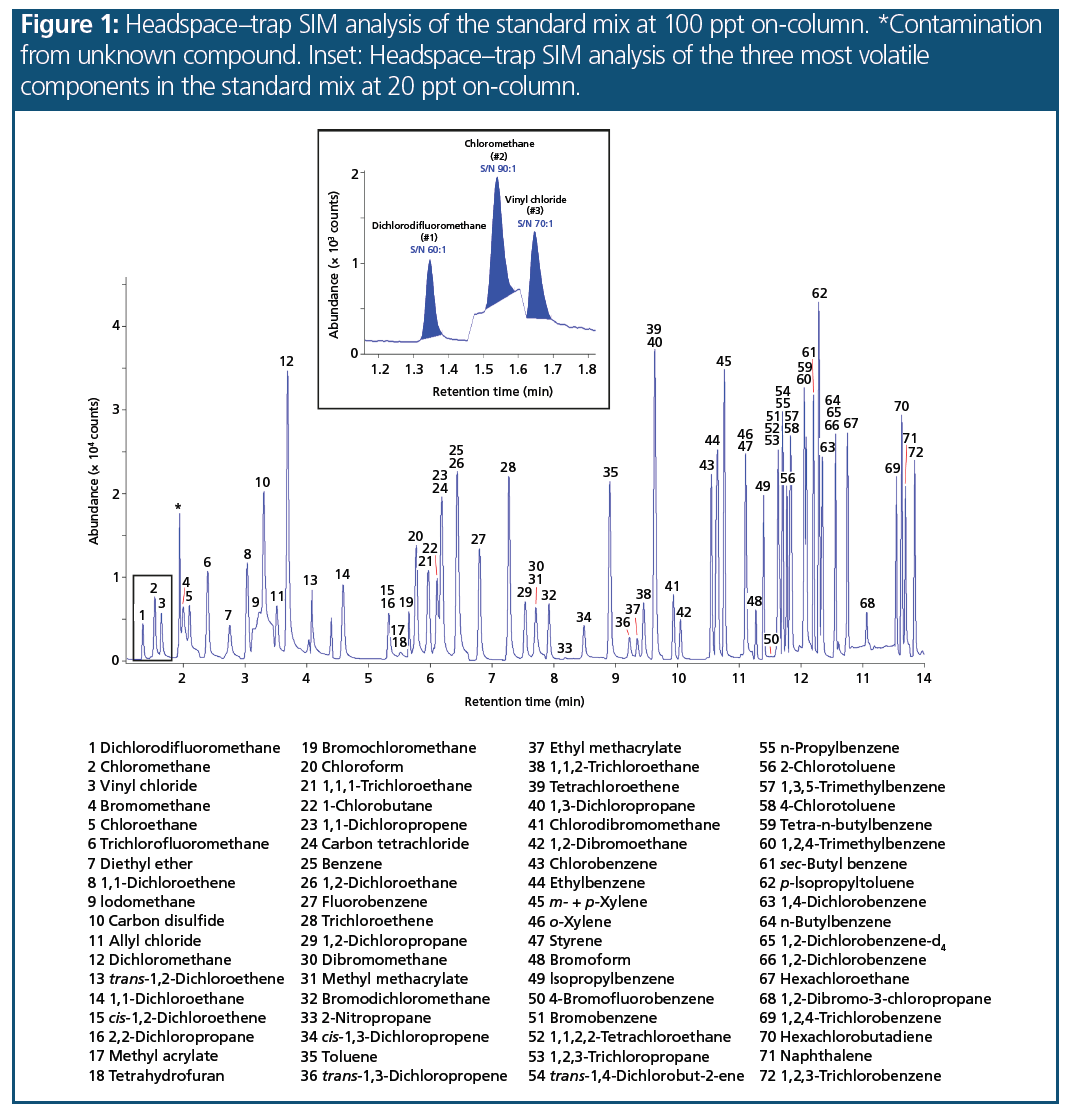
Chromatography: Figure 1 shows the overlaid SIM responses for all VOC compounds of the standard mix at 100 ppt on-column. For accurate quantitation of the early‑eluting gaseous compounds at these low concentrations, peak shape is important. The inset in Figure 1 shows the SIM responses for the first three peaks in the standard mix at 20 ppt on-column. These are difficult compounds to analyze at low-ppt concentrations, but in this study the peak shape was highly symmetrical.
Performance for Target Compounds:
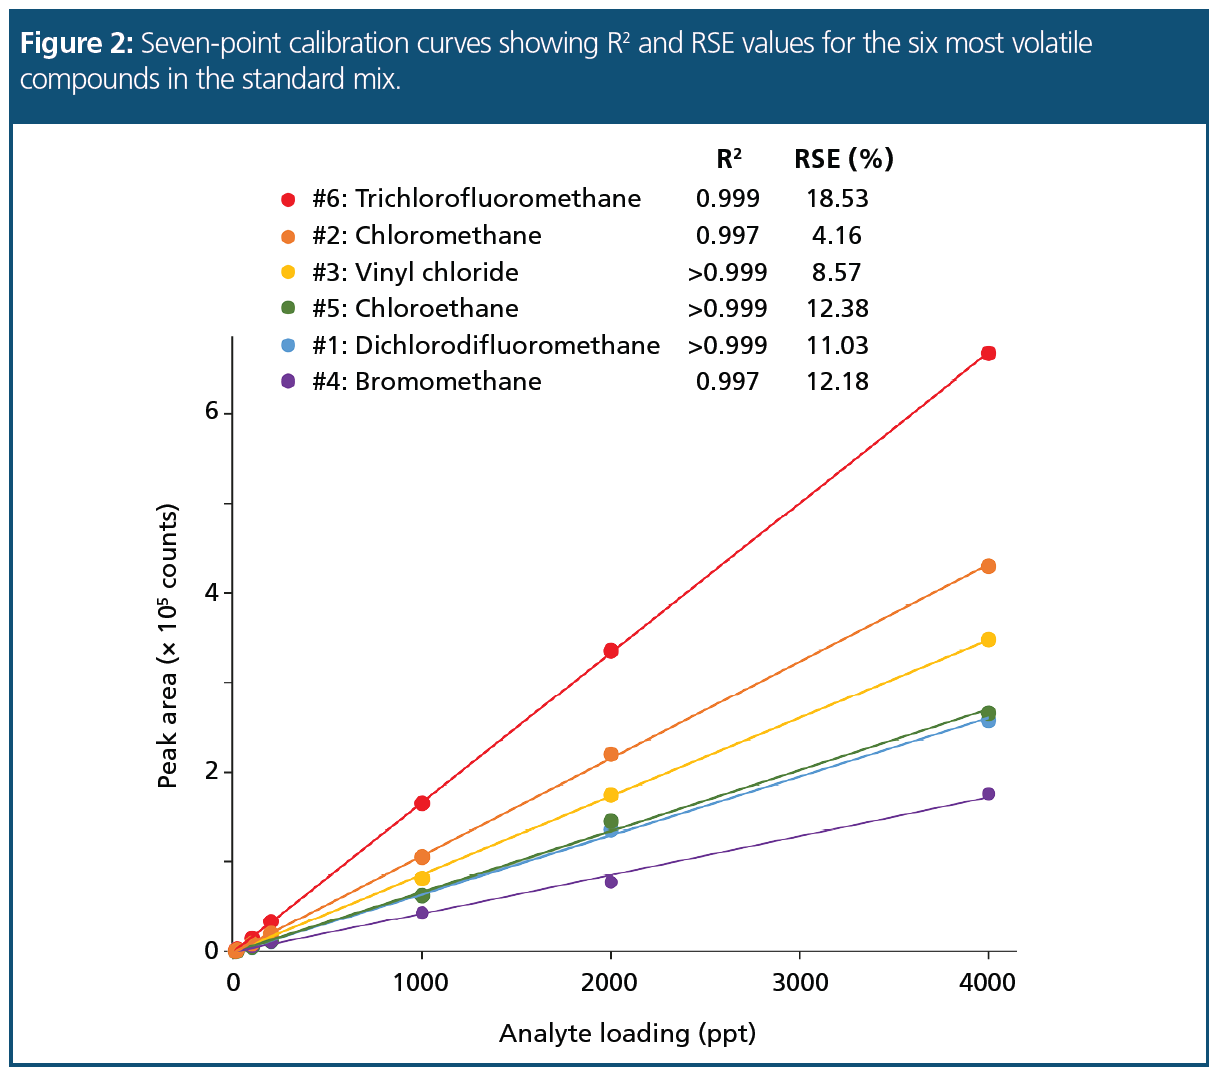
Linearity: Excellent linearity was obtained for all target compounds, with a mean R2 value for the seven-point calibrations from 10–4000 ppt being 0.999, and with the lowest value being 0.988 for 1,2-dichlorobenzene. The linearity was also calculated as the relative standard deviation (RSD) of the relative response factor for each analyte against the internal standard, using four replicate injections per level across the calibration range. The results indicate that very high confidence in quantitation is possible down to low-ppt levels.
The use of R2 as a measure of how well a set of data fits a calibration curve is well‑established. However, there is a growing desire within certain organizations and regulatory bodies to use a separate metric, the relative standard error (RSE) (1,2). The key difference is that whereas R2 tends to under‑represent deviations at low concentrations, RSE is equally sensitive to deviations across the concentration range. Acceptable values for RSE are method‑dependent or based on RSD values, but in general, values below 20% are indicative of a good fit.
Figure 2 shows the R2 and RSE values for the six most volatile compounds in the standard mix (all of which are gases under ambient conditions). RSE values range from 4.2% (chloromethane, #2) to 18.5% (trichlorofluoromethane, #6), confirming a good curve fit across the concentration range.
Recovery and Repeatability: Recoveries were calculated based on 10 replicate injections of the standard mix at 100 ppt on-column, using raw peak area values. The mean recovery was 98%, with a mean RSD of 4.6%, and with RSDs less than 10% for the most volatile compounds, indicating very high stability in overall system performance.
Detection Limits: Method detection limits (MDLs) were calculated using injections of the standard mix at 10 ppt on-column. The mean MDL was 1.9 ppt, with values ranging from 0.6 ppt (for bromochloromethane, #19) to 10.7 ppt (1,2-dichlorobenzene, #66).
Also determined were the practical quantitation limits (PQLs). The PQL is the minimum measurable concentration of an analyte for which there can be a high degree of confidence that the analyte is present at or above that concentration. The PQL is typically set at 6× to 10× the MDL, and in this study, we used 6× MDL. This gave a mean PQL of 11.4 ppt, with the most volatile compounds all having values <20 ppt.
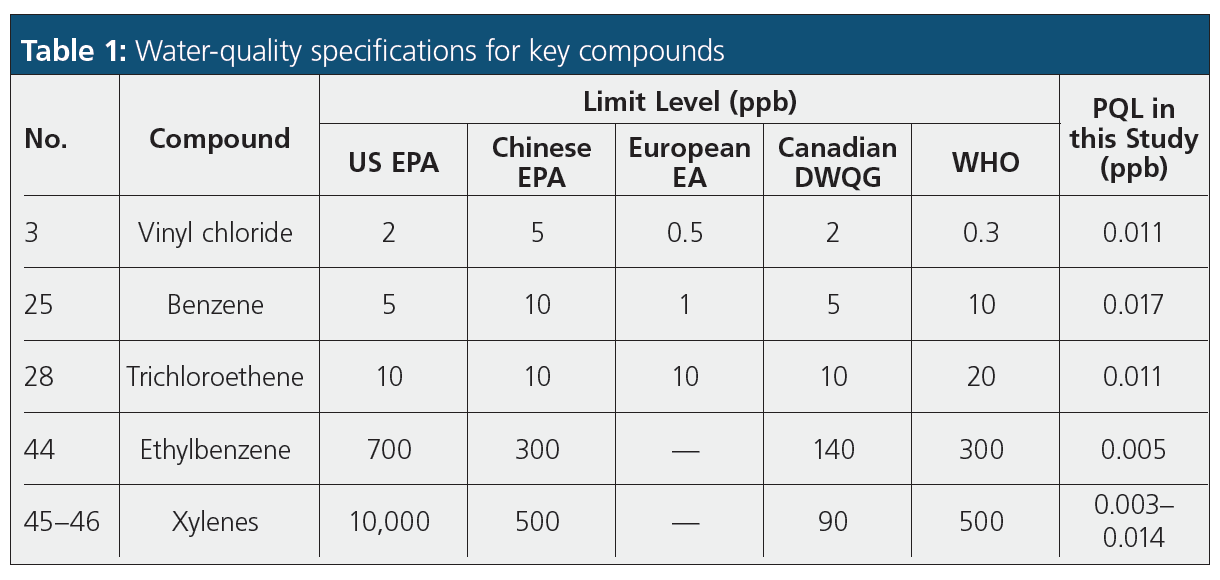
Table 1 compares the limit levels for several key VOCs specified by several agencies for water quality (including the relatively stringent EEA Directive 98/83/EC2) (3) with the PQL values obtained in this study. This shows that the current work provides detection levels significantly lower than required by all major regulations.
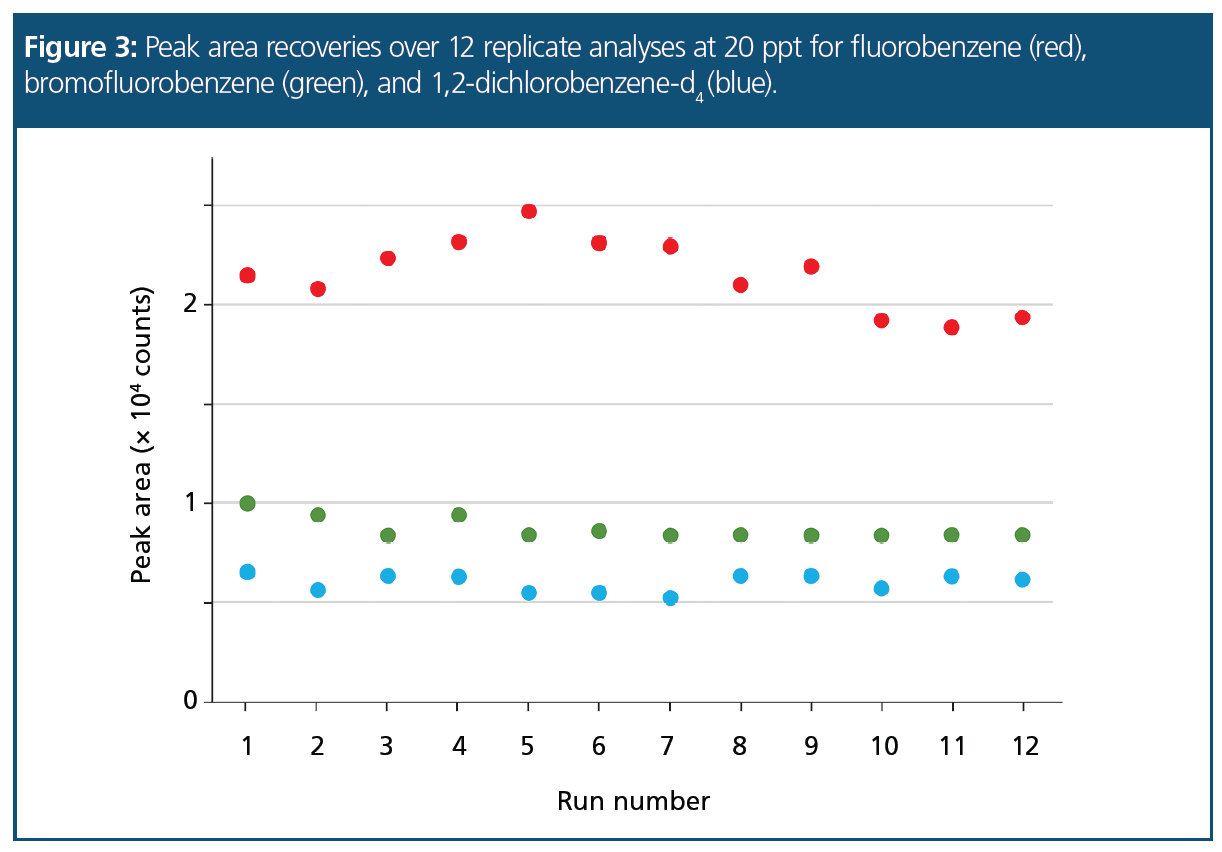
Performance for Internal Standard and Surrogate Standards: The stabilities, repeatabilities, and recoveries of the internal standard and the two surrogate standards were determined by running 12 replicate injections at 20 ppt on-column and plotting the raw peak area against run number. This provided a practical way of assessing the stability of the system, making it straightforward to identify when re‑calibration was required.
Mean recoveries (and RSDs) for fluorobenzene (#27), 4-bromofluorobenzene (#50), and 1,2-dichlorobenzene-d4 (#65) were 103.0% (RSD 7.0%), 100.4% (RSD 6.5%), and 99.7% (RSD 8.0%), respectively. Figure 3 shows the results graphically and indicates high levels of recovery and stability at this low concentration (20 ppt).
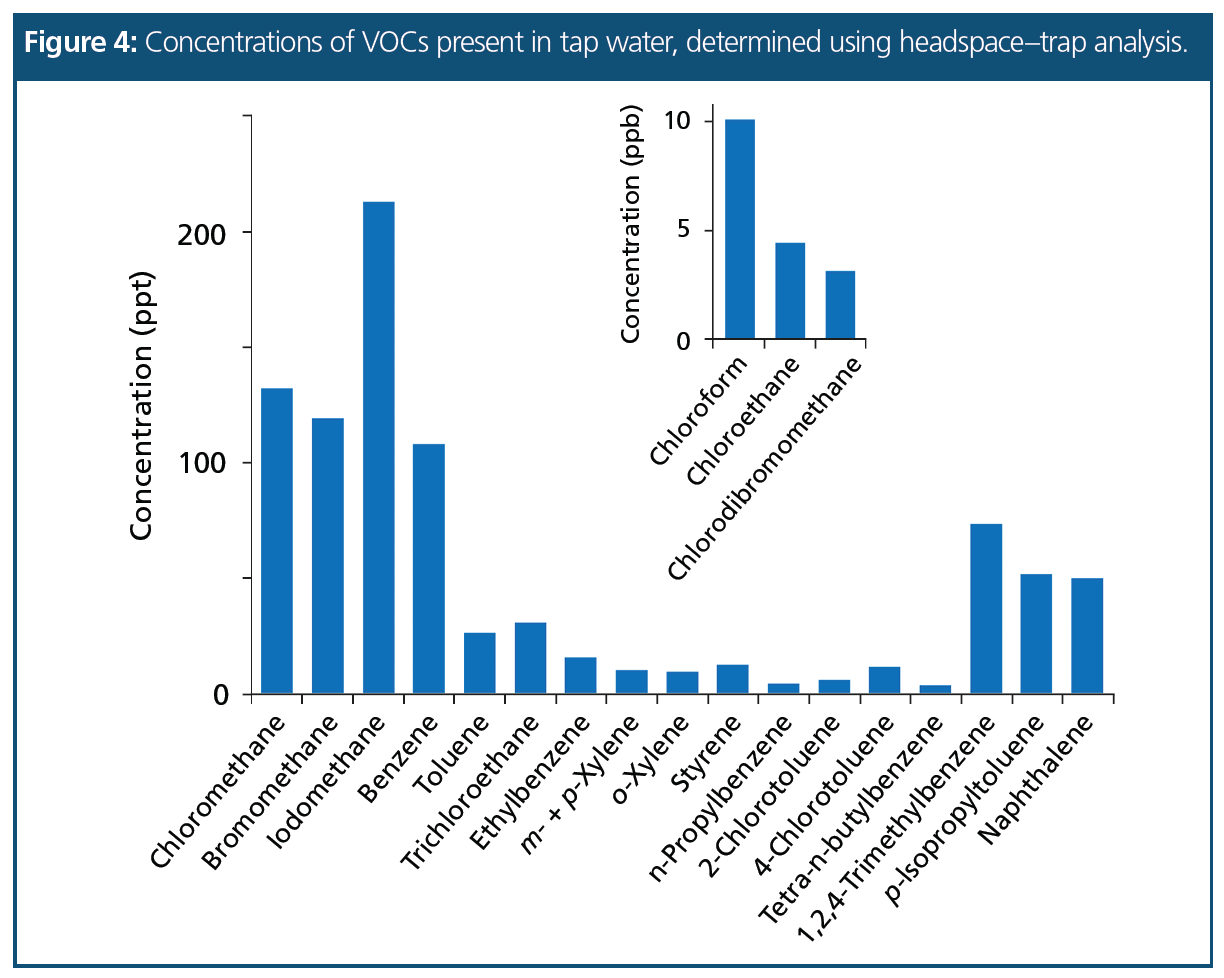
Real Water Sample: A tap water sample, spiked with the internal standard mix at 2 ppb on-column, was analyzed for residual VOCs and the concentrations are shown in Figure 4. In addition to three chlorinated VOCs present at low ppb levels, a number of ppt-level VOCs were found, of which benzene, ethylbenzene, and the xylenes are regulated and were present well below stipulated levels.
Conclusions
This study has shown that static headspace sampling combined with preconcentration on a multi-mode platform, in conjunction with GC–MS in SIM mode, allows the detection of low-ppt VOCs in water. Limits of detection were significantly below limit levels specified in a variety of regulations, and the system stability, precision, and accuracy were all excellent, which allowed quantitative analysis across a broad concentration range.
The use of a backflushed, cryogen-free focusing trap packed with multiple sorbent beds provided good retention and release of analytes, ranging from the very volatile gases through to the higher-boiling compounds. The availability of a trap also allowed re-collection of split samples for repeat analysis, with key benefits in this case being streamlined method validation and detection using different methods.
To further enhance sensitivity, the platform could be operated in splitless injection mode, and set to allow multiple samples from the same vial to be preconcentrated onto the same focusing trap, prior to desorption.
References
- Calculating RSE, NELAC Institute, 2017: http://nelac-institute.org/docs/comm/emmec/Calculating RSE.pdf
- Basic RSE calculator, NELAC Institute, 2017: http://nelac-institute.org/docs/comm/emmec/Basic RSE calculatorv4.xlsx
- Council Directive 98/83/EC of 3 November 1998 on the quality of water intended for human consumption, European Commission, 1998: https://eur-lex.europa.eu/legal-content/EN/TXT/?uri=CELEX%3A31998L0083
Rachael Szafnauer received an M.Sci. in forensic science from the University of South Wales, UK, where her final‑year project focused on fingerprinting emerging psychoactive substances using advanced techniques such as GC×GC–TOF-MS, in collaboration with Markes International. She later took up the role of thermal desorption product specialist at Markes, providing technical and application support to the commercial team, before taking on her current role, specializing in the development of applications using extraction and enrichment techniques.
Elinor Hughes obtained her B.Sc. in chemistry and Ph.D. in organic chemistry at Bangor University, UK. After working for a chemical manufacturing company for three years, she moved to the Royal Society of Chemistry where she worked in journals publishing for six years and on Chemistry World magazine for four years. This was followed by five years as a freelance copyeditor and science writer. Her current role is technical copywriter at Markes International.
E-mail: enquiries@markes.com
Website: www.markes.com

University of Rouen-Normandy Scientists Explore Eco-Friendly Sampling Approach for GC-HRMS
April 17th 2025Root exudates—substances secreted by living plant roots—are challenging to sample, as they are typically extracted using artificial devices and can vary widely in both quantity and composition across plant species.
Sorbonne Researchers Develop Miniaturized GC Detector for VOC Analysis
April 16th 2025A team of scientists from the Paris university developed and optimized MAVERIC, a miniaturized and autonomous gas chromatography (GC) system coupled to a nano-gravimetric detector (NGD) based on a NEMS (nano-electromechanical-system) resonator.
Miniaturized GC–MS Method for BVOC Analysis of Spanish Trees
April 16th 2025University of Valladolid scientists used a miniaturized method for analyzing biogenic volatile organic compounds (BVOCs) emitted by tree species, using headspace solid-phase microextraction coupled with gas chromatography and quadrupole time-of-flight mass spectrometry (HS-SPME-GC–QTOF-MS) has been developed.


