Pickering Labs - Analysis of Mycotoxins in Hemp and Hemp-Containing Edible Products
LCGC North America
Pickering Laboratories developed an easy and sensitive method to analyze aflatoxins B1, B2, G1, G2, and ochratoxin A in hemp and hemp-containing edible products. Mycotoxins are isolated using immunoaffinity clean-up columns and analyzed with fluorescence detection. To increase sensitivity of aflatoxins B1 and G1, an in-line photochemical reactor (UVE™) is installed before the detector. This method utilizes standard HPLC equipment and allows laboratories to easily determine these mycotoxins at low ppb levels.


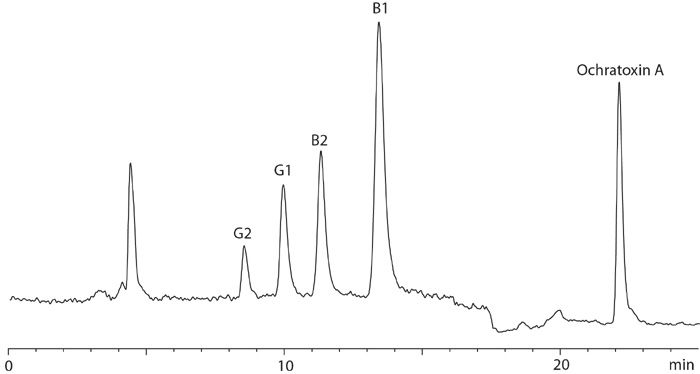
Figure 1: Chromatogram of hemp pre-roll spiked with 6.5 ng/g of aflatoxin B1; 1.8 ng/g of aflatoxin B2; 6.1 ng/g of aflatoxin G1; 1.9 ng/g of aflatoxins G2; and 20.1 ng/g of ochratoxin A.
Method
Isolation of aflatoxins B1, B2, G1, G2, and ochratoxin A
Blend 1 g of finely ground sample with extraction solution (10 mL of methanol/water 80:20) using a handheld homogenizer. Centrifuge for 10 min. Mix 2 mL of the extract with 10 mL of PBS buffer (containing 2% Tween 20). Clean the extracts using AflaOchra HPLC immunoaffinity column (Vicam).

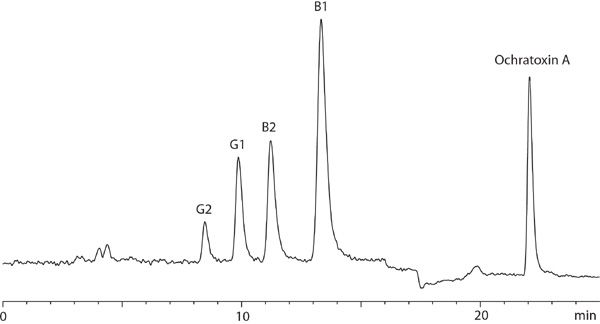
Figure 2: Chromatogram of hemp-containing chocolate spiked with 6.5 ng/g of aflatoxin B1; 1.8 ng/g of aflatoxin B2; 6.1 ng/g of aflatoxin G1; 1.9 ng/g of aflatoxins G2; and 20.1 ng/g of ochratoxin A.
Analytical Conditions
Analytical Column: Mycotox™ (Pickering), C18, 4.6 × 250 mm
HPLC eluent: sodium phosphate buffer (Cat #1700–1108), methanol, acetonitrile
Flow rate: 1 mL/min
Post-column photochemical reactor: UVE (Cat # 10519 (240V), Cat # 10742 (120 V) FLD: Excitation 36 nm, Emission 430 nm for Aflatoxins Excitation 333 nm, Emission 477 nm for Ochratoxin A


Calibration
The 5-point calibration curves were built in the ranges of 0.325–3.25 ppb for B1, 0.088–0.882 ppb for B2, 0.310–3.099 ppb for G1, 0.099–0.996 ppb for G2, and 1–10 ppb for ochratoxin A. Correlation coefficient was R2 >0.999 for all toxins.


Pickering Laboratories
1280 Speca Park Way, Mountain View, CA 04043
tel. (800) 654-3330, (650) 694-6700
Website: www.pickeringlabs.com


Automated Sample Preparation (ISO 20122) for MOSH/MOAH in Seasoning Oils
May 6th 2025This work presents an Automated Sample Preparation procedure for MOSH/MOAH analysis of Seasoning Oils. We compare results from a manual epoxidation procedure compliant with DIN 16995 with results based on fully automated sample preparation (epoxidation and saponification) compliant with ISO 20122. In both cases, online clean-up via activated aluminum oxide (AlOx) are used to remove interfering n-alkanes from the MOSH fraction during the HPLC run. Automated data evaluation using a dedicated software (GERSTEL ChroMOH) is presented.
Free Poster: NDSRI Risk Assessment and Trace-Level Analysis of N-Nitrosamines
April 25th 2025With increasing concern over genotoxic nitrosamine contaminants, regulatory bodies like the FDA and EMA have introduced strict guidelines following several high-profile drug recalls. This poster showcases a case study where LGC and Waters developed a UPLC/MS/MS method for quantifying trace levels of N-nitroso-sertraline in sertraline using Waters mass spectrometry and LGC reference standards.

