Analysis of Monoclonal Antibodies and Their Fragments by SEC Coupled with HRAM-MS
The Column
The biopharmaceutical industry continues to focus on the development of biotherapeutic monoclonal antibody (mAbs) drugs. In this article, the compatibility of SEC coupled with HRAM–MS for the analysis of mAbs is demonstrated.
Coupling size-exclusion chromatography with high-resolution accurate-mass mass spectrometry (SEC–HRAM–MS) enables accurate mass measurement of mAb and its fragments. When using a non-denaturing volatile eluent, such as 20 mM ammonium formate, the intact mass of mAb can be measured in its native state. When using denaturing volatile eluents, such as 20% acetonitrile, 0.1% formic acid, and 0.05% trifluoroacetic acid, mAb heavy chain (HC), light chain (LC), Fab, and Fc fragments are successfully separated and their masses are determined accurately. This article explains more.
The biopharmaceutical industry continues to focus on the development of biotherapeutic monoclonal antibody (mAbs) drugs.1 For the final biopharmaceutical product approval and subsequent manufacturing processes, a comprehensive characterization of mAb purity, aggregate forms, and charge variants is required by regulatory agencies. mAbs produced from mammalian cell cultures may contain significant amounts of dimers and higher-order aggregates.
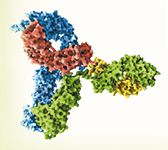
(PHOTO CREDIT: PASIEKA/GETTY IMAGES)
Studies show that these aggregates, when present in drug products, may cause severe immunogenic and anaphylactic reactions. Size-exclusion chromatography (SEC) is a well-known technique for the detection and accurate quantification of protein aggregates in biological drug products. It is routinely used for the characterization and quality control of mAb products.
There is a growing trend to obtain intact mass information using high-resolution accurate-mass mass spectrometry (HRAM–MS), as well as the glycan profile in the quality control (QC) of monoclonal antibodies. The most commonly used liquid chromatography–mass spectrometry (LC–MS) method is to desalt mAbs using reversed-phase chromatography followed by MS analysis. However, the extremely low pH and organic solvent used in reversed-phase chromatography often denatures the mAb. In the case of an antibody-drug conjugate (ADC) with interchain cysteine-linked drugs, the harsh solvent condition will dissociate the heavy and light chains of the ADC and prevent the measurement of intact mass.
A non-denaturing SEC-based desalting MS method enables mass measurement of mAbs in their native state. The volatile ammonium formate buffer is compatible with MS and preserves intact protein structure.2
Full characterization of mAbs includes determination of the mass of the mAb fragments, such as heavy chains and light chains generated by reduction of interchain disulphide bonds, as well as Fab and Fc generated by papain digestion (see Figure 1).
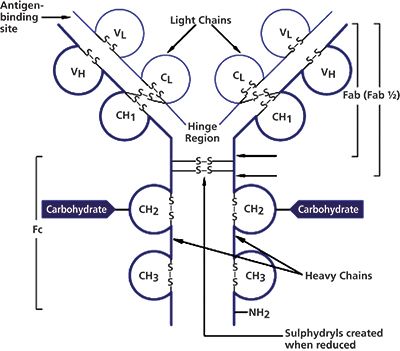
Figure 1: lgG structure.
In this study, we demonstrate the use of SEC–HRAM–MS for the analysis of mAbs. SEC–MS enables intact mass detection of mAb under non-denaturing conditions and fragments (including heavy chain, light chain, Fab, and Fc) under denaturing conditions.
Methods
Chemicals and Reagents: High purity ammonium formate (≥99.995%) and ammonium acetate (≥99.99%) were purchased from Sigma. Other reagents were purchased from reputable suppliers. Monoclonal antibodies were gifts from a local biotech company.
Instrumentation: An 4 × 300 mm, 5-µm MAbPac SEC-1 column (Thermo Scientific) was used, along with an UltiMate 3000 RSLCnano System (Thermo Scientific Dionex) equipped with an SRD-3400 Membrane Degasser; a UltiMate NCS-3500RS dual-gradient pump and column compartment (Thermo Scientific Dionex); and a UltiMate WPS-3000TPL rapid separation thermostatted autosampler (Thermo Scientific Dionex).
Reduction of mAb to Heavy Chain (HC) and Light Chain (LC) Subunits: Reduction of inter-chain disulphides in a mAb 1 mg/mL) was achieved by incubation with 20 mM DTT at 50 °C for 30 min. The reduced sample was acidified with formic acid to a final concentration of 0.1%.
Papain Digestion of mAb to Generate Fab and Fc Subunits: The digestion was performed by incubating the mAb (1 mg/mL) with papain (0.04 mg/mL) in 100 mM Tris-HCl, pH 7.6, 4 mM EDTA and 5 mM cysteine buffer at 37 °C. After 4 h, the digestion was stopped by the addition of formic acid to make up the final concentration of 0.1%.
Non-Denaturing SEC Mobile Phase: 20 mM ammonium formate (pH 6.3) or 20 mM ammonium acetate (pH 6.8) was used. A denaturing SEC mobile phase was made up of 20% acetonitrile, 0.1% formic acid, and 0.05% trifluoroacetic acid (TFA).
MS Conditions: Intact mAb or mAb fragments were analyzed by ESI–MS for intact molecular mass using the Exactive Plus EMR Orbitrap mass spectrometer (Thermo Scientific).
Non-denaturing LC–MS Analysis: EMR mode was turned on; full scan with mass range from 400–20,000 m/z was used for data acquisition. HCD was set at 10 to help desolvation, microscans was 5 with AGC target set at 1E6, maximum IT: 300 ms at resolution 35,000, probe was heated to 400 °C.
Denaturing LC–MS Analysis: MS was operated in non-EMR mode; spray voltage: 4.3 kV; sheath gas flow rate: 30; auxiliary gas flow rate: 10; capillary temperature: 275 °C; S-lens level: 200; in-source CID: 100 eV; resolution: 17500; AGC target: 1E6; maximum IT: 200 ms; heater temperature: 200 °C, microscans: 1; mass range: 400–6,000 m/z.
Data Processing: Full MS spectra of intact mAbs, HC, LC, Fab, and Fc fragments were analyzed using Protein Deconvolution 2.0 software (Thermo Scientific) for molecular mass determination. Mass spectra for deconvolution were produced by averaging spectra across the most abundant portion of the elution profile for the mAb or their fragments. The averaged spectra were subsequently deconvoluted using an input m/z range of 4000 to 6000 for spectra acquired under non-denaturing conditions (or 2000 to 4000 m/z for spectra acquired under denaturing conditions), an output mass range of 140,000 to 160,000 Da with a target mass of 150,000 Da for mAb, or an output mass range of 45,000 to 55,000 Da with a target mass of 50,000 Da for mAb fragments. A minimum of at least eight consecutive charge states from the input m/z spectrum was used to generate the deconvolution results.
Results
Analysis of mAb by Non-denaturing SEC–MS: The analysis of mAbs by SEC is typically performed under non-denaturing conditions at physiological pH range (6–8). The commonly used buffer is phosphate with 300 mM NaCl. However, the non-volatile nature of phosphate buffer and the half salt content makes this buffer non-compatible with on-line MS detection. Therefore, we explored the use of a volatile buffer such as 20 mM ammonium formate for SEC–MS separation. Figure 2 shows the SEC–MS analysis of a mAb, with Figure 2(a) showing the extracted ion chromatogram of m/z at 5483.08–5483.31 and Figure 2(b) the charge envelope of +24 to +29 in the m/z range of 5100–6200. Under acidic conditions, the charge envelope of mAbs is in the m/z range of 2000–4000. Since the 20 mM ammonium formate eluent had near neutral pH (at 6.3), the charge envelope of the mAb shifted to a higher mass range. Figure 2(c) shows the deconvoluted mass spectra of the mAb, with a main peak at m/z 148033 and adjacent peaks at m/z 148198 and 148359, corresponding to different glycoforms with 1 and 2 additional hexoses. An adjacent peak at m/z 148163 was 130 amu above the main peak, corresponding to a lysine variant.
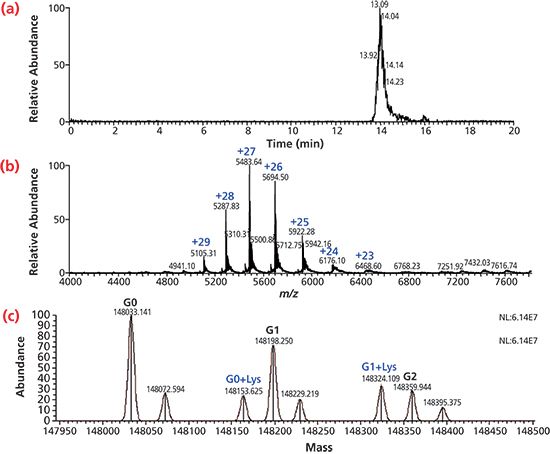
Figure 2: SEC–MS analysis of mAb under non-denaturing condition using 20 mM NH4Fc. (a) extracted ion chromatogram of mAb, (b) mass spectrum of mAb, and (c) deconvoluted spectrum of mAb.
Ammonium acetate buffer was also evaluated. However, when using 20 mM ammonium acetate (pH 6.8) as the eluent, the mAb peak had tailing.
The mAb average mass can be measured by SEC–MS under denaturing conditions as long as the mAb structure remains intact. Eluents such as 20% acetonitrile, 0.1% formic acid, and 0.05% TFA can be used for such an analysis. When comparing the charge distribution of the mAb under acidic and near neutral conditions, the mAb carried more charge in acidic conditions with the charge envelope in the range of +33 to +60 (data not shown).
Analysis of mAb Fragments by Denaturing SEC–MS: Comprehensive analysis of the mAb post-translational modifications, such as deamidation, C-terminal lysine truncation, N-terminal pyroglutamation, methionine oxidation, and glycosylation, requires complete digestion of the mAb and sequencing of all the peptides. However, "peptide mapping" is time-consuming. A simpler and faster way to analyze the mAb variants and locate the modifications is to measure the mass of heavy chain (HC) and light chain (LC), or Fab and Fc fragments. HCs and LCs are generated by the reduction of mAb. Fab and Fc fragments are generated by papain digestion. For example, the glycan modification is located in the Fc region of the HC. Glycan variants can be detected in the HC and Fc fragment mass profiles; while LC and Fab fragment mass profiles should only show a single polypeptide chain.
Figure 3 shows the SEC–MS analysis of HC and LC of a mAb using 20% acetonitrile, 0.1% formic acid, and 0.05% TFA. Figure 3(a) shows the extracted ion chromatogram of HCs with m/z at 3163.70–3164.89 and LCs with m/z at 2600.78–2601.88. mAb HCs elutes at about 10.15 min and mAb LCs elutes at approximately 12.71 min. Different mAbs were tested and their HCs and LCs had a similar retention time.
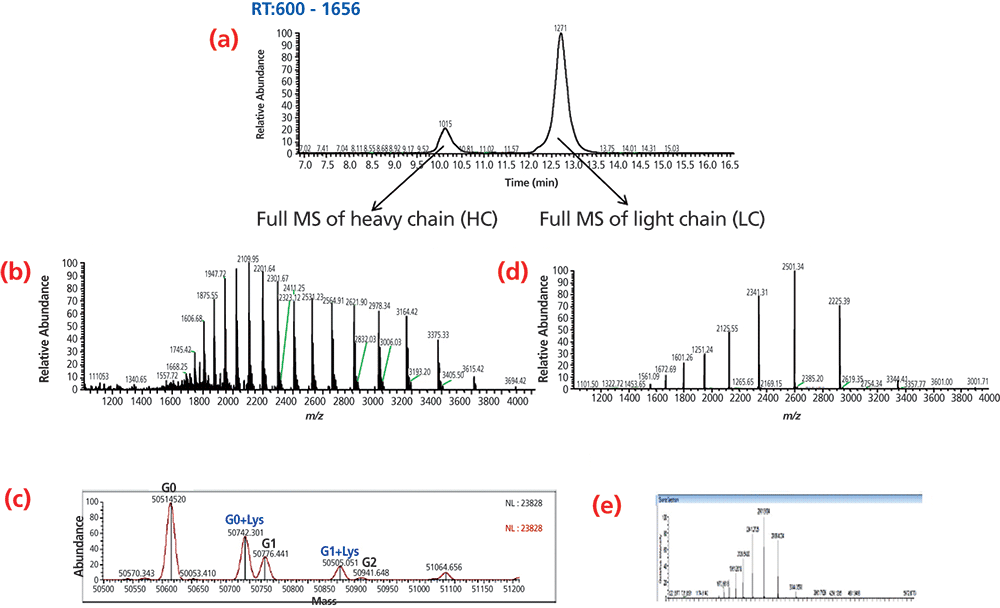
Figure 3: SEC–MS analysis of mAb heavy chain and light chain under denaturing condition using 20 acetonitrile, 0.1% formic acid and 0.05% trifluoroacetic acid. (a) extracted ion chromatogram of heavy chain (HC) and light chain (LC), (b) mass spectrum of heavy chain (HC), (c) deconvoluted spectrum of heavy chain (HC), (d) mass spectrum of light chain (LC), and (e) deconvoluted spectrum of light chain (LC).
Denaturing SEC can therefore be used as a platform method for the separation of HCs and LCs of mAbs. Figure 3(b) shows the charge envelope of mAb HCs in the m/z range of 1900–3600 and Figure 3(c) shows the deconvoluted mass spectra of the mAb HC, with a main peak at m/z 50614.5 and adjacent peaks at m/z 50742.3 and 50776.4, corresponding to a lysine variant and a different glycoform with 1 additional hexose. The lysine variant was located at the C-terminal of the HC. Figure 3(d) shows the charge envelope of the mAb LC in the m/z range of 1500–3500 and Figure 3(e) shows the deconvoluted mass spectra of the mAb LC, with a single peak at m/z 23403.7. The mAb LC was not glycosylated and did not have C-terminal lysine variants. The intact mass of mAb was determined at m/z 148029 using the equation 2×(HC+LC)-8. The calculated mass was in good agreement with the measured mass at m/z 148035.
Conclusions
- mAb intact mass was measured by SEC–MS under non-denaturing conditions using near neutral pH eluent.
- LC–MS enabled the accurate detection of mAbs.
- SEC successfully separated the HCs and LCs, and partially separated Fab and Fc fragments using denaturing eluents such as 20% acetonitrile, 0.1% formic acid, and 0.05% TFA.
References
1. S. Lin, S. Rao, J. Thayer, Y. Agroskin, and C. Pohl, "Automated Monoclonal Antibody 2-Dimensional Workflow: from Harvest Cell Culture to Variant Analysis," paper presented at The WCBP Conference, San Francisco, California, USA, 23–25 January 2012.
2. J.F. Valliere-Douglass, W.A. McFee, and O. Salas-Solano, Anal Chem.84(6), 2843–9 (2012).
Shanhua Lin is the Program Manager for Bio-separations of Chromatography Consumables R&D. Since joining Thermo Fisher Scientific in 2011, she has developed and launched a variety of consumable products. She is also responsible for the workflow and platform methods of monoclonal antibody analysis.
Hongxia Wang is the Senior Marketing Specialist, Pharma/Biopharmaceuticals at Thermo Fisher Scientific. She focuses on characterization and bioanalysis of protein therapeutics using HRMS.
Xiaodong Liu is Manager, Research & Development, Chromatography Consumables for Thermo Fisher Scientific. His team develops chromatography consumables including phase design, synthesis, manufacturing, column packing and application development. He is inventor or co-inventor of nine US patents and 12 pending applications. He has authored more than 20 peer-reviewed articles.
Zhiqi Hao was program manager, Biopharmaceutical Marketing, at Thermo Fisher Scientific when this article was written. She is currently a scientist at Genentech.
E-mail: shanhua.lin@thermofisher.com
Website: www.thermoscientific.com
This article is from The Column. The full issue can be found here>>

A Matrix-Matched Semiquantification Method for PFAS in AFFF-Contaminated Soil
Published: April 14th 2025 | Updated: April 14th 2025Catharina Capitain and Melanie Schüßler from the Faculty of Geosciences at the University of Tübingen, Tübingen, Germany describe a novel approach using matrix-matched semiquantification to investigate per- and polyfluoroalkyl substances (PFAS) in contaminated soil.
Silvia Radenkovic on Building Connections in the Scientific Community
April 11th 2025In the second part of our conversation with Silvia Radenkovic, she shares insights into her involvement in scientific organizations and offers advice for young scientists looking to engage more in scientific organizations.


