Accurate Determination of Methane in Cable Insulation Material by Gas Bag Sampling and Multiple Headspace Extraction Gas Chromatography
LCGC North America
A method was developed to address the constraints encountered when measuring methane levels during the degassing process.
In the wire and cable industry, accurate quantification of volatile compounds, such as methane in cable insulation material, is important because methane can increase safety risks. The degassing process to remove methane from wires and cables is critical, yet quite costly. In this study, a multiple headspace gas bag method that combines the techniques of gas bag sampling and multiple headspace extraction was developed to address the constraints encountered when measuring methane levels during the degassing process. In comparison to conventional methods, this method showed advantages on minimizing methane loss. It provided a practical solution to quantify highly volatile species in a solid matrix, which is critical to the cable industry, and has the potential of being adopted as an industry standard.
In the wire and cable industry, the preferred insulation material for cables rated from 1 kV up to 500 kV is cross-linked polyethylene (XLPE). After extrusion, the cable is heated in the curing zones to induce the cross-linking of polyethylene (PE) chains, which is accomplished by using peroxide additives. Dicumylperoxide (DCP) is the most frequently used cross-linking agent, and the three main by-products from DCP are methane, cumyl alcohol, and acetophenone (1,2). For all power cables, especially for high-voltage and extra-high-voltage cables, there is a need to remove these by-products or reduce their concentrations (3). The most important component to be removed is methane. Methane gas can represent a potential danger by generating excessive pressure inside the cable, causing fire or explosion during cable installation (4,5). Therefore, the XLPE insulation needs to undergo a subsequent degassing process after the cable is produced, through which most by-products are removed or at least are reduced to a safe and acceptable level from an operational point of view (6,7). A reliable method for quantification of residual methane in XLPE insulation is critical to monitor the progress of the degassing and assist in the study of process efficiency improvement.
Gas chromatography (GC) with headspace injection and flame ionization detection (FID) is a viable solution to quantify methane in a solid sample matrix. Several GC methods have been developed by end users, material suppliers, and cable manufacturers (3,7). However, in all these methods, XLPE insulation has to be cut into small pieces for headspace incubation. Because methane is highly volatile, it could be lost during the cutting process. In combination with the sample size factor, the resulting small sample pieces would not be representative of the whole cable. Therefore it is necessary to develop a new method for sample preparation to improve the overall quantification accuracy. Because of the volatile property of methane and the multilayer jacket structure of the cable, there is a conflict situation for headspace injection sample preparation. Cutting cables into small pieces to accommodate conventional headspace vials (~20 mL) will cause methane loss, but it will make calibration easier because the smaller the specimen is cut the easier it is to achieve total release of methane from the cable and to use single-time headspace extraction for absolute quantification. Keeping the cable sample as a long strand will minimize the methane loss, but because methane releases from the strand slowly and total release is difficult to reach, matrix effects must be considered for accurate headspace quantification. A common practice to eliminate the matrix effect is to use the standard addition method or external standard calibration with standards prepared in the same sample matrix. However, for solid samples like cables, it is impossible to make standard blank cables without any methane but with exactly the same formulations and the same crosslinking levels as the analyte cable. In addition, it is hard to embed a known amount of methane into the cable to allow simulation of methane release from the polyethylene matrix. Therefore, if the cables are to be sampled as a strand for minimum methane loss, two things are required: a suitable large container for cable headspace incubation and the proper calibration method for matrix effect elimination.
Air sampling bags, which have been widely used as convenient portable systems for the collection of gas samples (8–12), can be used as the cable container in this application. The gas bags have many advantages: they are gas tight, they are easy to use, they are free of absorption of analytes on the inner wall, and they provide very low permeability of the analytes. They are very suitable for collection of ultravolatile components, which are difficult to retain at ambient temperature using sorbent tubes. Polytetrafluoroethylene (PTFE), polyethylene-terephtalate-nylon-aluminum (PET-NY-AL), and polyvinyl fluoride (PVF) are the most widely used materials for making bags, the last of which is registered under the brand name of Tedlar (13,14). Tedlar gas bags have been studied widely by universities as well as government agencies such as the United States Environmental Protection Agency (EPA), and they have been adopted in many standard methods (15–17). Another merit of the Tedlar gas bag is that its size can be customized according to the sampling needs, which makes it possible to enclose larger cable samples.
Multiple headspace extraction (MHE) is a technique that was introduced in the 1980s for the accurate quantification of analytes of interest, independent of the matrices involved (18–20). The MHE theory assumes that by exhaustive extraction, all analytes can be released from the sample matrix to result in complete recovery and eliminate the sample matrix effect. As the concentration of analytes in the headspace during the series of extraction steps decreases exponentially, the total concentration of analytes can be theoretically calculated with the concentration value of first extraction after proper mathematical extrapolation (20). As indicated by equation 1, if A1 and An are the peak area of methane at the first extraction and n times of extraction respectively, a linear fit will be observed between the extraction times (n) and the logarithm of An. By using the slope of the fit (K), the total peak area for infinite extractions can be estimated with equation 2, and with the response factor of the analyte, the total peak area can be converted to the total amount of the analyte.


The MHE technique is particularly useful for quantitative analyses where the sample matrix is hard to reproduce, such as the determination of volatiles in vegetable oil (21), plastic packaging (22), and soil (23). More recently, combinations of MHE with some sample preparation techniques, for example, solid-phase microextraction (SPME) and single-drop microextraction (SDME), were also developed for quantitative determination of volatiles in polymer matrixes, which broadens the application of MHE (24–26).
In this study, a multiple headspace gas bag (MHGB) method that combines the techniques of gas bag sampling and MHE was developed to couple with GC–FID to address the challenges of methane quantification in high-voltage cable samples. By using 10-L gas bags, cables can be sampled as 30-cm-long strands without being cut into small pieces and methane loss can be minimized. The principle of MHE was adopted for the elimination of matrix effect, and the absolute quantification obtained allowed the comparison of methane levels in different cables regardless of the methane decay kinetics difference. This method provides a practical quantification solution to the cable industry and has shown its potential to be developed as an industry standard method.
Experimental
Instrumentation and Reagents
An Agilent 6890N GC system (Agilent Technologies) equipped with a split-splitless inlet and a flame ionization detector was used throughout. Tedlar polyvinyl fluoride (PVF) gas bags of different sizes were provided by Delin. A gas sampling pump obtained from Keyuan and a Defender 510 flow meter obtained from Drycal were used to control the gas volume during the gas bag filling and deflating process. Manual injections into the GC system and the methane standards preparation were accomplished using 100-µL and 5-mL gas-tight syringes (1700 type) obtained from Hamilton. In a comparison study, automatic headspace injections were made using an Agilent G1888 headspace autosampler. Standard methane gas (≥99.5%) and nitrogen gas (>99.99) were obtained from Air Products.
Chromatographic Conditions
The separation of methane was achieved with the use of a 30 m x 0.25 mm, 0.25-µm df HP-5MS capillary column (5% phenyl methyl siloxane, J&W Scientific), which has a maximum operating temperature of 350 °C. Nitrogen was used as the carrier gas and the column flow rate was set as 2 mL/min (constant flow). The inlet was equipped with a split liner (Agilent Technologies) and was operated at 250 °C in split mode at a split ratio of 20:1 with an initial column head pressure of 20.9 psi, and the gas saver mode was always off. The GC system was programmed from 60 °C (13 min) to 300 °C at 30 °C/min. The detector temperature was 250 °C with the hydrogen flow rate at 40 mL/min, the air flow rate at 450 mL/min, and the nitrogen flow rate at 30 mL/min. For comparison tests with the headspace autosampler, 20-mL injection vials were used with a vial equilibrium time of 30 min at 150 °C. The temperatures of the sample loop and transfer line were set at 170 °C and 180 °C, respectively. The headspace vial pressurization time was 0.5 min with a vial pressure of 15 psig. A 0.2-min loop fill time and 0.1-min loop equilibration time were used, and the injection time was 0.5 min.
Calibration Standard Preparation
Before the standard methane was collected from the gas cylinder, a 1-L gas bag was purged with nitrogen three times and then deflated thoroughly with an automatic gas pump. One end of a rubber tube was connected to the outlet of a methane gas cylinder while the other end of the tube was put in the fume hood. Then the cylinder valve was opened and the tube was purged with methane for about 15 s. After that, the end of rubber tube was connected to the inlet of the 1-L gas bag with the cylinder valve open. The inlet valve of the gas bag was opened to inflate the 1-L gas bag with pure methane. To prepare the gaseous calibration standards with different methane concentrations, clean and deflated 3-L gas bags were used. Pure nitrogen gas was pumped into each 3-L gas bag for 60 s, with a flow rate af approximately 400 mL/min. Then 1, 2, 4, 8, and 20 mL of pure methane gas were accurately drawn with syringe from the 1-L gas bag separately, and injected into the 3-L gas bags to obtain the methane calibration standards with concentrations of 0.25% (v/v), 0.50% (v/v), 1.0% (v/v), 2.0% (v/v), and 5.0% (v/v).
Multiple Headspace Gas Bag Extractions
Cables produced from a pilot line in a manufacturing plant were used in this study for method development. Typical cables were composed of four layers: round copper conductor as the core layer, a conduct screen layer, an insulation layer, and finally an insulation screen layer, in that order. Both the conduct screen layer and the insulation screen layer were cross-linked polyolefin with carbon black, and the insulation layer was cross-linked low-density polyethylene (LDPE), which generated methane gas. A 30-cm-long cable strand was cut from the long round cable (outer diameter, ~7 cm) without removing the conduct and screen layers and the strand was sealed immediately in a 10-L gas bag. Next, the air in the gas bag was drawn out to minimize the release of methane and the gas bag was transported to the analytical laboratory. The following procedure was used for methane analysis in analytical laboratory:
1. An empty 10-L gas bag was purged with nitrogen two or three times and then filled with nitrogen gas. This gas bag was used as a nitrogen tank to supply nitrogen to gas bags with cable samples.
2. After the cable sample that was sealed in a gas bag was received, a measured volume of nitrogen was filled into the cable-containing gas bag, and an aliquot of 100 µL of gas was drawn from the gas bag and manually injected for GC–FID analysis (as shown in Figure 1a). The methane measured in this step was recorded as the Day 0 result, representing methane released during the storage and transportation. Then the gas bag was deflated completely with the help of gas pump, and the time and flow rate were recorded to calculate the gas volume, as shown in Figure 1b.
Figure 1: Scheme of (a) nitrogen filling a cable-containing gas bag and (b) gas bag deflating for multiple headspace extraction.

3. The same gas bag was again filled with nitrogen gas, and the gas bag was conditioned in the oven at 70 °C for a whole day (accurate heating time used in the study was 22 h). After the gas bag (with cable sample in) was taken out of the oven and letting it cool to room temperature, methane released during the 70 °C conditioning was measured by GC–FID with manual injection (Day 1 result). Then the gas bag was completely deflated by use of the pump, with pumping time and flow rate recorded.
4. Step 3 was repeated three times later to get the results of Day 2, Day 3, and Day 4.
5. The Day 1 to Day 4 results were then used to build the MHE model and calculate the total methane in the cable sample.
Results
The goal of the present work is to develop a method to quantify the residual methane in the cable to accurately monitor the degassing process. In this article, methane amounts are expressed as methane volumes. Because the methane concentration obtained from this study will not be necessarily representative for the residual methane level from a commercial cable, and to avoid misleading, specific methane concentrations are not given and instead methane volumes are used for the illustration of method development. With the weight of XLPE insulation, molar mass, and molar volume of methane, the methane concentration in the cable can be calculated as needed.
As described above, a strand of cable sample was sealed in the gas bag and sequential headspace extractions were conducted. Methane concentrations measured from each headspace injection were first converted to methane volume (in units of mL) with equation 3 and then the methane volumes at sequential extractions were used for MHE calculation.

In equation 3, F is the average flow rate of gas released from the gas bag (in mL/min) recorded by the flow meter, t is the time (in min) of pumping for deflating the gas bag, and Cmethane is the volume concentration (v/v) of methane calculated from the calibration curve. The calibration curve can be obtained with standard methane ranging from 0.25% (v/v) to 5.0% (v/v) (regression equation: y = 588.69x - 4.7725, where y is the peak area of methane, and x is the methane concentration, n = 5, R2 = 0.9999).
Typical MHE chromatograms for methane are shown in Figure 2a. The retention time of each injection was slightly shifted because of the deviation caused by manual injection, and the stacked chromatograms were plotted with adjusted retention times. Because the interval between each extraction was set as 24 h, data points Day 1 to Day 4 represent extraction 1 to extraction 4 and the Day 0 data represent the methane released before the first extraction, which was not included in the MHE calculation. Therefore the total volume of methane in the cable can be expressed in equation 4, where V0 and V1 are methane volumes before the first extraction and at the first extraction, respectively.
Figure 2: MHE calibrations, (a) stacked chromatograms for methane from consecutive extractions and (b) MHE regression plot.
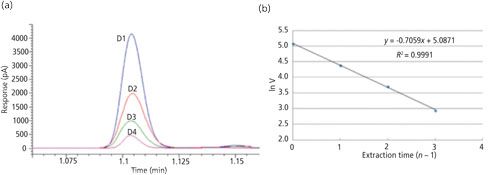

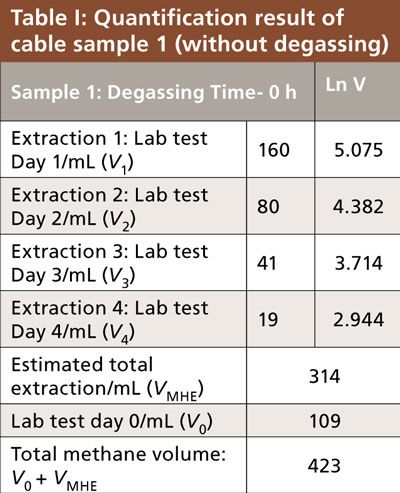
Table I shows the results obtained for a cable with an XLPE insulation layer sealed in the gas bag just after production in the plant (without degassing). The released methane volumes from Day 0 to Day 4 were calculated and listed in the table. Then an MHE calibration curve was plotted with the sequential number of the extraction and the corresponding natural logarithm of methane volumes from Day 1 to Day 4, as shown in Figure 2b. The slope (K) of the linear fit was obtained as -0.7059 and the subtotal methane calculated from MHE model was 314 mL. With the Day 0 result added, the total methane in the cable sample was determined to be 423 mL.
Discussion
Considerations for Method Parameters
Since methane can be easily analyzed with GC–FID, the challenge of this quantification is actually the calibration method that directly relates to the sample preparation and introduction method. Usually the release profile of methane is dependent on multiple factors, such as resin formulations (species and loadings of additives), cable size (diameter), XLPE layer thickness, and degassing techniques. The methane concentration obtained by single headspace injection would not adequately reflect the total methane level in the cable. Therefore, to meet the methane level comparison needs for a variety of cables, the absolute quantification, instead of relative quantification, is needed. The multiple headspace extraction method is a practical solution to eliminate the matrix effect for the absolute quantification.
In practice, headspace equilibrium temperature, equilibrium time, and extraction or headspace injection intervals are the key parameters for multiple headspace extraction. Because the gas bag cannot tolerate high temperatures, 70 °C was chosen as the headspace equilibrium temperature, which is quite similar to the degassing temperature used in the plant. According to our experience, total release of methane from the cables usually requires 3 to 14 days (based on the requirements of methane residue and the size of the cable products); therefore a relatively longer equilibrium time (~20 h) compared with a conventional headspace method (several tens of minutes) was used in this study. Because the gas bag needs around 2 h to cool from 70 °C to room temperature, an interval of 24 h between each extraction was selected to make the injection easily scheduled. Thus, 22 h for equilibrium at 70 °C plus 2 h for cooling was used for each extraction of MHE.
In this study, a 5% phenyl methyl siloxane capillary column was used for the separation of methane from the total injected gases. Under the given conditions, methane and other light C1–C3 species are not retained and there exists the risk of coelution. There are several reasons that the capillary column instead of a porous layer open tubular (PLOT) column was selected. First, the capillary column is widely available in industrial laboratories and can meet a variety of general-purpose separation needs. It shows advantages of flexibility, particularly with the shared GC systems. Second, the possibility is low for the presence of C1–C3 interferences. In the high-voltage cable industry, it is widely known that methane is the major component among the C1–C3 species. Methane comes from the reaction between the initiator dicumylperoxide and the polyethylene (3). According to the crosslinking mechanism, the decomposition of peroxide DCP will generate methyl radicals and the radicals will react with hydrogens in the polyethylene chain to form methane. Methane is dominant because of the reaction kinetics and the detection of other species, such as C1–C3 aldehyde, alkene, and ketones, are not reported. The formation of ethane is possible by the reaction of two methyl radicals, but the ethane amount should be very low because the methyl radical will prefer to react with the abundant hydrogens present in the polyethylene chain rather than reacting with the low concentration methyl radicals. Therefore, it should not be a big concern for interferences from other C1–C3 species. Third, besides methane, there are other by-products present in the sample (such as acetophenone and cumyl alcohol) with boiling points above 200 °C. If initiators other than DCP are used for the polyethylene crosslinking, some other volatile or semivolatile components will be generated and the 5% phenyl methyl siloxane capillary column will be a good choice as a starting point for column selection. Therefore, it should be noted that the chromatography conditions listed in this study are not optimal and should be adjusted or optimized as needed.
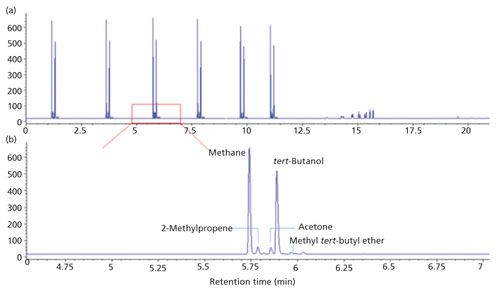
Figure 3a shows a typical chromatogram obtained from one extraction for a cable sample. To minimize the deviations induced by manual injection, six injections were made to obtain the averaged peak area for a certain extraction. The six injections were made sequentially with intervals around 2 min in a same run. Within the first 13 min, the oven was run isothermally (60 °C) for the detection of methane. Then the temperature was programmed to 300 °C to elute the low volatility components. The total time for a single run is 21 min. As can be seen in Figure 3a, there are components eluted at 14–16 min, suggesting the presence of high boiling point interferences. Therefore, although the elution of methane does not require a high temperature or a long run time, it was necessary to use a temperature program to keep the GC system clean. Figure 3b, the partial enlarged chromatogram from Figure 3a, can show the presence of other by-products besides methane. Compounds such as 2-methylpropene, acetone, tert-butanol, and methyl tert-butyl ether are eluted close to methane with baseline separation, and there are some other compounds that are eluted later under higher temperatures. Therefore, a temperature program with a ramp at 30 °C/min was added after the six sequential injections to keep the GC system clean for the next sample.
Figure 3: Typical chromatograms for one extraction to a cable sample: (a) Six consecutive injections made in one run for averaged methane response; (b) enlarged chromatogram for separation of by-products.
Method Reliability
Preliminary investigations on method precision, accuracy, and sensitivity were studied. In this method, manual injection is used with the gas bag samples and control of injection repeatability was very important to the overall method precision. Two practices were developed to ensure good repeatability:
· 5–6 consecutive injections were made on the same chromatogram at an interval of about 2 min, and the inlet gas saver was turned off to avoid different split ratios between the injection at the start of GC run and injections during the GC run.
· A daily change of the inlet septum is a minimum requirement to keep the data stable, because the needle of the large-volume gas syringe is prone to cause more damage to the septum during injections.
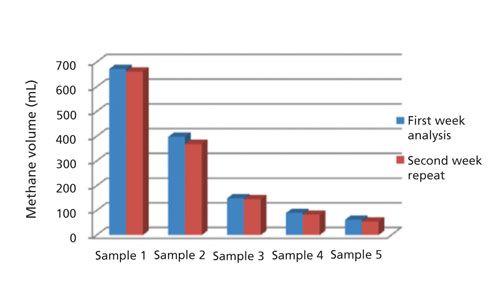
The relative standard deviation (RSD) of five consecutive injections from the same gas bag was around 1% (RSD varies from 0.6% to 0.9% under different concentrations in calibration range). Investigation of the method recovery was difficult because it was hard to prepare standard cable samples with standard methane gas spiked. Methane in cable insulation is generated by the decomposition of DCP, which is typically homogeneously compounded in the polyethylene raw material. During each extraction of MHE, the methane concentration reaches a dynamic equilibrium among different positions of cable sample and the gas bag. The methane analyzed by GC was in the gas bag and it had migrated from the inside of cable insulation, which was difficult to directly spike with methane gas. Theoretically calculating the content of methane from decomposed DCP might be another option, but the loss of methane exists even during the production stage and the actual content of methane remaining in the cable before degassing must be lower than the theoretical calculation value. So the conventional recovery study for methane quantification was not conducted. In terms of method sensitivity, the limit of detection (LOD) for methane in the gas bag was estimated to be 20 ppm (v/v) based on a signal-to-noise ratio (S/N) of 10. There is no intention to further improve the sensitivity because the methane concentration in gas bag was usually higher than 1000 ppm in general applications of this method. Figure 4 shows the results of methane quantified in the cables with different degassing time (from 0 to 130 h). Five samples were analyzed in the first week and sampling with the same degassing time of each was repeated after one week, and good reproducibility for the result was observed. A systematic investigation of method validation was not done in the study because sample collection requires collaboration with the cable production line in the manufacturing plant, which is costly and hard to justify if the cables are only manufactured for method development purposes. More validation data could be accumulated with future analyses on additional real samples.
Figure 4: Methane quantification with the MHGB method for cables of different degassing time.
Comparison of MHGB and MHE Method
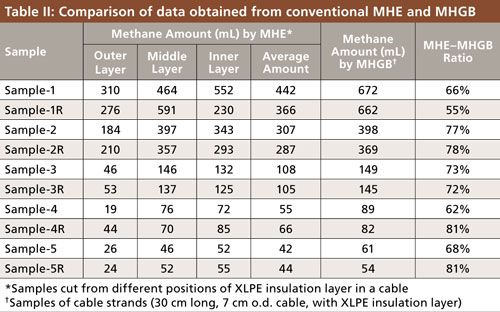
The present MHGB method shows advantages compared to conventional MHE methods, which typically use 20-mL headspace vials. Because only around 1 g of sample could be sealed in the headspace vial for conventional MHE analysis, the XLPE insulation must be cut into small pieces of specimen from outer, middle, and inner layers of the insulation layer and analyzed separately. The methane concentrations in the three different positions of insulation layer are different because the methane inside the cable has a tendency to migrate to the surface of the insulation, and the average concentration of methane is regarded as the concentration in the whole insulation. Table II shows the results analyzed by conventional MHE and MHGB for comparison. For conventional MHE analysis, samples were directly cut from the produced cables with different degassing times and then sealed into headspace vials in the plant within a very short time, to mitigate the methane loss during shipment and storage. In the meantime, 30-cm strands of corresponding cable with the same degassing time were also sampled into the gas bags for comparison study, the results of which are shown in Figure 4. For the purpose of straightforward comparison, the analyzed methane volume released with conventional MHE was adjusted to the released volume from the same weight of insulation layer in a cable sample for MHGB analysis. As shown in Table II, in spite of efforts to minimize methane losses during sample preparation by keeping the preparation time to less than 2 min, the average concentration of methane analyzed by the conventional MHE method is still lower than the results of the MHGB method. According to the results, the methane losses also depend on the methane concentration in the sample. For example, a 35–45% loss could be observed for the samples with the highest methane concentration, but there was only less than 20% loss for the samples of low methane concentration. In addition, big deviations could be observed in sample 1R and sample 4, indicating that methane loss could happen in the outer layer or inner layer of the XLPE insulation. It was concluded that the process of cutting the cable to place it in a headspace vial will cause significant losses of methane and sample heterogeneity. By using the MHGB method reported here, the methane loss during the whole analysis procedure is minimized.
Conclusion
A multiple headspace gas bag method has been established and successfully applied for the accurate quantification of methane in cable samples that forms from the decomposition of DCP in XLPE insulation. Compared to the conventional MHE method, the MHGB method has the advantage that it avoids methane losses that occur when cable samples are cut into small pieces and it analyzes a more representative sample because of the much larger sample size used. Results obtained using the MHGB technique indicate that the conventional MHE analysis may give results 20–45% lower than those provided by MHGB because of the methane losses in sample preparation. The work presented here provided a practical solution for reliable quantification of methane in cross-linked polyethylene insulation for the high voltage cable industry. Based on this method, analytical devices with automated gas bag and multiple headspace extraction operations could be developed to accelerate the establishment of industrial analytical standard methods.
Funding
This work was supported by the corporate research funding of Dow Chemical Asia Pacific R&D.
Acknowledgments
The authors would like to give thanks to global analytical networks in Dow Chemical: thanks to Shuai Lian for his help on sample preparation; special thanks to Patric Eckerle, Grant Von Wald, Bill Winniford, and Jim Luong for valuable technical discussions; and thanks to Myra Zhai, Frank Gong, Wayne Yao, and Wayde Konze for their support on this project.
References
- A.B. Smedberg, J.O. Boström, D. Wald, and R. Peters, “Comparison of Different Analytical Test Methods to Monitor Crosslinking By-products in XLPE Insulated Cables,” presented at the 7th International Conference on Power Insulated Cables (JICABLE’07), Versailles, France, 2007, p. 280–285.
- J.D. Van Drumpt and H.H.J. Oosterwijk, J. Polym. Sci., Polym. Chem. Ed.14(6), 1495–511 (1976).
- T. Andrews, R.N. Hampton, A. Smedberg, D. Wald, V. Waschk, and W. Weissenberg, Ieee Electrical Insulation Magazine22(6), 5–16 (2006).
- E. Peschke and R. Von Olshausen, Cable Systems for High and Extra-High Voltage: Development, Manufacture, Testing, Installation and Operation of Cables and Their Accessories (Publicis MCD Verlag, 1999).
- H.E. Orton and R.A. Hartlein, “Long-Life XLPE-Insulated Power Cables,” Orton Consulting Engineers International Ltd., 2006.
- E.H. Ball, H.W. Holdup, D.J. Skipper, and B. Vecellio, “Development of Crosslinked Polyethylene for High Voltage Cables,” presented at the International Conference on Large High Voltage Electric Systems, Paris, France, 1984.
- H. Faremo et al., “Improved Productivity for Power Cable Manufacture,” presented at the International Conference on Large High Voltage Electric Systems, Paris, France, 2006, B1–109.
- W. Bertsch, R.C. Chang, and A. Zlatkis, J. Chromatogr. Sci. 12(4), 175–182 (1974).
- J.W. Russell, Environ. Sci. Technol. 9(13), 1175–1178 (1975).
- P.F. Nelson and S.M. Quigley, Environ. Sci. Technol.16(10), 650–655 (1982).
- W.A. Lonneman, Sl. Kopczyns, P.E. Darley, and Fd. Sutterfi, Environ. Sci. Technol. 8(3), 229–236 (1974).
- W.A. Lonneman, R.L. Seila, and J.J. Bufalini, Environ. Sci. Technol. 12(4), 459–463 (1978).
- R. Font, I. Aracil, A. Fullana, and J.A. Conesa, Chemosphere57(7), 615–627 (2004).
- A. Fullana, A.A. Carbonell-Barrachina, and S. Sidhu, J. Agric. Food Chem. 52(16), 5207–5214 (2004).
- M. Ajhar, B. Wens, K.H. Stollenwerk, G. Spalding, S. Yuce, and T. Melin, Talanta 82(1), 92–98 (2010).
- S. Marine, M. Pedrouzo, R.M. Marce, I. Fonseca, and F. Borrull, Talanta100, 145–152 (2012).
- F.D. Stump and D.L. Dropkin, Anal. Chem. 57(13), 2629–2634 (1985).
- B. Kolb, Chromatographia15(9), 587–594 (1982).
- B. Kolb, Chromatographia19, 113–122 (1984).
- B. Kolb and L.S. Ettre, Chromatographia32(11–12), 505–513 (1991).
- J.M. Snyder and T.L. Mounts, J. Am. Oil Chem. Soc. 67(11), 800–803 (1990), doi:10.1007/BF02540495.
- E.A. Tavss, J. Santalucia, R.S. Robinson, and D.L. Carroll, J. Chromatogr. 438(2), 281–289 (1988).
- M.R. Milana, A. Maggio, M. Denaro, R. Feliciani, and L. Gramiccioni, J. Chromatogr.552(1–2), 205–211 (1991).
- O. Ezquerro, B. Pons, and M.T. Tena, J. Chromatogr. A999(1–2), 155–164 (2003).
- M. Groning and M. Hakkarainen, J. Chromatogr. A1052(1–2), 61–68 (2004).
- E. Hansson and M. Hakkarainen, J. Chromatogr. A1102(1–2), 91–95 (2006).
Clive Ji, Jian Zou, and Grace Yang are with Analytical Sciences at Dow Chemical China in Shanghai, China. Yabin Sun and Changkan Zheng are with Electrical and Telecommunications at Dow Chemical China. Direct correspondence to: Gxyang@dow.com

Study Examines Impact of Zwitterionic Liquid Structures on Volatile Carboxylic Acid Separation in GC
March 28th 2025Iowa State University researchers evaluated imidazolium-based ZILs with sulfonate and triflimide anions to understand the influence of ZILs’ chemical structures on polar analyte separation.
Quantifying Microplastics in Meconium Samples Using Pyrolysis–GC-MS
March 26th 2025Using pyrolysis-gas chromatography and mass spectrometry, scientists from Fudan University and the Putuo District Center for Disease Control and Prevention detected and quantified microplastics in newborn stool samples.


