Important Considerations Regarding Matrix Effects When Developing Reliable Analytical Residue Methods Using Mass Spectrometry
LCGC North America
Practical examples of how to correct for matrix effects in food testing to obtain reliable quantitative data using LC–MS and GC–MS
Liquid chromatography–mass spectrometry (LC–MS) using electrospray ionization (ESI) is subject to matrix effects when analyzing complex matrices, such as food samples, for trace organic residues and contaminants. Even though a sample extract has gone through extensive cleanup, there are still enough coeluted compounds to possibly cause signal suppression or signal enhancement when analyzing a complex matrix, thus adversely affecting quantitation. Likewise, gas chromatography–mass spectrometry (GC–MS) is also subject to matrix effects that can hinder accurate MS quantification. This installment of “Focus on Food Analysis” shows some practical examples of how to correct for matrix effects to obtain reliable quantitative data using LC–MS and GC–MS.
With the availability of sensitive and selective techniques such as mass spectrometry (MS), proper use of sample preparation is often overlooked. For example, many pesticides registered over the last decade are primarily polar compounds and are not amenable to gas chromatography (GC) techniques, thus liquid chromatography–mass spectrometry (LC–MS) is the methodology of choice to monitor these contaminants in foods for enforcement purposes. Likewise, LC–MS is needed for the reliable determination of other polar food contaminants such as mycotoxins and veterinary drugs. Although LC–MS offers several advantages in terms of sensitivity, selectivity, and overall speed of analysis, there are many important considerations, such as matrix effects, which must be considered when developing analytical methods. Matrix effects are either observed as suppression or enhancement of analyte signal in the electrospray ionization (ESI) source and have been studied by many researchers since the mid-1990s (1–7). Ion suppression is typically observed in atmospheric pressure ionization processes, and the causes for ion suppression in LC–MS are discussed elsewhere (8). Most of the studies have been focused on the ESI suppression rather than the enhancement because the former is the more commonly observed phenomenon (9). Quantitative analysis by GC–MS is also subject to matrix effects since matrix-induced enhancement has been observed. This enhancement results in improved chromatographic peak intensities and peak shapes because matrix components protect the analytes by covering the active sites in the GC inlet system (10–13). This installment of “Focus on Food Analysis” shows some practical examples of how to correct for matrix effects to obtain reliable quantitative data using ESI LC–MS and capillary GC–MS. The examples given include some of the more popular areas in food safety, such as pesticides, mycotoxins, melamine, perchlorate, active pharmaceutical ingredients (APIs) found in food, herbal dietary substances, and personal care products. The validation procedures used for these methods were similar to the ones described in the US Food and Drug Administration’s (FDA) “Guidelines for the Validation of Chemical Methods for the FDA FVM Program, 2nd Edition” (14). The common tools used to correct for matrix effects include stable isotope dilution, matrix-matched or method-matched standard calibration, sample dilution, method of standard additions, sample cleanup, alternative ionization sources other than ESI used in LC–MS, and analyte protectants used in GC–MS.
Stable Isotope Dilution Mass Spectrometry
The dilution of the native chemical by the addition of its stable isotopically labeled compound in a particular sample matrix is commonly referred to as stable isotope dilution assay (SIDA). This step is usually followed by LC–MS analysis since the mass spectrometer can easily separate and differentiate the native (and naturally abundant) compound from its labeled isotope because of differences in their molecular masses. The stable isotope can compensate for matrix effects since both the native compound and its isotope counterpart share the same physical and chemical properties so that they are chromatographically coeluted and interact with the same matrix components that may be responsible for any suppression effects during ionization. However, for analyzing many analytes, such as those encountered in multiresidue pesticide procedures, using SIDA-LC–MS is impractical because the stable isotopes are expensive and the isotopes for each native pesticide may not be readily available.
A procedure that was successfully performed at the FDA used SIDA and LC-tandem mass spectrometry (LC–MS/MS) to analyze mycotoxins in corn, peanut butter, and wheat flour (15). The method was single-laboratory validated by uniformly fortifying the 12 13C-labeled homologs for each of the targeted mycotoxins in the food sample, followed by extraction with 50:50 (v/v) acetonitrile–water, centrifugation, filtration, and analysis by LC–MS/MS. The method was simple to use and applicable to a wide variety of food matrices because of the effective and efficient compensation of matrix effects provided by the addition of the labeled mycotoxin standards. The success of the validated procedure was followed with a collaborative study of six laboratories to evaluate SIDA and LC–MS/MS for the simultaneous determination of aflatoxins B1, B2, G1, and G2; deoxynivalenol; fumonisins B1, B2, and B3; ochratoxin A; HT-2 toxin; T-2 toxin; and zearalenone in foods. In addition to certified reference materials, the laboratories analyzed corn, peanut butter, and wheat flour fortified with the 12 mycotoxins at concentrations ranging from 1 to 1000 ng/g. Using their available LC–MS/MS platform, each laboratory developed in-house instrumental conditions for analysis. The majority of recoveries ranged from 80% to 120% with relative standard derivations (RSDs) < 20%. Greater than 90% of the average recoveries of the participating laboratories were in the range of 90–110%, with repeatability RSDr (within laboratory) <10% and reproducibility RSDR (among laboratory) <15%. All Z scores of the results of certified reference materials were between −2 and 2. The use of 13C-internal standards eliminated the need for matrix-matched calibration standards for quantitation, and all participating laboratories were able to validate and implement a simple sample preparation procedure to achieve simultaneous identification and quantitation of these regulated mycotoxins using LC–MS/MS.
The second example where SIDA LC–MS/MS was successfully used was with the direct determination of glyphosate, glufosinate, and aminomethylphosphonic acid (AMPA) in soybeans and corn (16). These two organophosphorus acidic herbicides and metabolite (AMPA) are amphoteric, low mass, highly water soluble, and do not possess any distinguished and recognizable chromophores that could be exploited for detection. They are very difficult to retain in reversed-phase high performance liquid chromatography (HPLC) and are poorly detected by ultraviolet (UV) or fluorescence detectors. An LC–MS/MS method was developed to determine these analytes in soybeans and corn using reversed-phase LC with weak-anion-exchange and cation-exchange mixed-mode columns. Three isotopically labeled internal standards, 13C15N-glyphosate, glufosinate-d3, and 13C15N-aminomethylphosphonic acid corresponding to each analyte were used to counter matrix suppression effects when added to soybean and corn matrices. The samples were extracted with a buffer containing acetic acid and ethylenediaminetetraacetic acid (EDTA) to avoid recovery losses caused by metal ion (such as calcium) complexation with the three compounds. The supernatant was passed through an Oasis HLB solid-phase extraction (SPE) column (Waters Corporation) to retain suspended particulates and nonpolar interferences. The extract was directly injected and analyzed in 6 min by LC–MS/MS with no concentration or derivatization steps. The use of the isotope internal standard for each analyte resulted in linearity with a minimum coefficient of determination > 0.995 in the range of 10–1000 ng/mL, and accuracy (recovery %) and precision (RSD %) were evaluated at the fortification levels of 0.1, 0.5, and 2 μg/g in seven replicates in both soybean and corn samples.
The third example where SIDA LC–MS/MS was successfully used was with the determination of melamine and cyanuric acid in foods (17). In this procedure, both cyanuric acid and melamine are extracted from tissue and infant formula with a 50:50 (v/v) acetonitrile–water extraction solution, followed by centrifugation. The cleanup procedure for melamine involves mixed-mode cation-exchange SPE and that for cyanuric acid uses mixed-mode anion-exchange SPE. Consequently, aliquots of the same extract are individually processed with the two modes of SPE. The final cleaned up extracts for both melamine and cyanuric acid are in acetonitrile, making the procedure amenable to evaporate the excess solvent for sensitivity needs or solvent exchange (depending on the LC column used). Each compound is analyzed separately using a zwitterionic hydrophilic-interaction chromatography (HILIC) LC column. Electrospray ionization is used in both the negative-ion (cyanuric acid) and positive-ion (melamine) modes. Two selected reaction monitoring (SRM) transitions are monitored for both compounds. Commercially available, isotopically labeled internal standards, 13C315N3-melamine and 13C315N3-cyanuric acid for each of the native compounds, were used to correct for any matrix effects. The method limit of quantitation (LOQ) for melamine was: 25 µg/kg for tissue and liquid formula and 200 µg/kg for dry infant formula powder. The method LOQ for cyanuric acid was 50 µg/kg for tissue and liquid formula and 200 µg/kg for dry infant formula powder. Fortified test portions were within 75–125% recovery. Determination of incurred residue in tissue agreed well with the results of an independent laboratory.
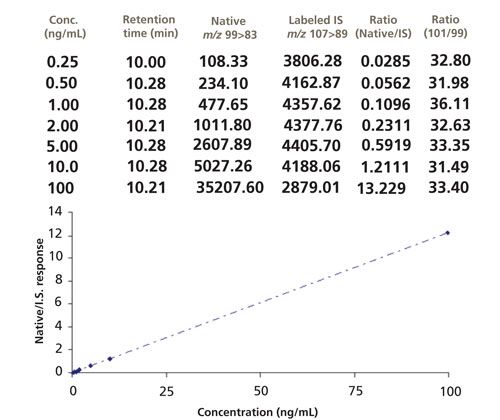
The final example where isotope dilution MS was successfully used was with the determination of inorganic perchlorate (Figure 1a) in foods (18,19). In these studies, a rapid, sensitive, and specific method was developed for the determination of perchlorate anion in foods. The foods included high-moisture fruits and vegetables, low-moisture foods (for example, wheat flour and corn meal), and infant foods. Improvements to existing procedures were made in sample preparation that reduced the sample test portion size from 100 g to 5 or 10 g and the extraction solvent volume from 150 mL to 20–40 mL, and replaced blending extraction–vacuum filtration and its associated large glassware with a simple shakeout centrifugation in a small conical tube. Procedures common to all matrices involved extraction, centrifugation, graphitized carbon SPE cleanup, and ion chromatography–tandem mass spectrometry (IC–MS/MS) analysis. A 75 mm x 4.6 mm Waters IC-Pak Anion HR column was used with a mobile phase consisting of 100 mM ammonium acetate in 50:50 (v/v) acetonitrile–water with a flow rate of 0.35 mL/min. IC–MS/MS, equipped with ESI in the negative ion mode, was used to detect perchlorate anion. An 18O4-labeled perchlorate anion internal standard was used to correct for any matrix effects. Losses of the 16O and 18O atoms from perchlorate were used as transition product ions from the native and isotope perchlorate species, respectively (Figure 1b) and provided a stable calibration curve (Figure 1c) that can be used to quantitate a variety of different food commodities. The method LOQ was 1.0 g/kg in fruits, vegetables, and infant foods and 3.0 g/kg in dry products. Fortified test portions gave 80–120% recoveries. Determination of incurred perchlorate anion residues agreed well with results for comparable commodities or products analyzed by published methods.
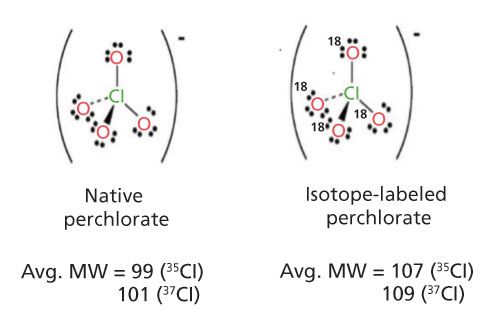
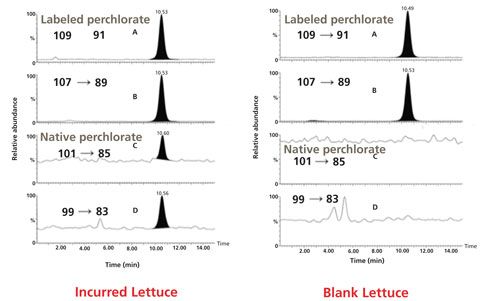
Figure 1: (a) Native and 18O-labeled perchlorate; (b) LC–MS/MS chromatograms of native and 18O-labeled perchlorate in lettuce; (c) calibration curve of perchlorate using response ratio of (native–isotope labeled internal standard) versus native perchlorate concentration (ng/mL).
The combined SIDA and LC–MS/MS procedure is very convenient for analyzing both organic, as well as inorganic (in the case of perchlorate) chemicals in difficult food matrices. In the four cases presented, the matrix effect was corrected and the isotopes were used to compensate for any loss or suppression in the quantitation of the chemical because consistent results were obtained when a stable isotope was used in the procedure. However, the native and isotope chemicals are equally affected by matrix effects and both must be able to exceed the limits of detection (LOD) and LOQ for proper identification and quantitation of the native chemical. Whether the method includes different SPE procedures involving glyphosate, melamine, and perchlorate or no cleanup at all, as in the case of the mycotoxin analysis, the use of the stable isotope before sample extraction and cleanup demonstrates that SIDA with LC–MS/MS is both a robust and rugged procedure. There is a concern about whether the cost of the stable isotope may dissuade laboratory analysts from implementing SIDA and LC–MS/MS, but there are other cost dependent factors that also need to be evaluated as well to show the advantages of SIDA, which include increased productivity, the lack of a need for matrix-matched calibration (see the next section), and consistent results (near perfect accuracy and precision) over a wide range of sample matrices.
Matrix-Matched Standard Calibration
As mentioned earlier, when developing multiresidue methods for the determination of pesticide and veterinary drug residues in foods, the use of SIDA LC–MS is impractical because several hundred isotopically labeled standards would be needed, which is costly, and the labeled standards may not be commercially available. The method of choice for validation of multiresidue procedures would involve matrix-matched standard calibration, where analytical standards are fortified in a sample extract that has been treated exactly the same as the regular sample and is free of the residues of interest. The caveat is that the blank matrix (that is, avocado, blueberry, and so on) must not contain the compounds of interest and must be consistent with the sample matrices.
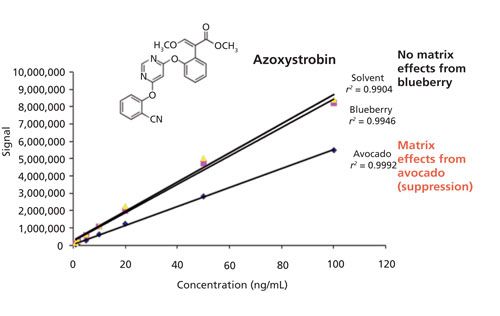
Matrix-matched calibration standards were used to validate a multiresidue method analyzing 209 pesticides in 24 agricultural commodities using the original quick, easy, cheap, effective, rugged, and safe (QuEChERS) procedure and LC–MS/MS analysis (20,21). Using solvent-only calibration standards and matrix-matched calibration standards, it was demonstrated that a minimal concentration of 5–10 μg/kg (ppb) of analytes in matrix is required for the consistent identification of targeted pesticides with two MRM transitions. Method performance was validated by the precision and accuracy results obtained from fortification studies at 10, 25, 100, and 500 ppb and matrix-matched calibration standards. The method was demonstrated to achieve an average recovery of 100 ± 20% (n = 4) for >75% of evaluated pesticides at the low fortification level (10 ppb) and improved to >84% at the higher fortification concentrations in all 24 matrices. Matrix effects in LC–MS/MS analysis were studied by evaluating the calibration curves (1.0–100 ng/mL) obtained from the solvent-only calibration standards and matrix-matched calibration standards. The matrix effect is primarily dependent on the type and concentration of the matrix and pesticide. Matrix-matched calibration standards were needed to compensate for matrix effects, and the effects of the matrix on a particular pesticide are illustrated by the calibration curves of the fungicide azoxystrobin in solvent, avocado, and blueberry (Figure 2). In the case of blueberry, the matrix had very little effect on azoxystrobin since the calibration curves between blueberry-matched and the solvent-only standard of azoxystrobin are essentially equivalent. However, when comparing the avocado-matched calibration curve with the same solvent-only calibration, suppression is observed for azoxystrobin because of the lower signal intensities. The matrix-matched (in this case, avocado-matched) calibration curve was used to identify and quantitate pesticides residues in avocado, and similar matrices are used to determine accuracy and precision results in validation studies. In this multiresidue pesticide validation, concentrations ranging from 2.5 to >1000 ppb in a variety of agricultural samples demonstrate fitness for screening, quantitation, and identification applications. The major drawbacks of matrix-matched (or method-matched, in which the matrix is fortified at the beginning of the procedure at the appropriate standard concentration and subsequently used for quantitation) standards are the need for analyte-free matrix (which may not be possible) and that additional work is required for accurate quantitation if a wide range of matrices are to be evaluated. The difficulty of selecting matrices that represent certain food groups-for example, high or low moisture, high lipid, high lipid-low moisture, acidic, and high pigmentation-is also a challenge and generalization of these food groups may not be possible.
Figure 2: The effects of ESI LC–MS/MS matrix suppression. Comparisons of solvent-only, blueberry-matched, and avocado-matched calibration curves for the fungicide azoxystrobin, indicating the influence of the matrix on a specific pesticide.
Method of Standard Additions and Sample Dilution
Although it is difficult to find a blank matrix that is consistent with the samples to be analyzed, it is not possible to compensate for matrix effects using matrix-matched standard calibrations. The only options left are sample dilution and using the method of standard additions. The obvious disadvantage with diluting the sample to compensate for matrix effects is that it will raise the limit of quantitation, which could affect the required sensitivity. Although the method of standard addition compensates for matrix effects, the disadvantages are that the approximate concentration of the analyte must be known to construct a proper calibration curve. Secondly, it requires at least three more additional sample runs per sample in order to have sufficient data points for the calibration curve.
A demonstration of the use of standard addition and sample dilution to compensate for matrix effects involves the analysis of multiple pharmaceuticals, plant toxins, and other secondary metabolites in herbal dietary supplements by ultrahigh-pressure liquid chromatography (UHPLC)–quadrupole-orbital ion trap MS (22). A UHPLC–quadrupole-orbital ion trap MS method was developed for the simultaneous determination of 96 pharmaceuticals, plant toxins, and other plant secondary metabolites in herbal dietary supplements. Target analytes were extracted from samples using the QuEChERS procedure (20). With the exception of highly polar analytes, the optimized QuEChERS extraction procedure provided acceptable recoveries in the 70–120% range. Because of variations in matrix effects in extracts of herbal dietary supplements that differ in composition, the method of standard additions and an approach based on dilution of matrix components followed by quantification using solvent standards were applied for quantification. For the majority of compounds with signal suppression above 20%, a dilution factor of 25 or higher was used. Because the outcome of the dilution-based approach is largely determined by the dilution factor used and the actual concentration of an analyte, this procedure was successfully applied for quantification of selected pharmaceuticals (indomethacin, phenylbutazone, hydrochlorothiazide, metoprolol tartrate, chloropropamide, and glibenclamide) added to test matrices at therapeutic doses. At such high concentrations, which are often used in commercial adulteration, dilution factors as high as 10,000 can be commonly used. Under these conditions, the complete elimination of the effects of the matrix is possible without compromising the detectability of analytes. The recoveries calculated by this quantitative approach ranged from 82% to 98%.
Sample Cleanup
Sample cleanup can reduce, if not eliminate matrix effects. As discussed in the previous section, sample cleanup can benefit SIDA and LC–MS analysis by removing potential matrix components that may interfere with the analysis of the chemical of interest. A study involving the simultaneous determination of hexapeptides (Ac-EEMQRR-amide and H2N-EEMQRR-amide) in antiwrinkle cosmetics by HILIC–SPE preparation and HILIC–MS/MS, involves a rapid method for the simultaneous determination of Ac-EEMQRR-amide and H2N-EEMQRR-amide in cosmetic products (23). Samples showing serious ion suppression were further cleaned up using HILIC–SPE before HILIC–MS/MS analysis. Stable isotopically labeled peptides, corresponding to the above two peptides, were used as internal standards to correct for loss of recovery and matrix effects.
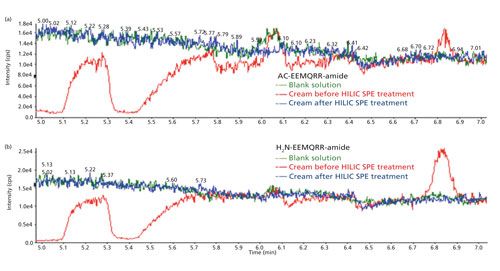
An infusion experiment was designed to evaluate matrix effects similar to another publication (24). The experiment was carried out using a built-in tee union, a syringe pump, and LC pumps as shown in Figure 3a. The mobile phases were delivered by the LC pumps using a regular gradient program. A standard solution containing the peptides was continuously introduced into the ionization source using the syringe pump connected to the tee union. A blank solvent sample was first injected to define a “baseline,” followed by an extracted “blank” sample. Since the dropped region in the baseline falls in the time window of peptides of interest (5.3 min and 6.1 min for Ac-EEMQRR-amide and H2N-EEMQRR-amide, respectively) as shown in Figures 3b and 3c, the eluted matrix components will suppress the ionization of the analytes. However, the baseline after HILIC–SPE cleanup does not show this signal suppression. Although internal standards can be used to compensate for the ion suppression of matrices, the sensitivity and detection limit would have been affected if the additional HILIC–SPE cleanup had not been used.

Figure 3: The evaluation of ion suppression caused by face cream matrix: (a) The infusion experimental protocol for detecting ion suppression; (b) the comparison of responses of Ac-EEMQRR-amide for injection of blank solution, cream sample before and after HILIC-SPE cartridge treatment; (c) the comparison of responses of H2N-EEMQRR-amide for injection of blank solution, cream sample before and after HILIC-cartridge treatment.
Changing from ESI to APCI
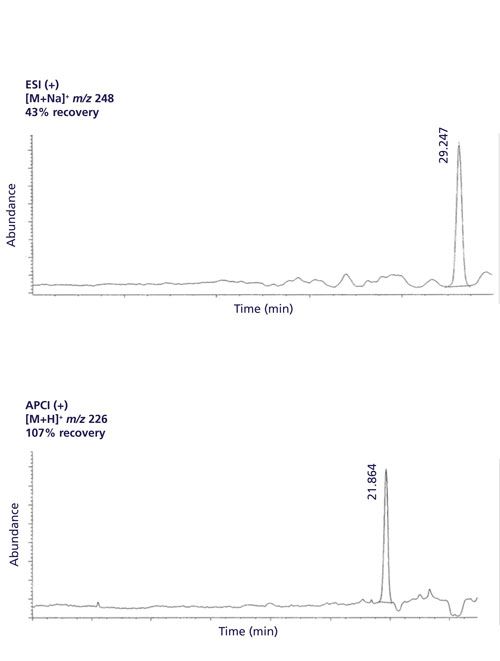
Another way to compensate for matrix effects is to change interfaces from ESI to atmospheric pressure chemical ionization (APCI). Figure 4 shows an LC–MS chromatogram of 50 ppb methiocarb in an orange sample analyzed by both ESI and APCI. When analyzing the sample using external standard in solvent calibration, the apparent recovery was 43% when using ESI in positive mode (ESI+). However, the apparent recovery dramatically improved to 107% when changing from ESI+ to APCI+ (unpublished results). This result is consistent to Souverain and colleagues (1), where APCI appears to be less susceptible to matrix effects than ESI. However, ESI is more popular than APCI because of its sensitivity, and from our experience, ESI is typically fivefold to 10-fold more sensitive than APCI for many pesticides.
Figure 4: The analysis of 50 ppb methiocarb in orange via ESI (top) and via APCI (bottom). The retention times are different because of different separation conditions.
Matrix Effects with GC–MS
As mentioned earlier, GC–MS is subject to signal enhancement since the matrix is blocking active sites in the injection liner that protects the analyte from thermal degradation (10–13). The causes of signal enhancement in GC–MS are different from signal suppression in LC–MS because in the former case enhancement is a result of the longer residence times spent by the chemical in the injector liner, whereas in the latter case suppression is primarily because of ionization efficiency. In a study (10) that involved the analysis of organophosphorus pesticides (OP) in ginseng root using GC–MS using selective ion monitoring (SIM) and GC with flame photometric detection in phosphorus mode (GC–FPD), three methods for standard calibration were used and compared: external standard in solvent, matrix-matched standards, and standard addition. When using GC–MS with SIM, organophosphorus pesticides quantitatively determined using a calibration curve based on matrix-matched standards agreed with the results obtained from the method of standard addition. The GC–MS-SIM results obtained using a calibration curve based on external solvent standards resulted in significant enhancement and higher quantitative results. When using the GC–FPD, all three methods for standard calibration agreed. With the GC–FPD analysis, a megabore column (30 m x 0.53 mm) in conjunction with a faster flow rate (10 mL/min) was used (as opposed to the narrow-bore capillary column with a flow rate of ~1 mL/min typically used with GC–MS), which resulted in a reduction of the residence times these pesticides spent in the injection liner and reduced the ability of the pesticide to accumulate within the inlet, and therefore minimized enhancement effects.
Nowadays, the current and popular trend for capillary GC analysis is to use MS-based detectors and less use of element-selective detection methods such as the FPD. Anastassiades and colleagues (11,25) discussed several possible considerations to minimize matrix effects with GC–MS such as cold, on-column injection as well as other procedures such as extensive cleanup, method of standard addition, isotopically labeled internal standards, and matrix-matched standardization that have been discussed in the previous section for LC–MS. These possible approaches have their benefits and limitations. Anastassiades and colleagues (25) proposed the use of analyte protectants, chemical additives added to the GC extracts, and matrix-free standards to provide a standardized enhancement effect that would eliminate the need to prepare matrix-matched standards and compensate for matrix enhancement. Chemical compounds containing multiple hydroxyl groups were shown to be effective protecting agents for a wide range of pesticides. The use of chemical compounds or “analyte protectants” in the GC–MS extracts and solvent calibration standards were shown to be effective in providing accurate quantitation. Since many of these protectants have multiple hydroxyl groups and high water solubility, the GC solvents used must be water soluble, which means that the GC–MS extracts and standards most likely need to be prepared in acetonitrile.
Summary
Although both LC–MS and GC–MS are highly selective, they are both vulnerable to matrix effects. Numerous chromatographic and sample preparation techniques are available to help reduce signal suppression or signal enhancement. Eliminating the risk of matrix effects is possible, but it involves careful optimization of sample preparation. Even though stable isotopically labeled standards are available, some effort in sample cleanup should be attempted so that severe signal suppression will not compromise the needed sensitivity. Several possible considerations have been provided in this report to minimize matrix effects for both LC–MS and GC–MS. With newer instrumentation being developed and technologies that will address the root cause of the matrix effects, it is quite possible to take advantage by just diluting the sample to eliminate or minimize matrix effects. Finally, when developing new analytical methods it is recommended, if possible, to take advantage of proficiency testing programs to verify how well the newly developed analytical method compares to other existing methods with regard to incurred residues.
Disclaimer
The information in these materials is not a formal dissemination of information by the FDA and does not represent agency position or policy.
References
- S. Souverain, S. Rudaz, and J.L. Veuthey, J. Chromatogr. A1058, 61–66 (2004).
- H. Trufelli, P. Palma, G. Famiglini, and A. Cappiello, Mass Spectrum. Rev.30, 491–509 (2011).
- M. Stüber and T. Reeemtsma, Anal. Bioanal. Chem.378, 910–916 (2004).
- C.R. Mallet, Z. Lum, and J.R. Mazzeo, Rapid Commun. Mass Spectrum.18, 49–58 (2004).
- C. Ferrer, A. Lozano, A. Agüera, and A.J. Girón, J. Chromatogr. A1218, 7634–7639 (2011).
- J. Schuhmacher, D. Zimmer, F. Tesche, and V. Picard, Rapid Commun. Mass Spectrom.17, 1950–1957 (2003).
- S. Wang, M. Cyronak, and E. Yang, J. Pharm. Biomed. Anal.43, 701–707 (2007).
- L. Jessome and D.A. Volmer, LCGC North Am.24(5), 498–510 (2006).
- P. Yang, J.S. Chang, J.W. Wong, K. Zhang, A.J. Krynitsky, M. Bromirska, and J. Wang, J. Agric. Food Chem.63, 5169–5177 (2015).
- J.W. Wong, M.K. Hennessy, D.G. Hayward, A.J. Krynitsky, I. Cassias, and F.J. Schenck, J. Agric. Food Chem.55, 1117–1128 (2007).
- K. Mastovska, S.J. Lehotay, and M. Anastassiades, Anal. Chem.77, 8129–8137 (2005).
- D.R. Erney, A.M. Gillespie, D.M. Gilvydis, and C.F. Poole, J. Chromatogr.638, 57–63 (1993).
- F.J. Schenck and S.J. Lehotay, J. Chromatogr. A868, 51–61 (2000).
- US Food and Drug Administration, Guidelines for the Validation of Chemical Methods for the FDA FVM Program, 2nd Edition (FDA, Rockville, Maryland, 2015, https://www.fda.gov/downloads/ScienceResearch/FieldScience/UCM273418.pdf).
- K. Zhang, M.R. Schaab, G. Southwood, E.R. Tor, L.S. Aston, W. Song, B. Eitzer, S. Majumdar, T. Lapainus, H. Mai, K. Tran, A. El-Demerdash, V. Vega, Yanxuan Cai, J.W. Wong, A.J. Krynitsky, and T.H. Begley, J. Agric. Food Chem. DOI: 10.1021/acs.jafc.6b04872 (2016).
- N. Chamkasem and T. Harmon, Anal. Bioanal. Chem.408, 4995–5004 (2016).
- M. Smoker and A.J. Krynitsky, U.S. FDA Laboratory Information Bulletin No. 4422, October, 2008.
- A.J. Krynitsky, R.A. Niemann, and D.A. Nortrup, Anal. Chem.76, 5518–5522 (2004).
- A.J. Krynitsky, R.A. Niemann, A.D. Williams, and M.L. Hopper, Anal. Chim. Acta 567, 94–99 (2006).
- K. Zhang, J.W. Wong, P. Yang, K. Tech, A.L. DiBenedetto, N. S. Lee, D.G. Hayward, C.M. Makovi, A.J. Krynitsky, K. Banerjee, L. Jao, S. Dasgupta, M.S. Smoker, R. Simonds, and A. Schreiber, J. Agric. Food Chem.59, 7936–7946 (2011).
- M. Anastassiades, S.J. Lehotay, D. Stajnbaher, and F.J. Schenck, J. AOAC Int.86, 412–431 (2003).
- L. Vaclavik, A.J. Krynitsky, and J.I. Rader, Anal. Chim. Acta810, 45–60 (2014).
- W. Zhou, P.G. Wang, A.J. Krynitsky, and J.I. Rader, J. Chromatogr A1218, 7956–7963 (2011).
- L. Jessome and D.A. Volmer, LCGC North Am.24(5), 498–510 (2006).
- M. Anastassiades, K. Maštovská, and S.J. Lehotay, J. Chromatogr. A1015, 163–184 (2003).

Alexander J. Krynitsky is the Director of the Chemical Residues-Food Safety Laboratory at Symbiotic Research, LLC in Mount Olive, New Jersey. He is also an FDA Science Adviser to FDA/ORA/ORS/ORCE. Direct correspondence about this article to: Alex.Krynitsky@SymbioticResearch.net.

Jon W. Wong is a research chemist with the U.S. FDA/CFSAN/ORS, HFS-717 in College Park, Maryland.

Kai Zhang is a research chemist with the U.S. FDA/CFSAN/ORS, HFS-717.

Hudan Safarpour is the CEO/RSO of Symbiotic Research, LLC.

Advances in Non-Targeted Analysis for PFAS in Environmental Matrices
March 27th 2025David Megson from Manchester Metropolitan University in Manchester, UK, spoke to LCGC International about the latest developments in non-targeted analysis (NTA) of per- and polyfluoroalkyl substances (PFAS) in environmental matrices based on a recent systematic review paper he has collaboratively published (1).
Study Explores Thin-Film Extraction of Biogenic Amines via HPLC-MS/MS
March 27th 2025Scientists from Tabriz University and the University of Tabriz explored cellulose acetate-UiO-66-COOH as an affordable coating sorbent for thin film extraction of biogenic amines from cheese and alcohol-free beverages using HPLC-MS/MS.
Multi-Step Preparative LC–MS Workflow for Peptide Purification
March 21st 2025This article introduces a multi-step preparative purification workflow for synthetic peptides using liquid chromatography–mass spectrometry (LC–MS). The process involves optimizing separation conditions, scaling-up, fractionating, and confirming purity and recovery, using a single LC–MS system. High purity and recovery rates for synthetic peptides such as parathormone (PTH) are achieved. The method allows efficient purification and accurate confirmation of peptide synthesis and is suitable for handling complex preparative purification tasks.


