Accuracy Validation of Size-Exclusion Chromatography
LCGC North America
Here, a procedure is described for preparing polydisperse polymer standards to validate the accuracy of any SEC method for aqueous or organic mobile phases. This approach can be used for all calibration procedures with the exception of online light scattering and viscometric detection.
A procedure is described for preparing polydisperse polymer standards to validate the accuracy of any size-exclusion chromatography (SEC) method for aqueous or organic mobile phases. The prepared standard reflects the molecular weight distribution and detector response of an authentic sample. It is then analyzed by the SEC method to obtain number- and weight-average molecular weights. Percent accuracy of the SEC method is then calculated by comparing experimental results with actual data. This approach can be used for all calibration procedures with the exception of online light scattering and viscometric detection.
Accuracy validation in size-exclusion chromatography (SEC) depends on the type of analysis being performed. If it is used for the quantitation or assay of a single main or minor peak, validation protocol is exactly the same as for high performance liquid chromatography (HPLC), in which a reference standard is analyzed as if it were the sample (1–3). With this approach, the reference standard can be prepared directly in either the mobile phase, in the blank sample matrix, or in the sample itself by the method of standard addition (4,5). However, when SEC is used for determining the molecular weight distribution (MWD) and average molecular weights (MWs) of a sample, accuracy validation becomes more complicated.
Equations used to predict the accuracy of SEC columns have been developed by Yau and colleagues (6,7). These equations are not used for method validation, but rather to assess column performance based on peak broadening and the slope of the SEC calibration (log MW versus elution volume). Many other studies on calibration plots have been concerned with either peak broadening or local polydispersity corrections (8,9), or reproducibility of data points (10), not the accuracy of the method.
Many round-robin SEC studies have been reported with and without orthogonal validation (11–14). These approaches are used for inter- and intralaboratory reproducibility and accuracy measurements to appraise the potential performance of a given SEC method. However, none of the published work has addressed the problems of SEC accuracy validation.
Since accuracy is defined as the difference between the true or expected value and the experimentally determined result, we need a series of different molecular weight reference standards of well-characterized polymers that are chemically and structurally the same as the samples. Unfortunately, there are relatively few reference standards commercially available (see Table I) and most laboratories lack resources to prepare their own. In light of this situation, this article describes an alternative procedure consisting of preparing polydisperse reference standards from monodisperse standards that are dissimilar to the sample, but nonetheless mimic the MWD and detector response of actual samples. With this approach, the accuracy of any SEC procedure can be validated.
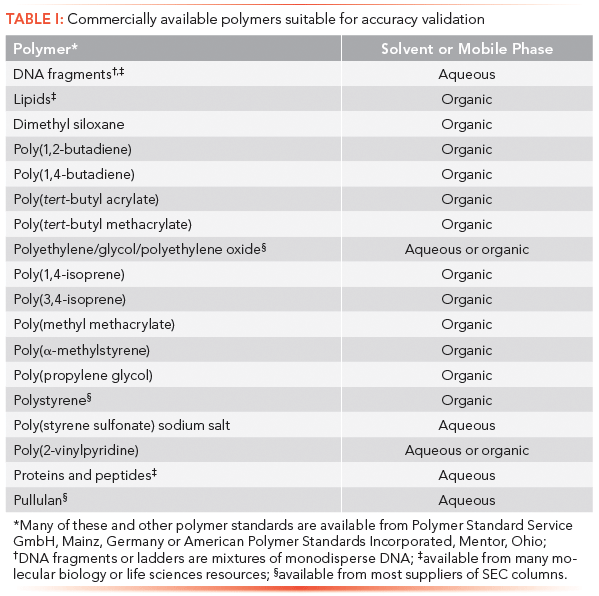
Table I: Commercially available polymers suitable for accuracy validation
Methodology
To minimize errors, the proposed reference standard consists of a two-component mixture of monodisperse standards with certified MWs and known molecular weight distributions. Uncertainty is further reduced by using equal weights of standards; this approach precludes the need of moisture or purity corrections as long as detectable, low-MW impurities are separated from the polymer envelope.
Reference standards should be subjected to the same errors experienced by the sample, which implies
1. covering nearly the same MW calibration range (Figure 1)
2. having closely matched signal-to-noise ratios
3. duplicating sample peak broadening.
To satisfy the first criterion, the reference mixture should have approximately the same number-average Mn and weight-average Mw molecular weights as the sample based on the same calibration curve. In other words, we use the same slope of the calibration plot and similar MW range of the sample. The monodisperse standards used in the mixture are the same ones used to generate the calibration plot. Most importantly, sample MW averages can be either actual or apparent values.
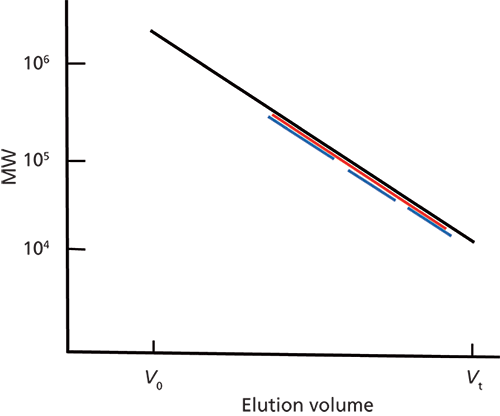
Figure 1: A typical SEC calibration where V0 and Vt are the interstitial volume and total permeation volume, respectively. The ordinate can be the MW of primary or secondary monodisperse calibrants; computer-generated MWs of a broad-MW, primary calibrant; or the hydrodynamic volume of a secondary calibrant (see Table II). The red line encompasses the MW range of samples, and the three blue lines represent different reference mixtures of standards.
For the second criterion, the peak area of the injected mixtures should closely correspond to the sample peak area. Finally, the third criterion is satisfied by injecting the same volume and operating at conditions specified by the method. Needless to say, identical instrumentation and column sets must be used to validate the accuracy of the method.
This accuracy validation procedure is applicable for all SEC methods as summarized in Table II. As formulated in this article, the procedure cannot be applied to methods using online molecular-weight-sensitive detection methods such as light scattering, viscometry, and mass spectrometry, which require a different approach.
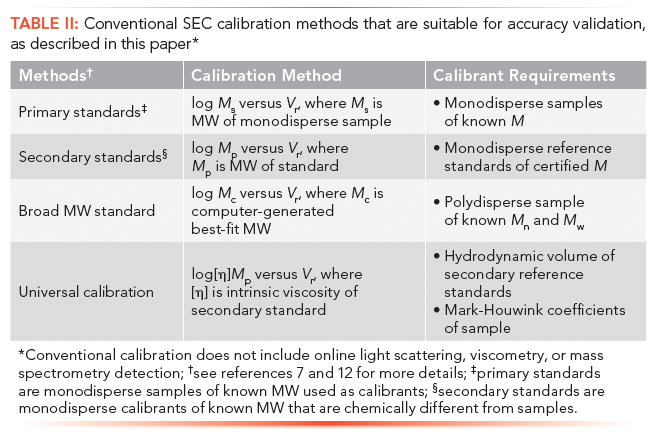
Table II: Conventional SEC calibration methods that are suitable for accuracy validation, as described in this paper*
Calculations
Our goal is to prepare a reference standard that closely matches the actual or apparent sample MW values. This is accomplished by mixing together equal amounts of two monodisperse calibrants of known MW that cover the MW range of samples.
We start with the definitions of Mn and Mw:

where Mi is the MW and wi is the corresponding weight of the ith component. For a two-component mixture, let M1 and M2 be the MWs of monodisperse standards with corresponding weights w1 and w2, then

If the amounts of the two standards are set equal to one another, equations 3 and 4 become

with a polydispersity of

The solutions to simultaneous equations 5 and 6 are simply

where M1 and M2 are the MWs of the monodisperse standards needed to give the sought after Mn and Mw values.
To ensure that the prepared standard has a detector response similar to that of the sample, the weight (w) of each standard in the mixture is

where ws is the typical sample weight specified by the method and Rf is the detector response factor given by

in which dn/dc is the specific refractive index of the sample (subscript s) and standard (subscript std). If these values are not available or if a detector other than a refractometer is used, peak area A, normalized with respect to injected concentrations, can be used instead. A compilation of dn/dc values can be found in the literature (12,15).
The injection concentration cstd of the prepared standard is

where v is the volume of solvent, typically the mobile phase, specified by the method for sample preparation. Note: If cstd is greater than the injected sample concentration, the user must confirm that the concentration of the reference mixture is below the critical polymer concentration to avoid macromolecular crowding (1) or viscosity effects (1). This is done by injecting the standard at several lower concentrations to make certain that the elution volume is not a function of concentration.
Procedure
Please note that primary standards are monodisperse samples of known MW used as calibrants. Secondary standards are monodisperse calibrants of known MW that are chemically different from samples.
1. Generate SEC calibration curve (log M versus Vr) using either primary or secondary monodisperse standards (see Table I), or a broad-MW primary standard with defined average MWs (1).
2. Obtain Mn and Mw values of at least three representative samples using the SEC calibration specified by the method. Take the average of these results.
3. With equations 8 and 9, estimate M1 and M2 needed to generate the experimental Mn and Mw values of an average representative sample.
4. Select two monodisperse standards that most closely match M1 and M2 obtained in step 3 (see Table I). The polydispersity of the mixture should be equal to or greater than the average value calculated in step 2.
5. Recalculate to obtain the true number-average (Mn)t and weight-average (Mw)t of the mixture with equations 5 and 6, where subscript t represents the true or expected values.
6. Formulate two additional reference standards with MW averages greater and less than those in step 5.
7. Determine the response factor of the standard according to equation 11.
8. Weigh out the prescribed amounts of monodisperse standards and dilute to volume following equations 10 and 12.
9. Analyze the three prepared standards with triplicate injections (4–6). Determine (Mn)exp and (Mw)exp values using the calibration procedure specified for samples.
10. Calculate an average (Mn)exp and (Mw)exp for each reference mixtures.
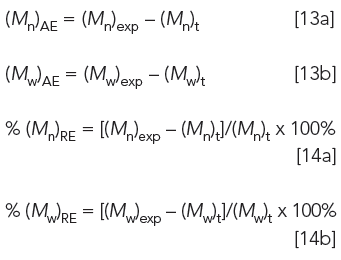
11. Address accuracy by using equations 13a and 13b for absolute errors (Mn)AE and (Mw)AE and equations 14a and 14b for relative errors % (Mn)RE and % (Mw)RE (16):
Conclusions
A procedure was proposed for validating the accuracy of any SEC method that uses either primary or secondary monodisperse calibrants, including broad-MW and universal calibration. As written, the equations are not applicable for use with online molecular-weight-sensitive detection methods such as light scattering, viscometry, or mass spectrometry. This accuracy validation approach can be applied to the SEC analysis of any polydisperse sample. The method is used when representative well-characterized samples (that is, with known MW averages) are unavailable.
The preparation of a polymer standard is described that closely reflects the MWD and detector response factor of samples being analyzed. To ensure the highest accuracy, the standard is composed of just two secondary, monodisperse standards with known MWs. The two monodisperse standards are added together in equal amounts, eliminating errors related to their purity, typically moisture content.
The two-component mixture of standards will typically give a bimodal distribution, unless the MW values of the two standards are close to one another. As such, it approximates, not duplicates the actual MWD of samples. More-complicated MWDs can be prepared by adding together different amounts of monodisperse standards. To comply with accepted statistical analysis, we recommend using three different standard mixtures and triplicate injections (1,2,4,5).
References
(1) G. Kateman and L. Buydens, Quality Control in Analytical Chemistry, 2nd ed. (Wiley Interscience, New York, New York, 1993).
(2) L. Huber, Validation and Qualification in Analytical Laboratories (Interpharm Press, Buffalo Grove, Illinois, 1999).
(3) S.S. Doss, N.P. Bhatt, and G. Jayaramen, J. Chromatogr. B 1060, 255–261 (2017).
(4) L.R. Snyder, J.J. Kirkland, and J.L. Glajch, Practical HPLC Method Development (Wiley-Interscience, New York, New York, 1997).
(5) L.R. Snyder, J.J. Kirkland and J.W. Dolan, Introduction to Modern Liquid Chromatography, 3rd ed. (Wiley-Interscience, New York, New York, 2009).
(6) W.W. Yau, J.J. Kirkland, D.D. Bly, and H.J. Stoklosa, J. Chromatogr. 125, 219–230 (1976).
(7) A.M. Striegel, W.W. Yau, J.J. Kirkland, and D.D. Bly, Modern Size Exclusion Liquid Chromatography (Wiley, New York, New York, 2009).
(8) T. Provder, Ed., Detection and Data Analysis in Size Exclusion Chromatography, ACS Symposium Ser. 352 (American Chemical Society, Washington, D.C., 1987).
(9) T.H. Mourey and S.T. Balke, J. Appl. Polym. Sci. 70, 831–835 (1998).
(10) S.T. Balke, Quantitative Column Liquid Chromatography (Elsevier, Amsterdam, The Netherlands, 1984).
(11) S. Mori, Int. J. Polym. Anal. Charact. 4, 531–546 (1998).
(12) S. Mori and H.G. Barth, Size Exclusion Chromatography (Springer Verlag, Berlin, Germany, 1999).
(13) U. Just., S. Weidner, P. Kiltz, and T. Hofe, Int. J. Polym. Anal. Charact. 10, 225–243 (2005).
(14) A. Ritter, M. Schmid, and S. Affolter, Polym. Test. 29, 945–952 (2010).
(15) J. Brandrup, E.H. Immergut, and E.A. Gurlke, Eds., Polymer Handbook, 4th ed. (Wiley-Interscience, New York, New York, 2003).
(16) D.A. Skoog, F.J. Holler, and S.R. Crouch, Instrumental Analysis (CENGATE Learning, Andover, Massachusetts, 2002).
ABOUT THE AUTHOR
Howard G. Barth is with Analytical Chemistry Consultants, Ltd., in Wilmington, Delaware. Direct correspondence to: howardbarth@gmail.com

New Method Explored for the Detection of CECs in Crops Irrigated with Contaminated Water
April 30th 2025This new study presents a validated QuEChERS–LC-MS/MS method for detecting eight persistent, mobile, and toxic substances in escarole, tomatoes, and tomato leaves irrigated with contaminated water.
Accelerating Monoclonal Antibody Quality Control: The Role of LC–MS in Upstream Bioprocessing
This study highlights the promising potential of LC–MS as a powerful tool for mAb quality control within the context of upstream processing.
University of Tasmania Researchers Explore Haloacetic Acid Determiniation in Water with capLC–MS
April 29th 2025Haloacetic acid detection has become important when analyzing drinking and swimming pool water. University of Tasmania researchers have begun applying capillary liquid chromatography as a means of detecting these substances.

.png&w=3840&q=75)

.png&w=3840&q=75)


.png&w=3840&q=75)


.png&w=3840&q=75)


