Where Did That Peak Come From?
A broad peak where it doesn't belong is a classic sign of late elution.
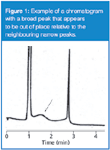
Occasionally the chromatogram generated by a liquid chromatography (LC) method looks strange. One of those oddly appearing cases is when the peak doesn't seem to belong with the neighbouring peaks in the chromatogram. This month's "LC Troubleshooting" looks at one such case. An example is shown in Figure 1, where the peaks at 1 min and 2.75 min look normal, but there is a broad peak that shows up at approximately 1.5 min. I do not know the chromatographic conditions for this run, but for the present discussion, let's assume that it is a reversed-phase method run on a C18 column. As a general rule, all the peaks in a particular part of the chromatogram, whether it is an isocratic or gradient run, should be about the same width. So when a broad peak appears, it is a sign that something is wrong.

Figure 1
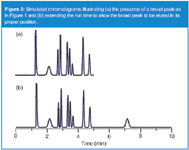
One of the most likely causes of broad peaks in the presence of normal, narrower ones is late elution — a peak that belongs to a previous run. This is simple to determine by extending the run time until the peak emerges. I've shown this in the pair of simulated chromatograms shown in Figure 2. In Figure 2(a), a broad peak appears at 2.2 min, obviously out of place when compared with its neighbours. In Figure 2(b), the run time was extended and another peak appears at 7.2 min. This peak has the expected width for its position in the chromatogram. This tells us that the 2.2 min peak comes from the previous injection.

Figure 2
Let's go back to the broad peak of Figure 1 to consider another way to figure out where the extra peak really belongs. To do this, we need to do a few simple calculations. First, we need to determine the column plate number N for the peaks that behave as expected. Recall that the plate number (also called the column efficiency) is calculated as

where tR is the retention time and w is the width of the peak at the baseline, measured between tangents drawn to the sides of the peak. We can use equation 1 to calculate the plate number for a normal peak in the chromatogram. In this case I chose the third peak of Figure 1. I expanded the chromatogram and did my best to measure the retention time and peak width, based on the supplied time scale: tR = 2.75 min and w = 0.1 min. Using equation 1 with these values gives N = 12 100 for peak 3. I have assumed that all peaks in the chromatogram have the same plate number, which is reasonable for this estimation technique.
Now that I know the plate number for the normal peak, I can determine the true retention time for the broad peak. First, I have to rearrange equation 1 to

From my expanded chromatogram, I have estimated w = 1.05 min for the broad peak. Now that I know both N and w, equation 2 allows me to calculate tR = 28.9 min for the broad peak, not at 1.5 min as it appears. This means that it might be frustrating to extend the run time until the peak is eluted, because it doesn't come from the previous chromatogram but from the run six injections earlier. It should be noted that using this procedure to estimate the retention of a peak is rather sensitive to small measurement errors — an estimated peak width of 1.0 min gives tR = 27.5 min. So do your best to estimate the retention times and widths from the chromatogram, but don't expect an exact result.
What Next?
So now that we know the retention time of the broad peak, let's consider how we might modify the method to either allow us to quantify the peak if it is a peak of interest, or get rid of it if we are not interested in it.
If we are interested in quantifying the peak, we should first ask ourselves if an isocratic method is reasonable for a peak that is eluted so long after the previous peak of interest at tR ≈ 2.75 min. For this, it is useful to calculate the retention factor k:

where t0 is the column dead-time. If we assume the peak at 1.0 min in Figure 1 to be the unretained peak at the beginning of the run, we can use this for t0, allowing us to calculate k = 1.75 for the 2.75 min peak and k = 27.9 for the 28.9 min peak. As a general guide, we can use an isocratic separation if the ratio of k values for the first and last peak is less than 20. In this case, the ratio is approximately 16, so strictly speaking, an isocratic method is feasible. However, with such a wide gap between the two peaks, a gradient might be a much better choice. If we decide to convert the method to a gradient method, I would start the gradient at the same solvent composition as the current isocratic run, or perhaps with 5% less organic, and run a 5%/min gradient to 100% organic. This will give us an idea of where the last peak is eluted under gradient conditions and we can modify the gradient as required for a more favourable chromatogram.
An alternative to a linear gradient would be a step-gradient. In this case, I would run the current isocratic conditions until the 2.75 min peak is eluted, then at 3 min, step the mobile phase concentration to a higher value. We can use the rule-of-three to estimate the required mobile phase change. The rule-of-three states that a 10% change in organic will change k by approximately three-fold, So a 10% increase in organic should reduce k for the last peak from k = 28 to k = 28/3 = 7. I would try a 10% step first, then refine it a bit, as appropriate, to reduce the last peak to a reasonable retention time. Just make sure to allow enough time after the step change in mobile phase so the baseline stabilizes before elution of the last peak.
If we decide to stay with an isocratic method, I would start with a 30 min or 35 min run under the current isocratic conditions to determine the true retention time of the last peak, then adjust the run time as necessary. This would make a very long run time for a two-peak chromatogram. An alternative approach would be to adjust the run time so that the last peak is eluted during a later injection, but in a region where it does not overlap the 2.75 min peak. For example, increasing the run time from its present 5 min injection cycle to a 10 min cycle, the 28.9 min peak from the first injection would be eluted at 8.9 min in the third injection, but well separated from the 2.75 min peak. The actual run time should be adjusted for best results using this technique.
Get Rid of It
If, however, we are not interested in the broad peak, there are several options to eliminate it. One would be to adjust the isocratic run time, as earlier, to move the peak to an unimportant region of the chromatogram. A second approach would be to use a step-gradient or a steep gradient to flush the peak from the column as soon as the 2.75 min peak was eluted.
If we are willing to modify the sample preparation process, there are more options to eliminate the broad peak. Reversed-phase chromatography separates samples primarily based upon their polarity, with nonpolar, or hydrophobic, analytes eluted later than their more polar, hydrophilic, counterparts. We know from its long retention time that the broad peak is much less polar than the 2.75 min peak. We can take advantage of this fact to design a sample clean up method to remove the unwanted peak before injection.
One option to remove the strongly retained peak would be to use solid-phase extraction (SPE). A simple C18 SPE cartridge should do the job, because of the large difference in polarity between the desired and undesired compounds. Following the initial activation of the cartridge, usually with a millilitre or two of methanol followed by the same volume of water, the sample would be loaded onto the cartridge in a highly aqueous solution. This should trap both the 2.75 min peak and the 28.9 min peak on the cartridge. Next, a series of elution solvents would be tried, for example, 10% methanol, 20% methanol, and so forth. Each fraction would be collected and injected to determine how much methanol was required to elute the 2.75 min peak and leave the other peak on the cartridge. The strongest solvent that elutes the 2.75 min peak and not the late peak is likely to be the best choice for fast sample preparation.
An alternative to SPE is to use liquid–liquid extraction. In this case, a nonpolar solvent that does not mix with water would be the first choice, for example, methyl tert-butyl ether (MTBE). As a first experiment, I would place 0.5 mL of aqueous sample in a 1.5 mL microcentrifuge tube, add 0.5 mL MTBE, cap and vortex the sample. If necessary, the tube could be centrifuged briefly to separate the phases. The lower, aqueous phase would then be injected and if we are lucky, the 2.75 min peak will remain in the aqueous phase and the 28.9 min peak will have moved to the MTBE phase. The extraction conditions may need to be adjusted to obtain the desired results.
Validation Considerations
What are the validation implications for the changes discussed earlier? Regulatory guidelines, such as the United States Pharmacopoeia (USP), state that it is permissible to adjust a method to meet system suitability, but if the method is modified, some revalidation is required. However, there is no consensus on where adjustment stops and modification starts. We can speculate how each change might fit in the adjustment-modification continuum. In any case, I would consult with the quality assurance (QA) group for advice on the official interpretation of the regulatory guidelines by my company, and how these would affect any requirements for revalidation.
Any of the changes to the method so that the broad peak could be quantified suggest that the broad peak was not an expected part of the original method, In this case, some additional validation would be required to show that the peak could be properly measured. This validation is concerned more with quantification of the peak than modification of the chromatographic conditions.
Changes to the method that move the broad peak to an unwanted part of the chromatogram or strip the peak from the column after the 2.75 min peak is measured would be more likely to fall in the adjustment category. My conclusion is based upon the fact that whatever is done to the conditions after the desired peak is eluted should have no impact on its quantification. In this case, it should be sufficient to make a few experiments to show that system suitability is met with the new conditions and that the data gathered for the 2.75 min peak are not significantly different from those obtained under the original conditions. Proper documentation of these tests should be made, of course.
I would consider any alteration of sample pretreatment to be a modification of the method, and it would require some revalidation.
Conclusion
When a broad peak appears among narrow peaks in a chromatogram, one of the most likely sources of the broad peak is that it originated from a previous injection. We have looked at several options to move the broad peak, either to allow it to be quantified or to remove it from the chromatogram. Some of these changes are simple and would be unlikely to impact the validity of the method, whereas other changes would require some revalidation of the method.
In many cases, a broad peak comes from the previous injection, and an extended run time will allow it to be eluted in the proper position, as in Figure 2(b). In other cases, the true retention is much longer, and other actions are more appropriate. And some samples contain materials that are so strongly retained and are at such low concentration that they do not show up as peaks at all, but rather result in a wavy, undulating baseline as more and more samples are run. When this kind of sample is encountered, flushing the column with a strong solvent after each sample batch might be sufficient to strip these materials from the column and restore a flat baseline for the next batch of samples.
"LC Troubleshooting" editor John W. Dolan is vice president of LC Resources, Walnut Creek, California, USA; and a member of LCGC Europe's editorial advisory board. Direct correspondence about this column to "LC Troubleshooting", LCGC Europe, Poplar House, Park West, Sealand Road, Chester CH1 4RN, UK, or e-mail Alasdair Matheson, the editor, at amatheson@advanstar.com
Polysorbate Quantification and Degradation Analysis via LC and Charged Aerosol Detection
April 9th 2025Scientists from ThermoFisher Scientific published a review article in the Journal of Chromatography A that provided an overview of HPLC analysis using charged aerosol detection can help with polysorbate quantification.
Removing Double-Stranded RNA Impurities Using Chromatography
April 8th 2025Researchers from Agency for Science, Technology and Research in Singapore recently published a review article exploring how chromatography can be used to remove double-stranded RNA impurities during mRNA therapeutics production.


