Volumetric Absorptive Microsampling for Hepcidin Peptide Extraction from Whole Blood
LCGC North America
Whole blood analysis is an emerging trend in the field of bioanalysis. We developed a fast and simple protocol to extract and analyze a peptide, hepcidin, from whole blood. Sampling and extraction were carried out using volumetric absorptive microsampling (VAMS), a novel blood collection device that allows the sampling of a known blood volume independently from hematocrit. The composition of the extraction medium was optimized using an experimental design to get the most intense signal of hepcidin, considering different organic solvents and acidic additives.
Whole blood analysis is an emerging trend in the field of bioanalysis. We developed a fast and simple protocol to extract and analyze a peptide, hepcidin, from whole blood. Sampling and extraction were carried out using volumetric absorptive microsampling (VAMS), a novel blood collection method that allows the sampling of a known blood volume independently from hematocrit. The composition of the extraction medium was optimized using an experimental design to get the most intense signal of hepcidin, considering different organic solvents and acidic additives.
Blood is a commonly used biological matrix to perform varied analyses as routine checkup, disease diagnosis, or medical treatment monitoring. However, the major part of blood analysis is not performed on whole blood, but on plasma or serum obtained from blood after centrifugation. This procedure, even if not complex, requires material, sample manipulation, and time.
Dried blood analysis has been known for decades (Robert Guthrie developed his well-known phenylketonuria test on dried blood spots in the late 1950s), but it has regained interest in the last few years (1,2). It offers an easy way of collecting, shipping, and storing samples at room temperature, unlike plasma or serum samples that require freezing for shipping and conservation.
Blood is commonly collected by venipuncture, but alternative (self-) sampling techniques are available, such as finger or heel pricks that allow painless and less-invasive collection of a small volume (a few drops) of capillary blood. In practice, the pain-free collection of a few blood drops to perform one or more analyses has several advantages. These advantages are well-known in the context of newborn screening tests, but at-home blood sampling in the context of personalized medicine, or studies in small laboratory animals represent other promising applications. For example, in the context of the three R’s (refine, reduce, replace), performing a complete pharmacokinetic (PK) study on the same animals all along during the experiment is valuable, not only from the ethical and economical point of view, but also for the significance of the observed results (3,4).
Whole blood analysis has a well-described challenge: the complexity of the matrix. Blood is composed of cells and plasma, with the latter containing a huge variety of components, such as proteins, lipids, sugars, amino acids, salts, hormones, and metabolites. The analytical challenge consists of specifically detecting the compounds of interest without being affected by the other compounds of the matrix in an uncharacterized manner (5).
Manufacturers are putting effort into the development of new collection supports that allow easy sample collection (feasible by the patient itself at home, for example), and fast and reliable subsequent analysis in the laboratory. Dried blood spot (DBS) sampling is the most common dried blood analysis sampling technique: a blood drop is collected on an appropriate filter paper and allowed to dry before further handling (1,6). Several kinds of filter papers have been commercialized, based on cellulose or a polymeric support, with or without pretreatment. One of the well-described difficulties of DBS is the difference in sample diffusion on the filter paper from one sample to another. The sample diffusion is affected by blood viscosity that strongly depends on hematocrit (the ratio of the volume of red blood cells to the total volume of blood). Since the hematocrit varies between individuals, it represents a source of bias that is problematic for quantitation. This limitation could be avoided by spotting a precise blood volume (for example, by means of a glass capillary) and cutting the whole blood spot, whatever its size (6).
Aside from the DBS filter paper collection technique, some alternate methods have been proposed. Volumetric absorptive microsampling (VAMS) is a novel collection approach that allows the collection of a defined volume of blood independently of hematocrit (7,8). The sampling device consists of a polymeric porous and absorbent tip (hydrophilic porous material) located at one extremity of a plastic body. The tip is placed at the surface of the blood sample. When fully red, it is then allowed to dry for at least 2 h at room temperature. Each tip has a constant, highly reproducible internal porous volume, which has been designed for accurate and precise wicking volume (7,8). The extraction is performed in a 96-well plate with an appropriate extraction solvent, then filtrate. This step of the procedure has to be carefully optimized (12). It requires low sample volume (10 mL), which is interesting when the availability of the sample is limited, for example. This is the case for pediatric applications, but also for studies on small laboratory animals (9,10).
In this work, the VAMS technique was used to collect human blood to extract hepcidin, a peptide hormone, for further analysis using microfluidic liquid chromatography coupled to tandem mass spectrometry (LC–MS-MS). Experimental design was used to find the most appropriate extraction medium composition to maximize analyte signal.
Experimental
Chemicals
Human synthetic hepcidin (DTHFPICIFCCGCCHRSKCGMCCKT) was synthesized by the Peptide Institute Inc. Whole blood was collected in MiniCollect EDTA tubes (Greiner Bio-One) from a healthy human control subject by finger prick. The ethical committee of the university hospital (CHU-Liege, Belgium) approved this study and the healthy control gave written informed consent.
Instruments and Materials
Chromatographic separation was achieved on an Agilent 1200 series LC-chip system consisting of a nanoflow pump, a capillary pump, a well-plate sampler and an LC-chip–MS interface. Mass spectrometric detection was performed using a 6340 ion-trap MS system equipped with a nanoelectrospray ionization source operating in positive mode (Agilent Technologies). ChemStation software (Agilent Technologies) was used for instrument control. MS detection parameters were set by TrapControl software (Bruker Daltonik GmbH). Raw MS data were processed using DataAnalysis software (Bruker Daltonik GmbH).
Mitra volumetric absorptive microsamplers were obtained from Neoteryx. Sample evaporation was performed on a vacuum concentrator (Labconco).
Sample Preparation
Hepcidin was dissolved in a mixture of 80:20:0.1 (v/v/v) water–acetonitrile–formic acid to reach a concentration of 1 µg/mL. The solution was then separated in aliquots and stored at -80 °C.
For each sample realized in duplicate, 22.5 µL of fresh blood was spiked with 2.5 µL of hepcidin solution at the appropriate concentration to obtain
25 µL of spiked matrix at 50 ng/mL in a Protein LoBind tube (Eppendorf). After that, the microsampler was dipped into the matrix sample so that the tip just touched the surface of the sample. After the tip was fully colored, an additional contact of 2 s was observed. The microsampler was then allowed to dry for at least 2 h at room temperature. The microsamplers were placed on a 96-well Ostro sample preparation plate (Waters Inc.) and allowed to shake in 200 µL of the appropriate extraction solvent for 5 min at 600 rpm (20 °C) in a Thermomixer mixer and incubation device (Eppendorf). The plate was then placed on a vacuum manifold (Waters Inc.) and the samples were collected in an Eppendorf Protein LoBind 96-well plate before evaporation and reconstitution in 100 µL of 33.8:66.2:0.1 (v/v/v) acetonitrile–water–trifluoroacetic acid (11,12). This collection and extraction scheme is illustrated in Figure 1.
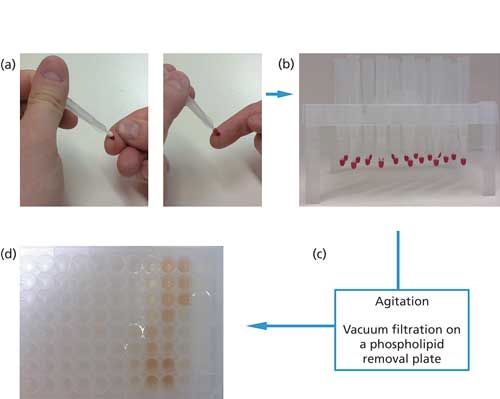
Figure 1: VAMS sampling and extraction procedure: (a) blood drop absorption on the porous tip of the VAMS; (b) drying of the VAMS devices (>2 h at room temperature); (c) extraction in the optimized solvent on a phospholipid removal plate, then phospholipid removal from the extracted solution on a vacuum manifold; (d) final extracted solutions (different in extract colors are due to the different extraction mixtures that were used (see Figures 3 and 5).
LC–MS-MS Analysis
Chromatographic separation was performed on a ProtID-chip including a 40-nL trapping column and a 43 mm x 75 μm analytical column, both packed with Zorbax 300SB 5-μm C18 phase (Agilent Technologies). Mobile-phase A was 100:0.1(v/v) water–formic acid, and mobile-phase B was 90:10:0.1 acetonitrile–water–formic acid, both degassed by ultrasonication for 15 min before use. The analytical process was performed in two steps: First, the sample was loaded on the trapping column during an isocratic enrichment phase using the capillary pump delivering a mobile phase in isocratic mode composed of 15% B at a flow rate of 4 µL/min. A flush volume of 6 µL was used to remove unretained components. Then, after valve switching, a gradient elution in backflush mode was performed through the enrichment and analytical columns using the nanopump. The gradient started at 15% B and linearly ramped up to 95% B in 5 min. This proportion was maintained for a further 5 min before it was returned to 15% B. Before the next injection, 10 column volumes were used for reequilibration. All of the experiments were carried out with a 1-µL sample injection volume. For MS-MS detection, the [M+4H]4+ parent ions were used for hepcidin (m/z 698.4) detection, and eight fragment ions were extracted for each compound to provide chromatograms that were used for quantitation, as previously described (11).
Design of Experiments
To optimize the hepcidin extraction, a two-step chemometric procedure was implemented. First, an L18 Chakravarty screening design was used to select the most significant factors to be used in the optimization design. The second step consisted of a face-centered central composite design (CCD) for optimization. These designs and their subsequent statistical evaluation were performed with JMP software (SAS Institute).
Results and Discussion
Preliminary Study
Optimization of all factors relative to the analyte extraction from the biological matrix is of the utmost importance to obtain good sensitivity and robust conditions ensuring reproducible results required for quantification.
In this study, hepcidin was chosen as the model peptide. Hepcidin is a rather challenging peptide to be quantified because of its low concentration in biological fluids, but also because it was found to stick onto the container surface and the different parts of the analytical system (11). This peptide plays a key role in the regulation of iron homeostasis. Its determination is thus useful for the diagnostic or classification of iron disorders, such as hereditary hemochromatosis, anemia from chronic disease, or iron deficiency anemia. More recently, it was also described as an interesting biomarker for some inflammatory diseases and cancers (13,14).
Out of the number of peptides potentially relevant for clinical applications, hepcidin is present at a low abundance in the biological fluids; therefore, the signal intensity (that is, hepcidin peak area) of hepcidin will be the decisional criterion for the present study. MS detection parameters were optimized by infusion using the electrospray interface in positive ionization mode. Among the different peaks related to hepcidin, m/z 698.4 corresponding to the four times charged species, was selected. A fragmentation amplitude value of 0.9 V was found to be optimal, as abundant doubly, triply, and quadruply charged product ions were obtained, including (y23)4+, (y24)4+, (y19)3+, (y21)3+, (y22)3+, (y23)3+, (y19)2+, and (y21)2+.
We previously worked on the quantification of this peptide in human plasma using a solid-phase extraction (SPE) approach for sample preparation (11) and in human whole blood using VAMS, but without carefully optimizing the nature of the organic solvent and the acidic additive present in the extraction medium (12). In this previous study, we demonstrated that the extraction time duration is an important parameter to be considered. Indeed, if the extraction duration is too long, the matrix effect and the ion suppression become very important, resulting in the complete loss of the hepcidin signal. After careful optimization of this parameter (12), the optimal extraction duration was settled at 5 min.
In this work, preliminary experiments were performed to investigate several potentially interesting organic solvents for hepcidin extraction from the dry blood matrix. As can be seen in Figure 2a, methanol, isopropanol, and acetonitrile were tested at 80% in the extraction mixture and were found to provide significant differences in the hepcidin extraction yield. Figure 2b illustrates the overall extraction of endogenous compounds of the blood matrix. As can be seen in this figure, acetonitrile provided the lowest total ion chromatogram (TIC) signal, probably because of the fact that most of the matrix proteins are precipitated and remained embedded in the tip leading to low hepcidin extraction. On the contrary, TIC signals with methanol and isopropanol were found to be more intense meaning that more molecules, not only hepcidin but also potentially interfering compounds, were extracted.
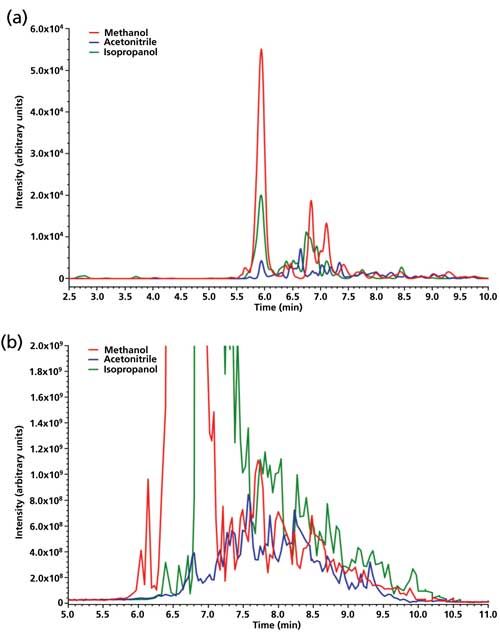
Figure 2: Influence of the nature of the organic solvent for hepcidin extraction (methanol, acetonitrile, and isopropanol). The extraction mixture was 80% organic solvent, 20% water, and 0.1% formic acid. (a) EIC for hepcidin and (b) TIC full scan.
From these results, only methanol and isopropanol were kept for further investigations.
Design of Experiment Approach
To efficiently optimize the extraction procedure of hepcidin from VAMS, a chemometric approach using design of experiments was performed. First, a screening design narrowed down a list of several inputs to a more manageable range. After that, a response surface design was used to investigate the main effects, but also potential quadratic effects and interactions between the selected factors.
Screening Design
The experimental factors were the nature of the organic modifier and the volatile acid present in the extraction medium. Two organic modifiers were studied: methanol and isopropanol as well as three volatile acids: formic acid, trifluoroacetic acid, and trichloroacetic acid. The tested ranges were from 50% to 90% of organic modifier, and from 0.01% to 0.5% for volatile acid. The peak area was chosen as response because it reflects the combination of extraction yield from the VAMS device as well as matrix effect caused by the coextraction of endogenous compounds from blood.
An L18 Chakravarty screening design was implemented to determine the significant factors that would be further investigated in the second step. This screening design allowed the management of all the considered factors, including both three-level categorical factors. Finally, 18 experimental conditions were defined and performed in duplicate, leading to a total of 36 experiments.
Because of the non-normal distribution of the results, a Box-Cox transformation was applied (λ = 0.4). The model built by the software had an excellent prediction since the adjusted r2 of the model was 0.9772, roughly meaning that the model explains more than 97% of the peak area variability of (see Figure 3a). The main effects of all the considered factors were found to be significant (p-value < 0.0001) on peak area.
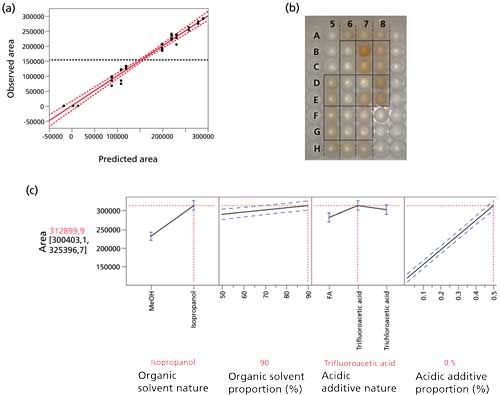
Figure 3: Optimization of the extraction conditions for volumetric absorptive microsampling by experimental design (L18 screening design). (a) Agreement between the observed and the predicted results (adjusted r2: 0.9772). (b) Visual aspect of the extracts depending on the extraction medium composition. Duplicate of different conditions (v/v/v proportions): D5-E5: 50:50:0.5 isopropanol–water–formic acid; F5-G5: 50:50:0.5 isopropanol–water–trichloroacetic acid; H5-A6: 50:50:0.5 isopropanol–water–trifluoroacetic acid; B6-C6: 90:10:0.01 isopropanol–water–formic acid; D6-E6: 90:10:0.01 isopropanol–water–trichloroacetic acid; F6-G6: 90:10:0.01 isopropanol–water–trifluoroacetic acid; H6-A7: 50:50:0.01 methanol–water–formic acid; B7-C7: 50:50:0.01 methanol–water–trichloroacetic acid; D7-E7: 50:50:0.01 methanol–water–trifluoroacetic acid; F7-G7: 70:30:0.225 methanol–water-formic acid; H7-A8: 90:10:0.5 methanol–water–formic acid; B8-C8: 90:10:0.5 methanol–water–trichloroacetic acid; D8-E8: 90:10:0.5 methanol–water–trifluoroacetic acid. (c) Prediction profile of the screening design results: influence of the four selected factors on the response. Dashed blue lines represent the 95% confidence intervals.
For the qualitative factors, the nature of organic modifier had a significant impact on the intensity of the hepcidin signal (see Figure 3c). As maximization of the hepcidin signal was required in this screening design, isopropanol was chosen for subsequent optimization. Moreover, as shown in Figure 3b, the extracts were cleaner when extracted with isopropanol (wells D5 to G6) than methanol (wells H6 to E8), which means that smaller amounts of blood components were coextracted. It is noteworthy that the isopropanol extraction was also more repeatable than methanol extraction: the variability on methanol extraction is noticeable by the variation of sample color between duplicates on Figure 3b. For the nature of the volatile acid, trifluoroacetic acid provided the highest intensity as shown in Figure 3b.
The influence on the proportion of these selected parameters (for example, isopropanol and trifluoroacetic acid, Figure 3c) in this screening step were therefore studied further in the optimization design.
Optimization Design
Based on the results of the screening design, isopropanol and trifluoroacetic acid proportions in the extraction medium were thoroughly investigated in the interval ranging from 40% to 80%, and 0.1% to 1%, respectively.
A face-centered CCD was applied to optimize the selected factors. This CCD consisted of 10 experiments performed in a random order in duplicate, with a total of four replicates at the central point. A Box-Cox transformation was applied to normalize the results (λ = -0.6). A response surface model was used to modelize the hepcidin area. It included six coefficients (the intercept, β0, the main effects, β1 and β2, the interaction term, β12, and the quadratic terms, β11 and β22) as indicated in the following equation:

where Y is the hepcidin area, X1 is the isopropanol proportion, X2 is the trifluoroacetic acid proportion in the extraction medium, and ε is the error term.
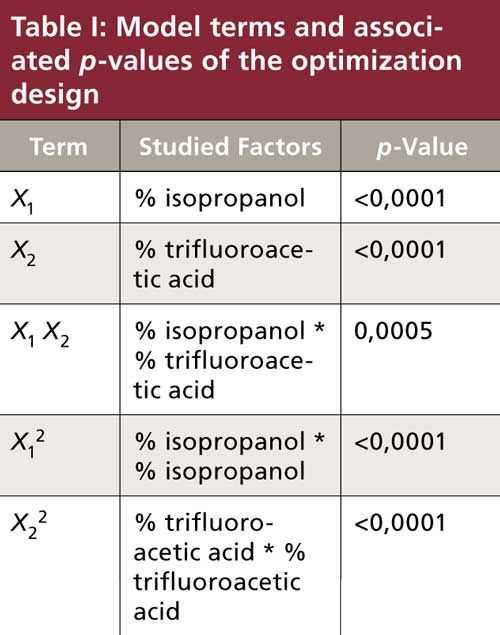
The model adjusted r2 equals 0.9549, indicating that about 95% of the variability is explained by the model. The coefficients of the model and their statistical significance are listed in Table I. The p-value is the probability of getting a result as extreme or more extreme than the one observed if the proposed null hypothesis is correct. Considering the application (analysis of peptides in LC–chip-ESI-MS-MS), a p-value lower than 0.05 was considered significant.
The statistical analysis of the model reveals that peak area is significantly affected by the isopropanol and trifluoroacetic acid proportions. The response surface plot shows (Figure 4b) that increasing the proportion of trifluoroacetic acid in the extraction solvent has a major effect on hepcidin peak area. The plot also shows that a decrease in the isopropanol proportion increases peak area. Visually, variations in the color of the extracts can also be seen in Figure 4b: above 60% isopropanol, extracts are more intensely colored, reflecting a large coextraction of endogenous blood components. The optimal extraction medium composition in terms of hepcidin area is a 40:60:1 (v/v/v) mixture of isopropanol–water–trifluoroacetic acid with satisfactory reproducibility (relative standard deviation [RSD] = 14.6%; n = 4). It is noteworthy that exact values for the limit of detection (LOD), limit of quantitation (LOQ), trueness, accuracy, or precision can only be given after a full validation of the method.
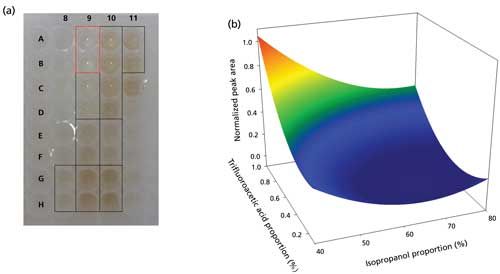
Figure 4: Optimization of the extraction conditions for volumetric absorptive microsampling by experimental design (optimization design). (a) Visual aspect of the extracts depending on the extraction medium composition. Duplicate of different conditions (v/v/v proportions, all with isopropanol–water–trifluoroacetic acid): G8-H8: 40:60:0.1; A9-B9: 40:60:1; C9-D9: 40:60:0.55; E9-F9: 60:40:0.1; G9-H9: 60:40:1; A10-D10: 60:40:0.55; E10-F10: 80:20:0.1; G10-H10: 80:20:1; A11-B11: 80:20:0.55. (b) Response surface plot showing the influence of isopropanol and trifluoroacetic acid proportions on hepcidin peak area after Box-Cox transformation (note: 1 represents the maximal area).
Conclusion
In this study, we developed a simple protocol to extract a peptide, hepcidin, from whole blood. Blood sampling and extraction were performed using VAMS with a disposable device that allows the collection of a defined blood volume from a finger prick. Design of experiments was used to optimize the extraction medium composition to get the highest signal intensity for hepcidin. The results confirmed that the choice of the extraction medium has to be made carefully since the optimal conditions are far from the full methanol extraction that is recommended by the manufacturer as a starting point. A compromise always has to be found between extraction yield of the analyte, and coextraction of matrix components that could cause ion suppression. Compared to classical plasma or serum analysis, the developed protocol is much simpler since it does not require venipuncture, blood centrifugation, sample freezing, or a multistep sample preparation procedure.
References
- S. Tanna and G. Lawson, Bioanalysis7(16), 1963–1966 (2015).
- P. Denniff and N. Spooner, Anal. Chem.86(16), 8489–8495 (2014).
- C. Gauthier, ILAR J. Suppl.43, S99–S104 (2002).
- K. Chapman et al., Drug Discov. Today19(5), 528–532 (2014).
- K-H. Diehl et al., J. Appl. Toxicol. 21(1), 15–23 (2001).
- P.M.M. De Kesel, N. Sadones, S. Capiau, W.E. Lambert, and C.P. Stove, Bioanalysis5(16), 2023–2041 (2013).
- N. Spooner et al., Bioanalysis7(6), 653–659 (2014)
- Y. Mano, K. Kita, and K. Kusano, Bioanalysis 7(15), 1821–1829 (2015).
- P. Denniff, S. Parry, W. Dopson, and N. Spooner, J. Pharm. Biomed. Anal. 108, 61–69 (2015).
- Y. Luo et al, Bioanalysis7(18), 2345–2359 (2015).
- V. Houbart et al., J. Chromatogr. A1218(50), 9046–9054 (2011).
- V. Houbart et al., Bioanalysis7 (21), 2789–2799 (2015).
- S.-R. Pasricha et al., Haematologica96(8), 1099–1105 (2011).
- A. Kali, M.V. Charles, and R.S. Seetharam, Pharmacogn. Rev.9(17), 35–40 (2015).
V. Houbart, G. Cobraiville, G. Nys, A.-C. Servais, and M. Fillet are with the Laboratory for the Analysis of Medicines in the Department of Pharmacy, CIRM, at the University of Liège, Belgium. Direct correspondence to: Marianne.fillet@ulg.ac.be
Regulatory Deadlines and Supply Chain Challenges Take Center Stage in Nitrosamine Discussion
April 10th 2025During an LCGC International peer exchange, Aloka Srinivasan, Mayank Bhanti, and Amber Burch discussed the regulatory deadlines and supply chain challenges that come with nitrosamine analysis.


