Valves for Gas Chromatography, Part III: Fluidic Switching Applications
This month the use of fluidic switching devices for open-tubular column manipulations is discussed.
Previous instalments in this series covered basics of valving and its applications in gas chromatography (GC). This month, we will discuss the use of fluidic switching devices for open-tubular column manipulations, such as heartcutting and comprehensive multidimensional GC×GC.
Open-tubular (capillary) gas chromatography (GC) columns challenge mechanical flow switching valves with requirements for higher speeds and lower volumes. Soon after the initial development of capillary columns, researchers recognized that fluidic flow switching devices were well suited for multidimensional capillary GC applications. David R. Deans (1) was one of the pioneers who published papers and patents on the subject in the late 1960s; the term Deans switch is synonymous with such applications. But practical multidimensional capillary column implementations depend on precise pressure settings and timing intervals, and the mechanical pressure regulators and control systems found in earlier gas chromatographs were not up to the challenges of widespread application. Broader adoption of capillary column multidimensional applications was delayed until the onset of modern solid-state electronics, microprocessor control, and the silicon microelectromechanical systems (MEMS) devices that constitute the pressure and flow components of electronic pressure control systems (EPC) found in modern GC instruments.
Fluidic Switching
Fluidic switching depends on a fundamental characteristic of fluid flow through an enclosed channel: A pressure differential creates directional fluid flow through the channel in the direction of lower pressure. Reversing the pressure differential reverses the direction of flow. The flow channel can be a passageway inside a switching device or it can be an entire chromatographic column. These obvious statements are no revelation to chromatographers but keep them in mind as an aid in understanding what follows.
Rotary valves directly connect to sample loops, columns and detectors for detector selection, column-to-column manipulations, and backflushing, to name a few applications. Earlier instalments in this series (2,3) described how chromatographers configure rotary valves to redirect column output to different detectors or other columns. Implementations with rotary valves are robust and generally simpler to set up and maintain than fluidic switches. However, mechanical actuators have limited switching speeds and are subject to mechanical stress and wear over the long run. Valve rotors have temperature limits to be considered as well. Diaphragm valves, which use pressure to actuate and relieve polymeric seals across the valve ports instead of a rotating valve core, switch faster and have extended lifetimes. Mechanical valves are ideal for packed, micropacked and some wider bore capillary columns, and fluidic switches perform best with narrower capillaries and at higher switching speeds.
The Deans switch originally employed a series of interconnected tees and crosses with control flows driven by electrical solenoids. Modern implementations use more integrated designs that incorporate the minimum number of external unions. Precisely formed internal passageways are allocated to the necessary cross-connections; these also form internal restrictions where desired. These designs have minimum dead volumes and their construction materials present highly inert surfaces to passing solutes. The control pressures are established and modulated over time with electronic pressure control (EPC).
Figure 1 illustrates how a fluidic switching scheme would work for a single incoming flow with two exits. This generic fluidic switch diagram shows a narrow tube into which an incoming flow is directed. The incoming flow (orange line) is directed by the control flows S1 and S2 (green lines) to either outlet 1 or outlet 2, depending on the relative pressures of the control inputs. The two vertical dashed lines labelled T1 and T2 illustrate where the device would be divided if three discrete tee fittings were employed such as in earlier implementations.
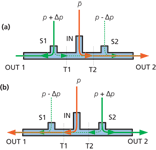
Figure 1
In Figure 1(a), the control pressure applied at S1 is higher than that applied at S2. As a result, flow inside the device at the input stream's central point of entrance runs from left to right and the input stream is directed to outlet 2. When the pressures at the control points are reversed, as in Figure 1(b), then the flow proceeds from right to left, and the input stream is directed to outlet 1.
The input stream, which is most often the carrier gas from a first column, is diluted with a small amount of control gas on its way through the switching device. Careful choice of pressures relative to the columns and restrictions minimizes the amount of dilution and normally does not create any problems with sensitivity or peak resolution — in fact, resolution is improved as the result of better peak shapes. A minimum amount of flow at all times from both of the pressure control inputs prevents back flow and flushes the inner passageways. In contrast, the mechanical switching valve arrangements discussed in earlier instalments (2,3) do not contribute any additional gases to the main carrier streams.
The associated columns and restrictors are not shown in this diagram. The inlet point and each outlet point of the fluidic switch would connect in an application-dependent fashion to a column or restrictor, whose pressure and flow characteristics determine the passage of carrier and control gases through the switching system in concert with the incoming pressure settings.
Implementation
Manufacturers offer a wide variety of fluidic switching configurations that range from a simple backflushing device all the way to comprehensive GC×GC systems. The details of each implementation vary according to the chromatographic requirements and corresponding deployment of each instrument's specific inlets, detectors, and fluidic devices. The rest of this "GC Connections" instalment will address one specific instance of a fluidic switching application: a two-dimensional separation of oxygenates from the polar and nonpolar constituents of gasoline. The presented method and its configuration is just one of many ways in which such separations can be accomplished.
Oxygenated compounds such as methyl-tert-butyl ether (MTBE), ethyl-tert-butyl ether, methanol, and ethanol are routinely added to gasoline formulations to improve combustion characteristics. The quantification of such additives is difficult in the presence of a complex mixture of hydrocarbons such as gasoline: No single GC column will separate the target compounds from all of the matrix constituents. A combination of a nonpolar dimethylsilicone column and a polar tris-cyanoethoxypropane (TCEP) GC column in a heartcut configuration does the job quite well, and such configurations have been routinely applied to packed and micropacked columns.
Capillary columns with higher theoretical plate counts can better resolve such mixtures, given an appropriate configuration such as the fluidic switching arrangement diagrammed in Figure 2. The device is similar to that shown in Figure 1, and the flow paths are designated in the same colours. Figure 2 adds a discrete flow restrictor between the two sides of the device that creates a positive trickle purge flow through the nonselected branch to sweep out any residual materials and prevent back flow.
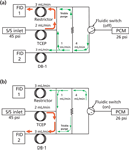
Figure 2
In Figure 2(a) and 2(b), carrier gas flow proceeds forward from a split–splitless inlet at 45 psig through the polar TCEP column. The end of the TCEP column is maintained at 26 psig by the mid-point pressure control module (PCM) flow applied to either side of the device. This amount of pressure drop creates a flow-rate of 2 mL/min at the initial column temperature of 50 °C. The inlets of both the the DB-1 column and a matched restrictor are set to 26 psig by the midpoint pressure, which creates flowrates of 3 mL/min through each.
In Figure 2(a), the fluidic switch two-way solenoid is turned off, which applies the midpoint pressure to the junction of the DB-1 column inlet and the switching device. The portion of the midpoint flow that does not pass into the DB-1 column sweeps past the connection point of the TCEP column end and the fluidic device. The flow mixes with carrier flow and eluted peaks from the TCEP column and proceeds into the restrictor and onward to flame ionization detector 1. In this position, all of the peaks from the TCEP column will pass into the restrictor, and only carrier gas from the midpoint supply will enter the DB-1 column.
In Figure 2(b), the fluidic switch control solenoid has been turned on and the midpoint flow is directed in the opposite direction, to the junction of the fluidic device and the restrictor. This is the heartcut operation. The balance of the midpoint flow sweeps past the exit of the TCEP column and brings carrier gas and eluted peaks into the DB-1 column, until the fluidic control solenoid is turned off again.
Application
To see how the fluidic switch implementation works for oxygenates in gasoline, we need to first look at how the TCEP column retains nonpolar petroleum compounds and polar oxygenates. Figure 3(a) is a portion of the chromatogram obtained by injecting a solution of MTBE in iso-octane with the fluidic switch remaining in the off position throughout the run: the MTBE is eluted in 5.54 min. Having scouted out the retention time of MTBE, the next step is to activate the fluidic switch a moment before MTBE and deactivate it afterwards. Figure 3(b) is the chromatogram of the TCEP column when the fluidic switch is on from 5.48 to 5.76 min after injection; the MTBE peak has disappeared. Figure 3(c) is the chromatogram from the DB-1 column simultaneous with the TCEP chromatogram of Figure 3(b); the MTBE peak is eluted at 7.18 min or 1.64 min after it entered the DB-1 column.
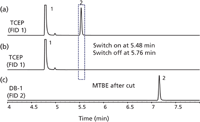
Figure 3
The result of applying this heartcut timing to a sample of gasoline with MTBE is illustrated in Figure 4. Figure 4(a) shows the TCEP chromatogram. There is a gap where the heartcut is taken. Figure 4(b) shows the MTBE peak at 7.18 min, followed by a small cluster of hydrocarbon peaks that accompanied the MTBE as it left the TCEP column and entered the DB-1 column during the heartcut. All of these hydrocarbons are eluted after MTBE, which is more volatile.
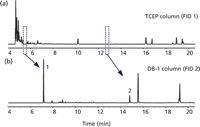
Figure 4
Figure 4 also illustrates the ease of performing multiple heartcuts in a single run. An internal standard of 1,2-dimethoxyethane (DME) has been used to improve accuracy and repeatability with the very low injection volume of 0.1 μL. DME is eluted well after MTBE from the TCEP column, at about 13.4 min, and a second heartcut is performed around the DME peak at 13.26–13.55 min. The DME peak then appears in the DB-1 chromatogram at 14.8 min.
The same configuration can be applied to the other oxygenates by modifying the heartcutting times or by adding new heartcuts. It is also possible to pull out benzene, toluene, ethylbenzene and xylenes (BTEX) with appropriate heartcut times.
Finally, the fluidic switch can be used in conjunction with a pressure-programmable inlet to backflush the TCEP column after the last peak has been eluted from the DB-1 column. The TCEP column is very polar and in the absence of backflusing has to be held at the upper column temperature level for 50 min before all of the remaining gasoline peaks are eluted. Instead, as shown in Figure 5, the midpoint pressure can be raised while the TCEP column inlet pressure is dropped close to zero. This has the effect of reversing the flow through the TCEP column. Instead of a 50 min hold time, a 20 min time or less suffices to remove the remaining peaks, which exit the TCEP column into the splitter and are vented through the split vent. The backflush operation cuts the total analysis time by 30 min or almost 50%.
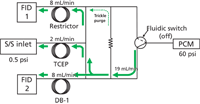
Figure 5
Conclusion
Fluidic switching devices for capillary GC columns have come a long way since their inception more than 40 years ago. With modern electronic instrument controls and precisely machined fluidic components the application of fluidics to capillary column heartcutting and backflushing has become much less difficult to use in routine laboratory operations. Like their better known mechanically valved counterparts for packed and micropacked columns, fluidic switching systems are another powerful tool available to chromatographers.
"GC Connetions" editor John V. Hinshaw is senior research scientist at BPL Global Ltd, Hillsboro, Oregon, USA and a member of LCGC Europe's editorial advisory board. Direct correspondence about this column should go to LCGC Europe editor, Alasdair Matheson, 4A Bridgegate Pavilion, Chester Business Park, Wrexham Road, Chester, CH4 9QH, UK or e-mail: amatheson@advanstar.com
References
(1) D.R. Deans, Chromatographia, 1, 18–22 (1968).
(2) J.V. Hinshaw, LCGC N. Amer., 29(3), 246–251 (2011).
(3) J.V. Hinshaw, LCGC N. Amer., 29(7), 576–582 (2011).
Investigating the Protective Effects of Frankincense Oil on Wound Healing with GC–MS
April 2nd 2025Frankincense essential oil is known for its anti-inflammatory, antioxidant, and therapeutic properties. A recent study investigated the protective effects of the oil in an excision wound model in rats, focusing on oxidative stress reduction, inflammatory cytokine modulation, and caspase-3 regulation; chemical composition of the oil was analyzed using gas chromatography–mass spectrometry (GC–MS).
Evaluating Natural Preservatives for Meat Products with Gas and Liquid Chromatography
April 1st 2025A study in Food Science & Nutrition evaluated the antioxidant and preservative effects of Epilobium angustifolium extract on beef burgers, finding that the extract influenced physicochemical properties, color stability, and lipid oxidation, with higher concentrations showing a prooxidant effect.
Rethinking Chromatography Workflows with AI and Machine Learning
April 1st 2025Interest in applying artificial intelligence (AI) and machine learning (ML) to chromatography is greater than ever. In this article, we discuss data-related barriers to accomplishing this goal and how rethinking chromatography data systems can overcome them.


