Using Headspace Gas Chromatography for the Measurement of Water in Sugar and Sugar-Free Sweeteners and Products
Special Issues
An automated method for determination of water in liquid sweeteners was developed utilizing headspace gas chromatography (GC) and ionic liquid-based capillary GC columns. This method allowed for the rapid determination of water with minimal sample pretreatment. In addition to providing fast analysis time for the samples, the headspace GC method was found to be accurate and precise for the measurement of water in 16 liquid sweeteners. This method was shown to be widely applicable for sugar and sugarless based sweeteners and likely, more accurate than Karl Fischer titration.
An automated method for determination of water in liquid sweeteners was developed using headspace gas chromatography (GC) and ionic liquid-based capillary GC columns. This method allowed for the rapid determination of water with minimal sample pretreatment. In addition to providing fast analysis time for the samples, the headspace GC method was found to be accurate and precise for the measurement of water in 16 liquid sweeteners. This method was shown to be widely applicable for sugar and sugar-free sweeteners and more accurate than Karl Fischer titration.
Historically, honey was the primary sweetener used to enhance many foods; however, with advances in technology, sweeteners with high concentrations of fructose or sucrose are now used (1,2). In syrup-form, they provide an economical, easy-to-handle alternative to honey (2). Sweeteners can now be found in most foods, including carbonated beverages, canned goods, jellies, jams, baked goods, and dairy products, and in many pharmaceutical products (1–3). These additives improve the humectancy, color, and flavor of food (1). Sweeteners are found in many foods, and their compositions are monitored and regulated (4,5). One important component, water, must be regulated because it affects both the physical characteristic of the product and consumer safety (1,5). The water content directly affects the viscosity of syrups and sweeteners. When the water content in syrup is low, the sugar may precipitate and the ability to easily handle the product as well as consumer satisfaction will be compromised (6).
In addition to human consumption, many syrups (such as molasses and corn syrup) are used as additives in animal feed (2,4,5). The water content is monitored, and if the level exceeds the regulated range, both mold and other microbial growth can occur (4–6). This can lead to significant problems because of the toxic nature of some molds, spores, and their by-products (7–10).
Consumption of the mold and spores leads to a reduction of feed intake, which can cause weakness, weight loss, and decreased production in dairy cattle (7). Furthermore, spores and mold can cause many diseases along with their related symptoms of vomiting, diarrhea, skin lesions, kidney and liver damage, lack of muscle control, and nervous system disorders (7–10). Other effects are an increase in infertility and abortions among exposed cattle (7–10). Mold is known to cause respiratory distress, coughing, and shortness of breath in both humans and livestock (7–10). Consequently, the measurement of water in many products is often required by regulatory bodies worldwide.
Water content traditionally is measured by refractive index and reported in degrees Brix or by percent by weight of sucrose in water (5,6,11,12). Degrees Brix is used because it is a fast and easy way to measure the moisture in sucrose-based sweeteners (5,11). While it is fast, many sweeteners are fructose based or have a combination of sucrose and other sugars causing it to be inaccurate; therefore, the Brix measurement is actually an “apparent Brix” (5,11). In addition to sugars other than sucrose, salts are known to cause an apparent change in the water content (5,11). When salt is present, the measured degrees Brix can indicate 5–10% less water than is actually contained in the sample (5). Headspace gas chromatography (GC) is another method that has been used for the determination of water in select foods, solvents, and active pharmaceutical ingredients (12–16). Early on, the amount of water in food was measured by the formation of a suspension in methyl glycol and then multiple headspace extractions were used (12). One problem that occurred with this early GC method was that the various supports (for example, diatomaceous earth and molecular sieves) in packed columns led to a nonideal absorption of water; therefore these columns produced broad tailing peaks with poor peak area reproducibility (17–20). In addition, these packed columns tended to have low selectivity and resolution between water and many other common solvents (15–18). In addition, air, water, and some solvents can degrade common liquid stationary phases at the elevated temperatures required for the analyses (14). New GC stationary phases composed of ionic liquids (IL) have been developed that allow GC to be used for the analysis of water (13–16,21–23). The ILs with trifluoromethylsulfonate (TfO-) anions improve the water’s peak shape and peak area reproducibility lowering the limit of detection (14,21–23). Further, these stationary phases are unchanged when exposed long term to water- and oxygen-containing samples.
In this work, we report a simple, effective, and accurate method for the determination of water content in fructose-, sucrose-, and sucralose-based syrups. This method, unlike previous methods, is not affected by the sugar composition, the presence of solid particles in the sample, or the presence of salts. Also, the method does not entail multiple headspace extractions, additional solvents, or standards as in some of the previous headspace GC methods. This effective approach is easily automated and is made possible by the advent of advanced IL stationary phases for GC coupled with a specific GC system configured for water analysis and containing devices for the stringent reduction of ambient moisture.
Method
Materials
Fructose was obtained from Sigma Aldrich. Blue agave nectar was purchased from C&H Sugar. Grandma’s Molasses was obtained from B&G foods. Karo Light corn syrup was obtained from ACH Food Companies, Inc. Pancake syrup was purchased from Safeway. Hershey’s chocolate syrup and caramel topping were purchased from Hersheys Company. The Nesquik chocolate syrup and strawberry syrup were obtained from Nestle. Strawberry jelly and jam were obtained from Smucker’s. Mrs. Butterworth’s original syrup and Mrs. Butterworth’s sugar-free syrup were from Mrs. Butterworth’s. Coffee creamer was from Kahala Franchising, L.L.C. Sugar Free Butter Flavored Syrup was obtained from Maple Grove Farms. Rose’s Grenadine syrup was purchased from Mott’s LLP. Dimethyl sulfoxide (DMSO) was purchased from Sigma Aldrich.
Screw-thread vials (22 x 75 mm) and magnetic screw-thread covers for the autosampler were purchased from Restek. The GC columns were 30 m x 0.25 mm, 0.20-μm df Watercol 1460 and Watercol 1900 columns along with a 60 m x 0.25 mm, 0.20-µm df Watercol 1910 column and were obtained from Sigma Aldrich.
Sample Preparation
Samples with <40% water were prepared by adding 500 mg of sample to a clean vial using a pipette. Samples that contained >40% water were prepared by adding 0.125 g of sample and 0.375 g of DMSO to a clean vial. After the sample was prepared it was immediately capped. The vial was pressurized to 200 kPa for 2 min at room temperature using a Shimadzu HS-20 headspace autosampler. The headspace was then loaded or extracted for 1 min. After the purging process was complete the vial was heated for 5 min at 100 °C. The sample was pressurized to 100 kPa and the headspace vapor was loaded for 2 min into a 0.2-mL sample loop. A 0.5-min injection was then made into the GC system. Two external calibration curves were produced: one for the lower water content (<40% water) and a second calibration curve for samples with higher water content (>40%). The first was used for samples with lower water content, by combining 0.4, 0.5, 0.6, and 0.8 g of water with 2.6, 2.0, 1.9, and 1.8 g of fructose, respectively. Samples were made in quadruplicate by adding successive 500-mg aliquots of sample to clean vials. Then the vials were purged, heated, and analyzed the same as the samples. The second calibration curve for higher water contents was produced by making samples with 5%, 10%, 15%, 20%, and 25% water in a DMSO matrix. This was achieved by combining 0.125, 0.250, 0.375, 0.500, and 0.625 g of water with 2.375, 2.250, 2.125, 2.000, and 1.875 g of DMSO, respectively. The solutions were then divided into 500-mg aliquots and treated in the same manner as the samples.
Loss on drying was measured by weighing four clean empty vials. A sample, ~500 mg, was added to each vial and the new mass was recorded. Samples were heated for 12 h at 60 °C and then cooled and weighted. A second 12-h evaporation step was performed at 60 °C. The process was repeated until a constant mass was obtained.
The Karl Fischer titration (KFT) analyses were performed by Robertson Microlit Laboratories. The atmospheric moisture was measured by adding 3–10 mg of sulfosalicylic acid dehydrate to the Hydranal Coulomat AG in the titration cell. The standard was titrated coulometrically to the electrometic endpoint and used to determine the response of residual moisture. The sample, 10 mg, was then added to the titration cell and titrated. The atmospheric moisture was subtracted for the reported value to obtain the moisture in the sweetener sample.
Apparatus and Conditions
The analyses were performed using a Tracera 2010 equipped with barrier discharge ionization detection (BID) and thermal conductivity detection (TCD) (Shimadzu Scientific Instruments). Labsolutions 5.82 software was used for all peak integration. A Shimadzu HS-20 headspace autosampler was used to purge, heat, and inject all samples. The transfer line and sample line were kept at 170 °C. The oven in the autosampler was kept at room temperature (25 °C) when purging the vials and at 100 °C for all analyses. A 60 m x 0.25 mm, 0.2-µm df Watercol 1910 fused-silica capillary column coated with IL synthesized as previously reported or commercially acquired from Supelco/Sigma-Aldrich (22). The GC system oven temperature was held isothermally at 170 °C with a run time of 5 min. The carrier gas for all runs was helium at a flow rate of 1.5 mL/min (26 cm/s). The helium was dried with a high-capacity gas purifier and an OMI purifier tube (Supelco). The injection port was set at 280 °C and the TCD system was set at 200 °C with a current of 80 mA. A split ratio of 100:1 was used for all analyses of the sweeteners. Selected analyses were performed using a 6890N gas chromatograph with TCD (Agilent Technologies Inc.) and Chemstation plus software (Rev.B.01.03). A 1-mL gastight syringe (Hamilton) was used for all injections.
Results and Discussion
Optimization of Separation
The GC oven temperature, split ratio, and GC column were evaluated, and the optimized conditions are specified in the “Experimental” section. It was determined that a temperature of 170 °C and a split ratio of 100:1 were optimal for these analyses. The Watercol 1910 GC column gave the best peak symmetry for water compared to the Watercol 1460 and Watercol 1900 columns (see “Experimental” section). The Watercol 1900 column gave the lowest retention time, but the peak shape was slightly less symmetrical than that obtained using the Watercol 1910 column. The improved peak shape of the water when analyzed on the Watercol 1910 column in turn, provided more precise water determinations (vide infra). It was found that the water concentrations were not in the linear range of the sensitive BID, but they were well within the linear range of TCD. One of the virtues of a GC system specifically configured for water analysis is that it has both of these detectors and therefore the flexibility to handle samples containing trace levels to higher levels of water. In the case of these 16 sweeteners, the higher water content in the samples allowed TCD to give a response 4x10⁴–8x10⁴ times higher than the blank.
Optimization of Headspace Conditions
The headspace analysis of samples for water requires the optimization of a few parameters. These include the purging conditions, sample loop size, and the length of time the sealed samples are heated (equilibrium time). It should be noted that the headspace autosampler used in this study has a unique configuration that is advantageous for water analysis (16). The equilibrium temperature was set at 100 °C to reduce side reactions (such as the Maillard reaction), which produce water as a by-product. The equilibrium time was also optimized as seen in Figure 1. The sample required 5 min at 100 °C to reach equilibrium. Various sample purge conditions were evaluated using the autosampler. For example, the vials were pressurized in a range of 25–200 kPa and the headspace was then removed for 6–120 s. It was found that a using a pressure of 200 kPa and then extracting 30 s of headspace was optimal and provided the lowest residual moisture in the vials. Two different sample loop sizes, 0.2 and 1.0 mL, were compared. When the larger sample loop was used with samples that contained high water amounts, the GC column was overloaded, and the peaks were asymmetrical because of increased tailing.

Figure 1: The amount of water in the headspace of sealed samples at 100 ºC was evaluated every 5 min for 20 min. It can be seen that the maximum response is at
5 min and after that point the response plateaus.
Quantitative Analysis of Residual Water in Samples
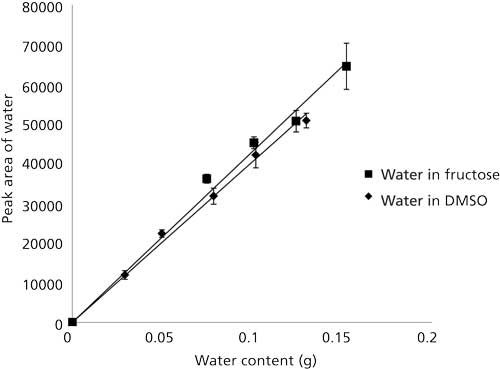
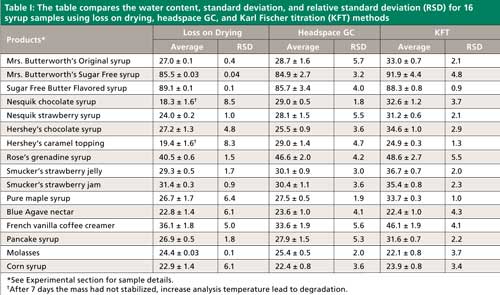
Two calibration curves for water were developed in order to quantify its content in 115 syrup samples (see “Experimental” section). Figure 2 illustrates the linear relationship between the peak area and the percent water for different concentrations of water in fructose. The correlation (r2) was found to be 0.99. A second calibration curve produced in DMSO was also found to have a correlation of 0.99. The water in 16 syrups and sweeteners was analyzed and the percent water therein is presented in Table I (they ranged from ~20% to 90%). The water content was also analyzed with the loss on drying method, which gave comparable values but required much longer analysis times (Table I) and by KFT.

Figure 2: Plots of the linear relationship between TCD response and the water content in fructose–water solutions and DMSO–water solutions. Both had a correlation of 0.99. The equation for the line produced by the fructose–water solutions is y = 429,000x and the equation of the line produced by the DMSO–water solutions is y = 403,000x.

CLICK TABLE TO ENLARGE
IF TABLE IS STILL TOO SMALL, CLICK ONCE MORE AND IT WILL ENLARGE FURTHER
Precision
The precision of the headspace GC method was evaluated by analyzing all of the samples in quadruplicate. The relative standard deviation (RSD) for loss on drying, headspace GC and KFT methods were similar in most cases. When the average precision of the headspace GC method was compared to the average RSD produced by loss on drying, there were a few values with more than 8% RSD for the latter approach (that is, Nesquik chocolate syrup and Hershey’s caramel topping). It should be noted that while loss on drying usually produced similar RSDs, the procedure took 4–7 days to complete whereas the headspace GC method took 10 min. As has been noted previously, KFT often provides good precision while producing inaccurate results (16). This tendency will be discussed in the next section.
Accuracy
The National Institute of Standards and Technology (NIST) does not currently provide standard reference materials for moisture in sugar solutions; therefore, accuracy of the headspace GC method was estimated by comparing it to results obtained by two other methods, KFT and loss on drying. The three methods gave similar results, but it was determined that KFT often appeared to overestimate the water content compared to the other two methods. When KFT and headspace GC were compared with a T-test it was found that they were only similar in the case of five samples, and KFT was similar to three of the loss on drying samples. When loss on drying and headspace GC were compared, it was found that most of the samples were similar. When the french vanilla coffee creamer was analyzed with headspace GC and loss on drying, a similar result of ~30% water was found. In contrast, KFT gave a significantly higher water content (46% water). On average, KFT yielded ~5% higher water contents than the other two methods. It appears likely that the KFT reagent reacted with some of the nonaqueous components or constituents of many of the samples. Results with high bias have been previously noted for KFT for samples that contain large amounts of sugar (24). Loss on drying usually had the lowest measured water content of the three methods; however, it has been known to underestimate water when the viscosity of the sample increased substantially after heating, which, in turn, decreases the diffusion rate of water (25). This effect would also apply to a few of the samples (that is, Nesquik chocolate syrup and Hershey’s caramel topping), which still had small decreases in mass after being heated for seven days. In addition, when the incubation temperature was further increased for a few hours it led to sample degradation. Since the mass did not completely stabilize it can be assumed that there was still some moisture present.
Instrumental Variations
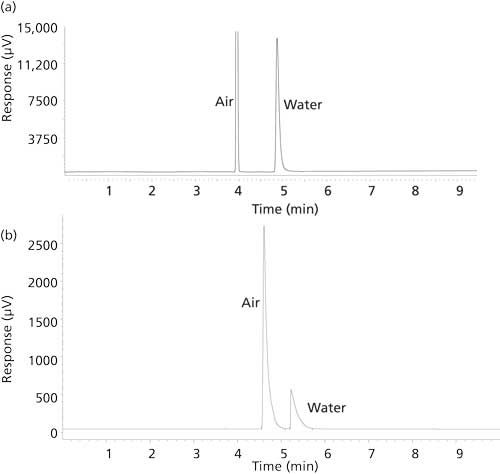
The effect of different instrumentation can affect the GC conditions used as well as peak shape, split ratios, and resolution. This is particularly true when comparing new state of the art instruments with analogous types that are 10 or more years old. It was found that the older TCD system had poorer sensitivity and therefore required a lower split ratio, 5:1. As shown in Figure 3, the decrease in split ratio caused the water peak to lose symmetry via increased tailing. The lower split ratio also led to broader peaks and therefore a lower resolution between the air and water peaks. In addition, when samples were analyzed with the older, less sensitive TCD systems, the analysis temperature had to be kept slightly lower, 150 °C versus 170 °C, to allow for baseline separation between the water and air because of peak broadening and increased tailing.

Figure 3: Typical chromatograms obtained for the analysis of water in agave nectar
(a) when analyzed with the Shimadzu Tracera 2010 TCD system at 170 °C with a split ratio of 100:1 on a 60-m Watercol 1910 column, and (b) using an older, less sensitive TCD system at 150 °C and a split ratio of 5:1 on a 60 m Watercol 1910 column.
Conclusions
The water content of 16 liquid sweeteners were determined using headspace GC. This method was rapid, accurate, and precise. It was shown to be broadly applicable to a variety of sugar and sugarless sweeteners. The method does not require long heating periods (4–7 days) in an oven as with the loss on drying method, so the water content can be rapidly determined in the syrups. KFT was shown to overestimate the water content in most of the samples. The ease, accuracy, and robustness of the headspace GC analyses are greatly enhanced when using an ionic liquid-based column and a GC instrument that is specifically designed and configured for the analysis of water.
Acknowledgments
This work was also supported by the Robert A. Welch Foundation (Y0026). We would like to thank Shimadzu Scientific Instruments for the use of the Tracera 2010 GC.
References
- L.M. Hanover and J.S. White, Am. J. Clin. Nutr.58, 724S–32S (1993).
- J.S. White, Am. J. Clin. Nutr.88, 1716S–21S (2008).
- J. Chirfe, C.F. Fontan, and S. Vigo, J. Agric. Food Chem. 29, 1085–1086 (1981).
- P. Heinze and H.D. Isengard, Food Chem. 12, 483–86 (2001).
- L.R. Richardson and J.V. Halick, “Bulletin 754,” Texas Agricultural Experiment Station: College Station, Texas (1952).
- D.W. Ball, J. Chem. Edu. 84, 1647–1650 (2007).
- R.S. Applebaum, R.E. Brackett, D.W. Wiseman, and E.H. Marth, J. Food Protect. 45, 725–777 (1982).
- J. Fink-Gremmels, Vet. J.176, 84–92 (2008).
- J. Pleadin, M. Zadravec, N. Perši, A. VuliÄ, V. Jake, and M. Mitak, Mycotoxin Res.28, 157–162 (2012).
- A.M. Shareef, Iraqi J. Vet. Sci.24, 17–25 (2010).
- R.H. King, Ind. Eng. Chem., Anal. Ed.3, 230–232 (1931).
- B. Kolb and M. Auer, Fresen. J. Anal. Chem.336, 297–302 (1990).
- L.A. Frink and D.W. Armstrong, Food Chem.205, 23–27 (2016).
- D.A. Jayawardhana, R.M. Woods, Y. Zhang, C. Wang, and D.W. Armstrong, LCGC Eur.24, 516–529 (2011).
- L.A. Frink, C.A. Weatherly, and D.W. Armstrong, J. Pharm. Biomed. Anal.94, 111–117 (2014).
- L.A. Frink and D.W. Armstrong, J. Pharm. Sci.105, 2288–2292 (2016).
- H.S. Knight and F.T. Weiss, Anal. Chem.34, 749–751 (1962).
- W.K. O’Keefe, F.T.T. Ng, and G.L. Rempel, J. Chromatogr. A1182, 113–118 (2008).
- H.G. Streim, E.A. Boyce, and J.R. Smith, Anal. Chem. 33, 85–89 (1961).
- E.R. Quiram, Anal. Chem. 35, 593–595 (1963).
- D.W. Armstrong, T. Payagala, and L.M. Sidisky, LCGC North Am. 27, 596–605 (2007).
- K. Huang, X. Han, X. Zhang, and D.W. Armstrong, Anal. Bioanal. Chem. 389, 2265–2275 (2007).
- C.A. Weatherly, R.M. Woods, and D.W. Armstrong, J. Agri. Food Chem. 62, 1832–1838 (2014).
- P. Bruttel and R. Schlink, “Water Determination by Karl Fischer Titration,” Metrohm Monograph 4-1 (2003).
- H.-D. Isengard, D. Schultheiß, B. Radovic´, and E. Anklam, Food Control12(7), 459–466 (2001).
Lillian A. Frink and Daniel W. Armstrong are with the Department of Chemistry and Biochemistry at the University of Texas at Arlington, in Arlington, Texas. Direct correspondence to: sec4dwa@uta.edu

Analytical Challenges in Measuring Migration from Food Contact Materials
November 2nd 2015Food contact materials contain low molecular weight additives and processing aids which can migrate into foods leading to trace levels of contamination. Food safety is ensured through regulations, comprising compositional controls and migration limits, which present a significant analytical challenge to the food industry to ensure compliance and demonstrate due diligence. Of the various analytical approaches, LC-MS/MS has proved to be an essential tool in monitoring migration of target compounds into foods, and more sophisticated approaches such as LC-high resolution MS (Orbitrap) are being increasingly used for untargeted analysis to monitor non-intentionally added substances. This podcast will provide an overview to this area, illustrated with various applications showing current approaches being employed.


