UHPLC, Part II: Benefits
LCGC North America
UHPLC’s benefits include fast analysis, high-resolution separations, reduced solvent and sample usage, enhanced sensitivity and precision, and more.
This installment in our series on ultrahigh-pressure liquid chromatography (UHPLC) highlights its benefits in fast analysis, high-resolution separations, high performance liquid chromatography (HPLC) method development, reduced solvent and sample usage, and enhanced sensitivity and precision performance.
Today, ultrahigh-pressure liquid chromatography (UHPLC) has become the modern high performance liquid chromatography (HPLC) platform, a little more than a decade after the introduction of the first commercial UHPLC system in 2004 (1,2). The second entry of this three-part series on UHPLC describes its benefits in high-speed and high-resolution analyses, using several illustrative examples of separations of small-molecule drugs. Additional benefits of UHPLC are highlighted: It provides more flexibility to customize resolution, expedites the development of critical stability-indicating methods, provides a “greener” HPLC platform, and delivers higher precision and sensitivity. These benefits are categorized into four groups.
1. Very fast separations with good resolution
2. High-resolution separations of complex samples
3. Rapid development of stability-indicating HPLC methods
4. Other benefits, including
- Flexibility to customize resolution by using columns of different lengths
- A “greener” HPLC platform, reducing solvent and sample usage
- Higher sensitivity and precision performance.
Very Fast Separations with Good Resolution
Fast separation with good resolution is the primary driver for purchasing UHPLC equipment, affording increased laboratory sample throughput (1–4). Although this benefit stems from the increased efficiency per unit length and higher optimum linear velocities of columns packed with sub-2-µm or sub-3-µm particles, it is also the low-dispersion UHPLC instruments with higher pressure ratings that allow for the performance gains (5,6).
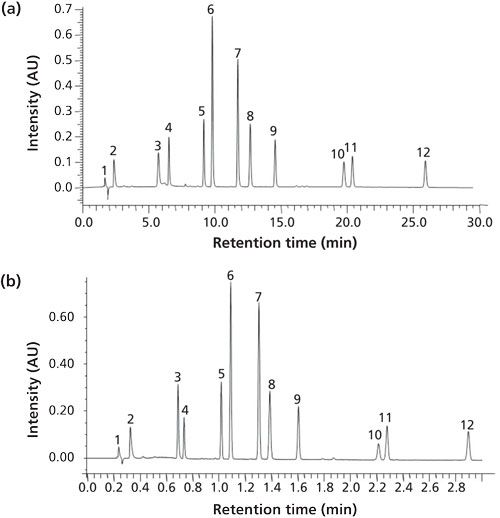
This benefit is illustrated in a method conversion case study using geometric scaling for a 12-component drug mixture, as shown in Figure 1 (7). Figures 1a and 1b show separations obtained on a “standard” conventional HPLC column (150 mm x 4.6 mm, 5 µm), with a run time of 45 min, and a typical UHPLC column (50 mm x 2.1 mm, 1.7 µm), with a run time of 5 min. The ratio of column length to particle size (L/dp) was kept the same because both columns had an identical theoretical plate count of N = 12,000. Gradient time (tG) was scaled to column length, while injection volume was scaled to the column void volume, VM. The flow rate, scaled to the square of the column inner diameter is 0.2 mL/min for a 2.1-mm i.d. column; though, in this case, a faster flow rate of 0.61 mL/min was used so as to work in the optimized velocity region on the van Deemter curve. This approach resulted in a separation that was nine times faster, while providing similar resolution and sensitivity (peak height).
Figure 1: A case study illustrating method conversion from (a) HPLC to (b) UHPLC conditions using geometrical scaling at optimum flow velocity for a UHPLC column packed with 1.7-µm particles. Figure 1b illustrates the ability of UHPLC for fast analysis with good resolution with a significant reduction of analysis time by up to ninefold. Operating conditions: (a) column: 150 mm x 4.6 mm, 5-µm XBridge C18; F = 1 mL/min; Vinj = 20 µL; run time: 45 min; (b) column: 50 mm x 2.1 mm, 1.7-µm C18; Fopt = 0.61 mL/min (Fscaled = 0.2 mL/min); Vinj = 1.4 µL; run time: 5.1 min. Adapted with permission from reference 7.
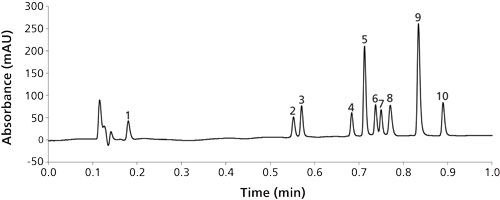
Although ultrafast UHPLC separations are readily amenable for small molecules, peptides and small proteins can also be analyzed, as illustrated in Figure 2, which shows a sub-1-min separation of 10 peptide–protein standards under high-throughput screening (HTS) conditions. A 50 mm x 2.1 mm column packed with 2.7-µm dp, 160-Å pore size superficially porous particles (SPP) under a high linear velocity (flow rate, F, =1.05 mL/min) and ballistic gradient conditions (tG = 1 min) was used in this example.
Figure 2: Fast separation of peptides and small proteins using a short column packed with wide-pore SPP under high-throughput screening conditions. Column: 50 mm x 2.1 mm, 2.7-µm HALO Peptide ES-C18; mobile-phase A: water–0.1% trifluoroacetic acid; mobile-phase B: 80:20 acetonitrile–water–0.1% trifluoroacetic acid; gradient: hold at 12.5% B until 0.15 min; 12.5–88% B from 0.15 to 1.15 min; F = 1.05 mL/min; temperature: 60 °C; pressure: 213 bar; detection: UV absorbance at 215 nm; injection volume: 1 µL. Peaks: 1 = Gly-Tyr, 2 = Val-Tyr-Val, 3 = angiotensin 1/2 (1-7) amide, 4 = Met-enk, 5 = angiotensin 1/2 (1-8) amide, 6 = angiotensin II, 7 = Leu-enk, 8 = ribonuclease A, 9 = angiotensin (1-12) (mouse), 10 = porcine insulin. Chromatogram courtesy of MacMod Analytical.
High-Resolution Analysis of Complex Samples
High-resolution UHPLC analysis (peak capacity, Pc = 400–1000) for improved analysis of complex samples has been reviewed (2,8–10). Also, case studies on the pharmaceutical analysis of drug molecules with multiple stereogenic centers and drug products from multiple active pharmaceutical ingredients (APIs) have been reported (10). Figure 3 shows a UHPLC chromatogram of a retention marker solution, consisting of four APIs (elvitegravir, cobicistat, emtricitabine, and tenofovir disoproxil fumarate) spiked with impurities and degradation products. This system suitability test solution was carried out on a 150-mm column packed with sub-2-µm polar-embedded bonded phase particles as part of a drug product stability-indicating UHPLC method for the release testing of Stribild oral tablets, an antiviral drug. The method has been fully validated and the method validation data summary can be found in the same paper (10).
Figure 3: Chromatogram of a stability-indicating UHPLC method for a drug product Stribild oral tablet with four APIs (elvitegravir, cobicistat, emtricitabine, and tenofovir disoproxil fumarate). Column: 150 mm x 2.1 mm, 1.7 µm Acquity BEH Shield RP18; mobile-phase A: pH 6.2 buffer; mobile-phase B: acetonitrile; gradient: a five-segment gradient program; F: 0.34 mL/min at 30 °C; detection: UV absorbance at 240 nm; sample: a retention marker solution containing four APIs spiked with key impurities and degradation products. Adapted with permission from reference 10.
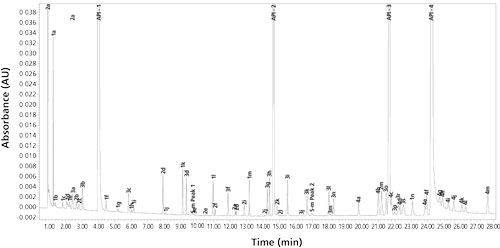
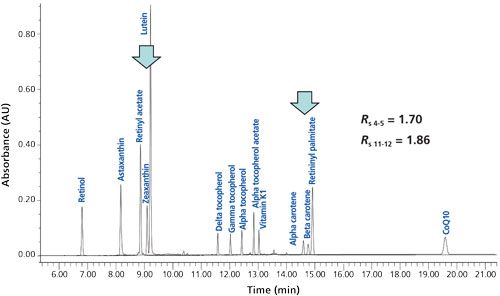
Figure 4 shows a high-resolution UHPLC chromatogram of 14 lipophilic carotenoids, all eluted in 20 min, including the separation of several isomers or closely related compounds (peaks 4 and 5 and peaks 11 and 12, indicated by arrows). The strategy of using longer columns packed with small particles appears to be an effective platform methodology for the routine analysis of complex samples-an unmet capability when using conventional HPLC.
Figure 4: Chromatogram showing high-resolution UHPLC analysis of 14 carotenoids including difficult-to-resolve isomers and related compounds. Column: 150 mm x 2.1 mm, 1.7-µm Acquity BEH C18; gradient: 50–100% acetonitrile in 12 min then 100% acetonitrile for 10 min; F = 0.6 mL/min at 60 °C.
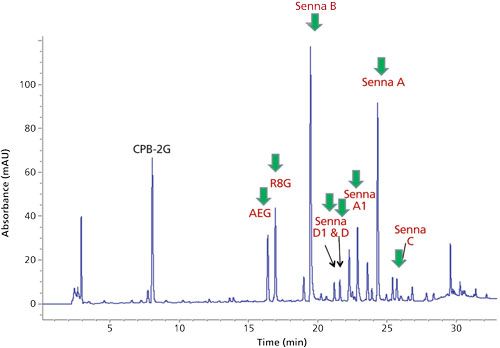
Figures 5 and 6 are chromatograms of an oral over-the-counter (OTC) laxative tablet containing a natural product extract (senna), using HPLC and UHPLC methods, respectively. The APIs of this drug product consist of at least eight active components in a United States Pharmacopeia (USP) fluorescence assay. The potency assay values of the drug product determined by the HPLC method were derived by the summation of all eight constituents (11). The original HPLC method yields the chromatogram depicted in Figure 5, showing reasonably good resolution of all eight APIs from interferences, using a column packed with 3-µm particles (N = 20,000). Nevertheless, the method transfer process of this newly developed HPLC method to the manufacturing plant could not begin because of objections by the quality control (QC) manager, who cited concerns regarding method robustness in routine testing due to the poor resolution of senna D and D1. Using typical selectivity-tuning strategies (varying tG, the mobile phase, and gradient conditions), efforts to further improve the resolution of all APIs using this HPLC method were unsuccessful because of the complexity of the extract. Several years later, with the advent of UHPLC, a high-resolution 50-min separation was quickly developed on a 300-mm-long column packed with 1.7-µm particles (N = 80,000). As shown in Figure 6, all eight APIs were well resolved, providing a more accurate and robust potency assay of this very complex drug product.
Figure 5: HPLC chromatogram of a complex drug product derived from a natural material (senna). The eight constituents marked with arrows are primary ingredients including sennosides A and B (structures shown), which are summed to yield potency assay values of the drug product. Column: 150 mm x 2.1 mm, 3-µm Prodigy C18; mobile-phase A: 20 mM ammonium formate, pH 3.75; mobile-phase B: acetonitrile; gradient: 5–15% B in 15 min, 15–85% B in 10 min; F = 0.5 mL/min; temperature: 50 °C; pressure: 280 bar; detection: UV absorbance at 270 nm; sample: 5 µL of tablet extract; run time: 34 min.
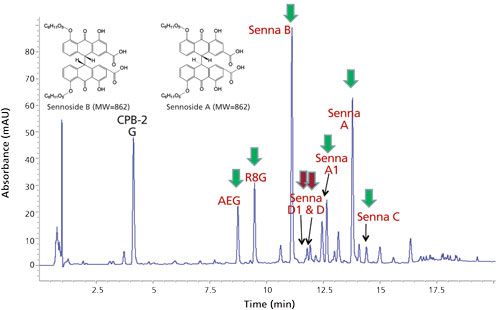
Figure 6: UHPLC high-resolution chromatogram of the same complex drug product derived from senna shown in Figure 5 using a 300-mm column packed with 1.7-µm particles with N = 82,000 plates. Column: 300 mm x 2.1 mm, 1.7-µm Acquity BEH130 C18; mobile-phase A: 20 mM ammonium formate, pH 3.75; mobile-phase B: acetonitrile; gradient: 5–15% B in 25 min, 15–85% B in 10 min; flow rate: 0.3 mL/min; temperature: 40 °C; pressure: 800 bar; detection: UV absorbance at 270 nm; sample: 5 µL of tablet extract; run time: 50 min.
Overall, UHPLC with increased peak capacity in the 400–1000 range provides a more satisfactory solution for the separation of complex samples. It is particularly useful in bioanalytical research for the analysis of endogenous samples and characterization of cell extracts, using a single column or a two-dimensional (2D)-LC platform (4,8,9).
Facilitating Rapid Development of Stability-Indicating HPLC Methods
The HPLC method development process for critical assays (that is, stability-indicating analysis of pharmaceuticals) typically involves an initial column and mobile-phase screening, followed by fine-tuning of the operating conditions (selectivity tuning), ensuring adequate separation of all key analytes (impurities and degradation products) (12,13). UHPLC, with its shorter analysis times and quicker column equilibration, is ideally suited for expediting this time-consuming process, involving numerous changes in column, mobile phase, and operating conditions (13).
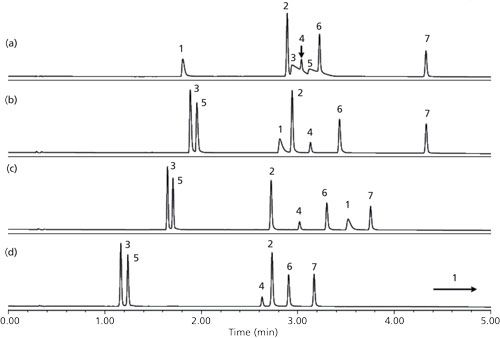
Figures 7 and 8 illustrate the use of a generic column and mobile-phase screening protocol, using four different stationary phases and mobile phases with low or high pH and methanol or acetonitrile for the separation of a mixture of seven compounds (14). In these two figures, the S values describe the degree of selectivity difference between two conditions (using the first column as a reference). The highest S values correspond to the conditions yielding separations with the greatest selectivity difference. Using short columns (50 mm x 2.1 mm, sub-2-µm) and fast generic broad gradients (5–100% B in 5 min), this initial screening can be completed using an automated UHPLC screening system in about 1 h. The next step typically involves the use of longer columns (that is, 100–150 mm) and further fine-tuning of the mobile phase and operating conditions to effect the separation of all critical components for regulated testing (12,13).
Figure 7: A case study of a generic column screening study using four short “orthogonal” UHPLC columns: (a) Acquity UPLC BEH C18, (b) Acquity UPLC CSH C18 (SBEH C18 = 83), (c) Acquity UPLC CSH Phenyl-Hexyl (SCSH C18 = 45), (d) Acquity UPLC CSH Fluoro-Phenyl (SCSH C18 = 85, SCSH Phenyl-Hexyl = 53). The screening was completed in 30 min. Column dimensions: 50 mm x 2.1 mm, 1.7 µm; mobile-phase A: 0.1% formic acid, mobile-phase B: acetonitrile; gradient: 5–95% B in 5 min; F = 0.5 mL/min; detection: UV absorbance at 254 nm. Courtesy of Waters Corporation.
Another rapid method development approach that was recently reported is the use of modernized universal generic gradient methods that are amendable to assays of multiple new chemical entities (NCEs), followed by adjustments in gradient conditions (tG and optimization of gradient segments) to resolve all impurities, particularly around the API region (15). The generic gradient methods can generate peak capacities in the range of 100–300 in 2–10 min and are effective for purity assays of many excipients, raw materials, starting materials, and less complex APIs.
Others Benefits
Other benefits of UHPLC include flexibility in customizing the resolution for different samples and a “greener” platform that leads to reduced solvent and sample usage as well as higher sensitivity and precision performance. Let’s take a closer look at those benefits.
Flexibility in Customizing Resolution
As described earlier, a major benefit of UHPLC is the versatility for the development of either ultrafast or very high-resolution methods. Figure 9 shows three chromatograms of a forced degradation NCE sample conducted with a gradient range of 20% to 60% B (with tG from 3 to 20 min), using columns of different lengths to customize the resolution to “fit for purpose” of the analysis (13). This example illustrates the versatility of UHPLC to provide ultrafast, mid-resolution, and very high-resolution analyses: Figure 9a shows a fast 6-min analysis with reasonable resolution using a 50-mm-long column; Figure 9b shows a 16-min analysis with excellent resolution using a 100-mm column; and Figure 9c shows a 30-min analysis with very high resolution using a 150-mm column. Not surprisingly, the resolutions between the three major components around the API peak increased substantially with longer column length and tG. In this figure, the gradient times were scaled almost proportionately to the column dead time (variation of column length and mobile phase flow rate). Note that the last two impurity peaks in the inset of the top chromatogram (fast method) were subsequently resolved into two sets of twin peaks, as shown in the inset of the bottom chromatogram (high-resolution method).
Figure 9: Three chromatograms demonstrating the ability to customize resolution using UHPLC columns of different lengths: (a) fast method (6 min, 50 mm column), (b) medium-resolution method (16 min, 100-mm column), (c) high-resolution method (30 min, 150-mm column). Mobile-phase A = 0.05% formic acid, mobile-phase B = acetonitrile; gradient: 20–60% B. Fast method: 50 mm x 2.1 mm, 1.7-µm Acquity BEH Shield RP18 column; tG = 3 min; F = 0.6 mL/min at 30 °C; 550 bar. Medium-resolution method: 100 mm x 2.1 mm, 1.7-µm Acquity BEH Shield RP18 column; tG= 10 min; F = 0.4 mL/min at 30 °C; 630 bar. High-resolution method: 150 mm x 2.1 mm, 1.7-µm Acquity BEH Shield RP18 column; tG = 20 min; F = 0.3 mL/min at 30 °C; 760 bar. Chromatograms adapted with permission from reference 13.
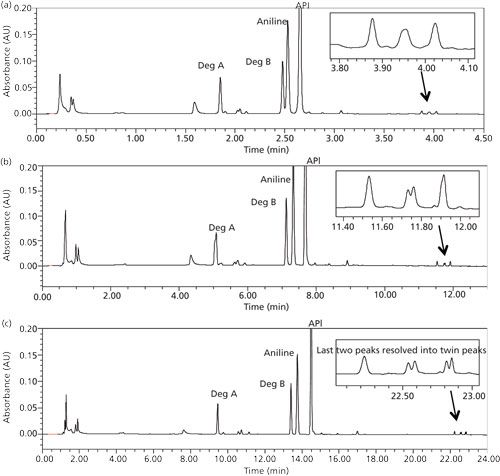
Figure 10: Comparative chromatogram of the same HPLC assay run on an Agilent 1290 binary system with (a) a standard flow cell with a 10-mm pathlength and (b) with a Max-Light flow cell with a 60-mm pathlength. Column: 150 mm x 4.6mm, 3-µm ACE C18; mobile-phase A: 20 mM ammonium formate at pH 3.7, mobile-phase B: acetonitrile with 0.05% formic acid; gradient: 5–15 % in 5 min, 15–40% in 25 min, 40–90% in 3 min; run time: 42 min; F = 1.0 mL/min at 30 °C; detection: UV absorbance at 280 nm 40 pt/s; sample: 10 µL of 0.5-mg/mL API. The noise of both detectors was found to be 24 µAU with the S/N of all peak estimated to be about six times higher in (b). The limits of quantitation or LOQs are calculated as follows: (a) 0.05% at 2 µL injection and 0.01% at 10 µL injection; (b) 0.01% at 2 µL injection and 0.002% at 10 µL injection. Note that the main API peak saturated the detector at 10 µL injection in (b). Adapted with permission from reference 18.
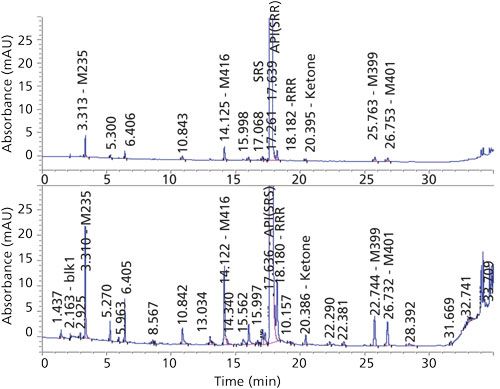
Shortly after the debut of the first commercial UHPLC system in 2004, one often heard arguments that UHPLC might not be needed, since one could use some alternative strategies such as high-temperature LC to achieve good performance at reduced pressure, or columns packed with sub-3-µm SPPs to enhance resolution (16). Today, most people realize that UHPLC is amenable to all these approaches (including 2D-LC [17]), yielding better results than conventional HPLC in all these applications. Therefore, the use of columns packed with SPP or the use of elevated mobile-phase temperature are options often used in UHPLC, rather than alternatives (18).
A “Greener” HPLC Platform with Higher Sensitivity and Precision Performance
The greener benefits of UHPLC include reduced solvent and sample usage as well as higher sensitivity and precision.
Solvent Savings
Substantial cost savings associated with the purchase and waste disposal of solvents (3–10-fold) is realized by using UHPLC, with the use of shorter columns with smaller internal diameters (2.1–3.0 mm versus 4.6 mm in conventional HPLC). When moving from HPLC to UHPLC, by using columns with the same L/dp ratio (therefore similar plate count), the solvent consumption can be reduced by a factor of 14 moving from 4.6-mm, 5-µm columns in HPLC to 2.1-mm, 1.7-µm columns in UHPLC, or by a factor of sevenfold when moving to 3-mm columns. Note that 1.0-mm i.d. columns would offer even greater savings though their efficiency performance is lower and they place more stringent requirements on low system dispersion.
Higher Sensitivity with UV Detection Using Extended-Pathlength Flow Cells
There are two types of sensitivity in HPLC analysis with ultraviolet (UV) detection: mass or concentration sensitivity. Mass sensitivity is defined as the minimum mass that is injected to yield a signal that is three times the baseline noise (limit of detection [LOD]) (12). Mass sensitivity is a function of VM and N. Concentration sensitivity is defined by the LOD based on sample concentration and remains independent of column size when the sample injection volume is scaled to VM. The principle for UV–visible (vis) absorption is governed by the Beer-Lambert law:

where A is absorbance, ε is molar absorptivity, b is pathlength, and c is concentration.
From this principle, one can see that higher absorbance (peak heights) or sensitivity can be achieved with UV flow cells having longer pathlengths. The small flow cells with total internal reflectance used in UHPLC allow the design of extended pathlength flow cells (for example, 25 to 60 mm) without excessive band broadening. Figure 10 shows the comparative chromatograms of a retention marker solution for an assay of a multichiral drug molecule using standard (10 mm) and an extended pathlength (60 mm) flow cells, respectively, under identical HPLC conditions (10). In this case, a sixfold increase of sensitivity is realized by using the longer-pathlength flow cell. These flow cells are typically used with larger-internal-diameter columns (3.0 mm) with external standardization (for example, for cleaning verification assays and analysis of genotoxic impurities, where sensitivity is critical) (19). It should be noted that in normalized area percent analyses that are used in early drug development, the ease for detector signal saturation of the main peak (>2 AU) negates this sensitivity gain.
Higher Precision of Retention Times and Peak Areas
Precision for both retention times and peak areas in UHPLC is generally improved by two- to threefold versus those of conventional HPLC. With better-designed pumps, the retention time precision was improved not just for repeated runs on the same day but also over an extended period. Many analysts have noticed that peak calibration tables containing retention time windows (for example, ± 2%) for peak identification in UHPLC are often usable for many months without any modifications in extended stability studies of pharmaceuticals. In contrast, most analysts expect to do several adjustments of retention time windows for correct peak identifications in conventional HPLC methods in similar extended stability studies.
Peak area precision of 0.2–0.5% relative standard deviation (RSD) is readily achievable on conventional HPLC systems for injection volumes above 5 µL (12). Comparatively, with improved UHPLC autosamplers, peak area precision of <0.2% RSD for injection volumes down to 1 µL is now routinely achievable (10). This level of precision, coupled with smaller injection volumes, allows the use of smaller overall sample amounts, along with fewer duplicated sample preparations in quantitative assays.
Conclusions
UHPLC is rapidly becoming the standard HPLC platform in many laboratories. This installment provides an overview of its benefits for improving performance in analysis speed, resolution, sensitivity, precision, and solvent and sample savings. Diversified case studies are used to illustrate these performance enhancements and their significant impacts in pharmaceutical analysis.
Acknowledgments
The authors would like to thank Rowan Moore of Thermo Fisher Scientific, Matt Mullaney of Pentec Health, David Van Meter of EAG Laboratories, Tom Walter of Waters Corporation, and Wilhad Reuter of PerkinElmer for their technical and editorial inputs.
References
- C.H. Arnaud, Chem. & Eng. News94(24), 29–35 (2016).
- U.D. Neue, M. Kele, B. Bunner, A. Kromidas, T. Dourdeville, J.R. Mazzeo, E.S. Grumbach, S. Serpa, T.E. Wheat, P. Hong, and M. Gilar, in Advances in Chromatogr.48 (CRC Press, Boca Raton, Florida, 2009), pp. 99–143.
- “UHPLC: Where We Are Ten Years After Its Commercial Introduction,” D. Guillarme and M.W. Dong, Eds., Trends in Anal. Chem. (a special issue) 63, 1–188 (2014).
- D. Guillarme and M.W. Dong, Am. Pharm. Rev. 16(4), 36–43 (2013).
- J. De Vos, K. Broeckhoven, and E. Eeltin, Anal. Chem. 88, 262–278 (2016).
- M.W. Dong, LCGC North Am. 35(6), 374–381 (2017).
- D. Guillarme, D. Nguyen, S. Rudaz, and J.L. Veuthey, Eur. J. Pharm. Biopharm. 68(2), 430–440 (2008).
- K. Broeckhoven and G. Desmet, Trends Anal. Chem. 63, 65–75 (2014).
- Q.A. Xu, UHPLC and Its Applications (John Wiley & Sons, Hoboken, New Jersey, 2013).
- M. Dong, D. Guillarme, S. Fekete, R. Rangelova, J. Richards, D. Prudhomme, and N. Chetwyn, LCGC North Am. 32(11), 868–876 (2014).
- L. Zhou, in Handbook of Pharmaceutical Analysis by HPLC, S. Ahuja and M.W. Dong, Eds. (Elsevier, Amsterdam, the Netherlands, 2005), chap. 17.
- M.W. Dong, Modern HPLC for Practicing Scientists (Wiley, Hoboken, New Jersey, 2006), chap. 4, 6, and 8.
- M.W. Dong and K. Zhang, Trends Anal. Chem. 63, 21–30 (2014).
- K.J. Fountain, H.B. Hewitson, P.C. Iraneta, and D. Morrison, “Practical Applications of Charged Surface Hybrid (CSH) Technology,” 720003720EN, Milford, Massachusetts (2010).
- M.W. Dong, LCGC North Am. 34(6), 408–419 (2016).
- S. Fekete, D. Guillarme, and M.W. Dong, LCGC North Am. 32(6), 420–433 (2014).
- M. Sarrut, G. Cretier, and S. Heinisch, Trends Anal. Chem. 63, 104–112 (2014).
- M.W. Dong, LCGC North Am. 31(10), 868–880 (2013).
- M.W. Dong, E.X. Zhao, D.T. Yazzie, C.C. Gu, and J.D. Pellett, Amer. Pharm. Rev.15(6), 10–17 (2012).

Michael W. Dong is a principal of MWD Consulting, which provides training and consulting services in HPLC and UHPLC, pharmaceutical analysis, and drug quality. He was formerly a Senior Scientist at Genentech, Research Fellow at Purdue Pharma, and Senior Staff Scientist at Applied Biosystems/PerkinElmer. He holds a PhD in Analytical Chemistry from City University of New York. He has more than 100 publications and a best-selling book in chromatography. He is an editorial advisory board member of LCGC North America. Direct correspondence to: LCGCedit@ubm.com

Davy Guillarme holds a PhD degree in analytical chemistry from the University of Lyon, France. He is now a senior lecturer at the University of Geneva in Switzerland. He has authored 180+ journal articles related to pharmaceutical analysis. His expertise includes HPLC, UHPLC, HILIC, LC–MS, SFC, analysis of proteins, and mAbs. He is an editorial advisory board member of several journals including Journal of Chromatography A, Journal of Separation Science, and LCGC North America.
Polysorbate Quantification and Degradation Analysis via LC and Charged Aerosol Detection
April 9th 2025Scientists from ThermoFisher Scientific published a review article in the Journal of Chromatography A that provided an overview of HPLC analysis using charged aerosol detection can help with polysorbate quantification.
Removing Double-Stranded RNA Impurities Using Chromatography
April 8th 2025Researchers from Agency for Science, Technology and Research in Singapore recently published a review article exploring how chromatography can be used to remove double-stranded RNA impurities during mRNA therapeutics production.

