Breaking the Rules: Two- and Three-Dimensional Chromatography with Four Dimensions of Mass Spectrometry
Two-dimensional liquid chromatography (2D-LC) is now commercially available and is being implemented in an increasing number of laboratories around the world. Normally, 2D-LC is done using one or more detectors at the end of the second dimension, 2D, and the first dimension, 1D, is reconstructed from numerous slices across the 1D peaks. As a result, regular 2D-LC imposes severe constraints on the run times available in the second dimension and induces a number of other limitations. We started with a ground-up approach, adapted some principles taken as immutable rules, used uncommon approaches, and pioneered new techniques to accomplish separations that have never been possible before. We employed 2D-LC in two highly orthogonal dimensions of separation with four mass spectrometers for detection (employing different atmospheric pressure ionization types) with parallel detection in each dimension, referred to as LC2MS4, with up to five other detectors for as many as nine detectors overall. We have further broken ground by using three dimensions of separation with four mass spectrometers, using two parallel second dimensions (2Ds), for LC3MS4. We used multicycle chromatography, employed parallel gradients instead of modulation period gradients, utilized transferred eluent dilution (TED) in both 2Ds, and featured flow-rate programming to fine tune elution in the second 2D. All systems are joined together using a wireless communication contact closure system that allows quick and easy switching between many combinations of chromatographs and detectors for maximum flexibility.
Two-dimensional liquid chromatography (2D-LC) has been commercially available for several years now. An increasing number of laboratories are “taking the plunge” and implementing this advanced technology. 2D-LC allows much greater resolution of peaks than is possible in a classical single dimension separation because, at the maximum predicted by theory, the peak capacities are multiplicative (1,2). Some scientists at roundtables have discussed whether 2D-LC is “coming of age” (3), and review after review (>1750 reviews from Scopus) has appeared on the subject. For our purposes, we limit mention of a few reviews by the most recognized and prolific authors in the field: Schoenmakers (4–7), Pirok (5–7), Stoll (5,8,9), and Cacciola, Dugo, Mondello, and coworkers (10,11). While Stoll has perhaps become the most recognized face of 2D-LC, and has taken over the “LC Troubleshooting” column at LCGC, the work of Mondello and others has been mostly applied to food matrices; as a result, their work is the most relevant for our work. There are several excellent tutorials (6,7,12), with a highly useful one available from LCGC (13).
After reading the principles and learning the nomenclature, our laboratory explored using 2D-LC. In the past, we routinely used two, three, or four mass spectrometers simultaneously, for dual- (14), triple- (15), and quadruple (16)-parallel mass spectrometry (MS) attached to a single LC system, referred to as LC1MS2, LC1MS3, and LC1MS4, respectively. These employed atmospheric pressure chemical ionization (APCI), electrospray ionization (ESI), and atmospheric pressure photoionization (APPI) in different combinations. Multiple parallel mass spectrometry has been reviewed several times (17–20). For us, it seemed a natural evolution to apply multiple parallel mass spectrometers across multiple dimensions of LC separations. However, to accomplish our goals using our existing “legacy” instruments mixed with a few newer acquisitions, we needed to break many of the rules of conventional 2D-LC and take a different approach. This article describes our work combining LC×LC with quadruple parallel mass spectrometry (MS4) for LC1MS2 × LC1MS2 = LC2MS4, and discusses our ongoing work using three dimensions of separation, comprised of two parallel second dimensions, combined with MS4 for LC1MS2 × (LC1MS1 + LC1MS1) = LC3MS4.
Materials and Methods
LC1MS2 × LC1MS2 = LC2MS4
Samples were seed oils, (African mobola plum (parinari curatellifolia) seed oil, cherry kernel oil, and soybean oil) that were prepared using a modified version of the extraction process of Folch and others (21), as previously described (22).
The instrument arrangement for the separation of naturally occurring trans fat-containing seed oils has been shown previously (22) and is reproduced in Figure S1. We employed two conventional Inertsil ODS-2 (GL Sciences, Inc.) columns with the following dimensions: 25.0 cm x 4.6 mm, 5 μm particles, with a flow rate of 1.0 mL/min, and split the flow to send ~54 μL/min to the second dimension. The 1D gradient used methanol, ethanol, and dichloromethane (DCM), for non-aqueous reversed-phase (NARP) high performance liquid chromatography (HPLC). All LC–MS experiments described here employed sub-ambient column compartments at 10 oC. The 1D and 2D gradients, as well as all conditions for four mass spectrometers, plus five other detectors—UV × 2, fluorescence detector (FLD), charged aerosol detector (CAD), and evaporative light scattering detector (ELSD)—were given in the literature to our earlier report (22).
Figure S1: Arrangement of instruments for 2D-LC, LC1MS2 × LC1MS2 = LC2MS4, experiments.
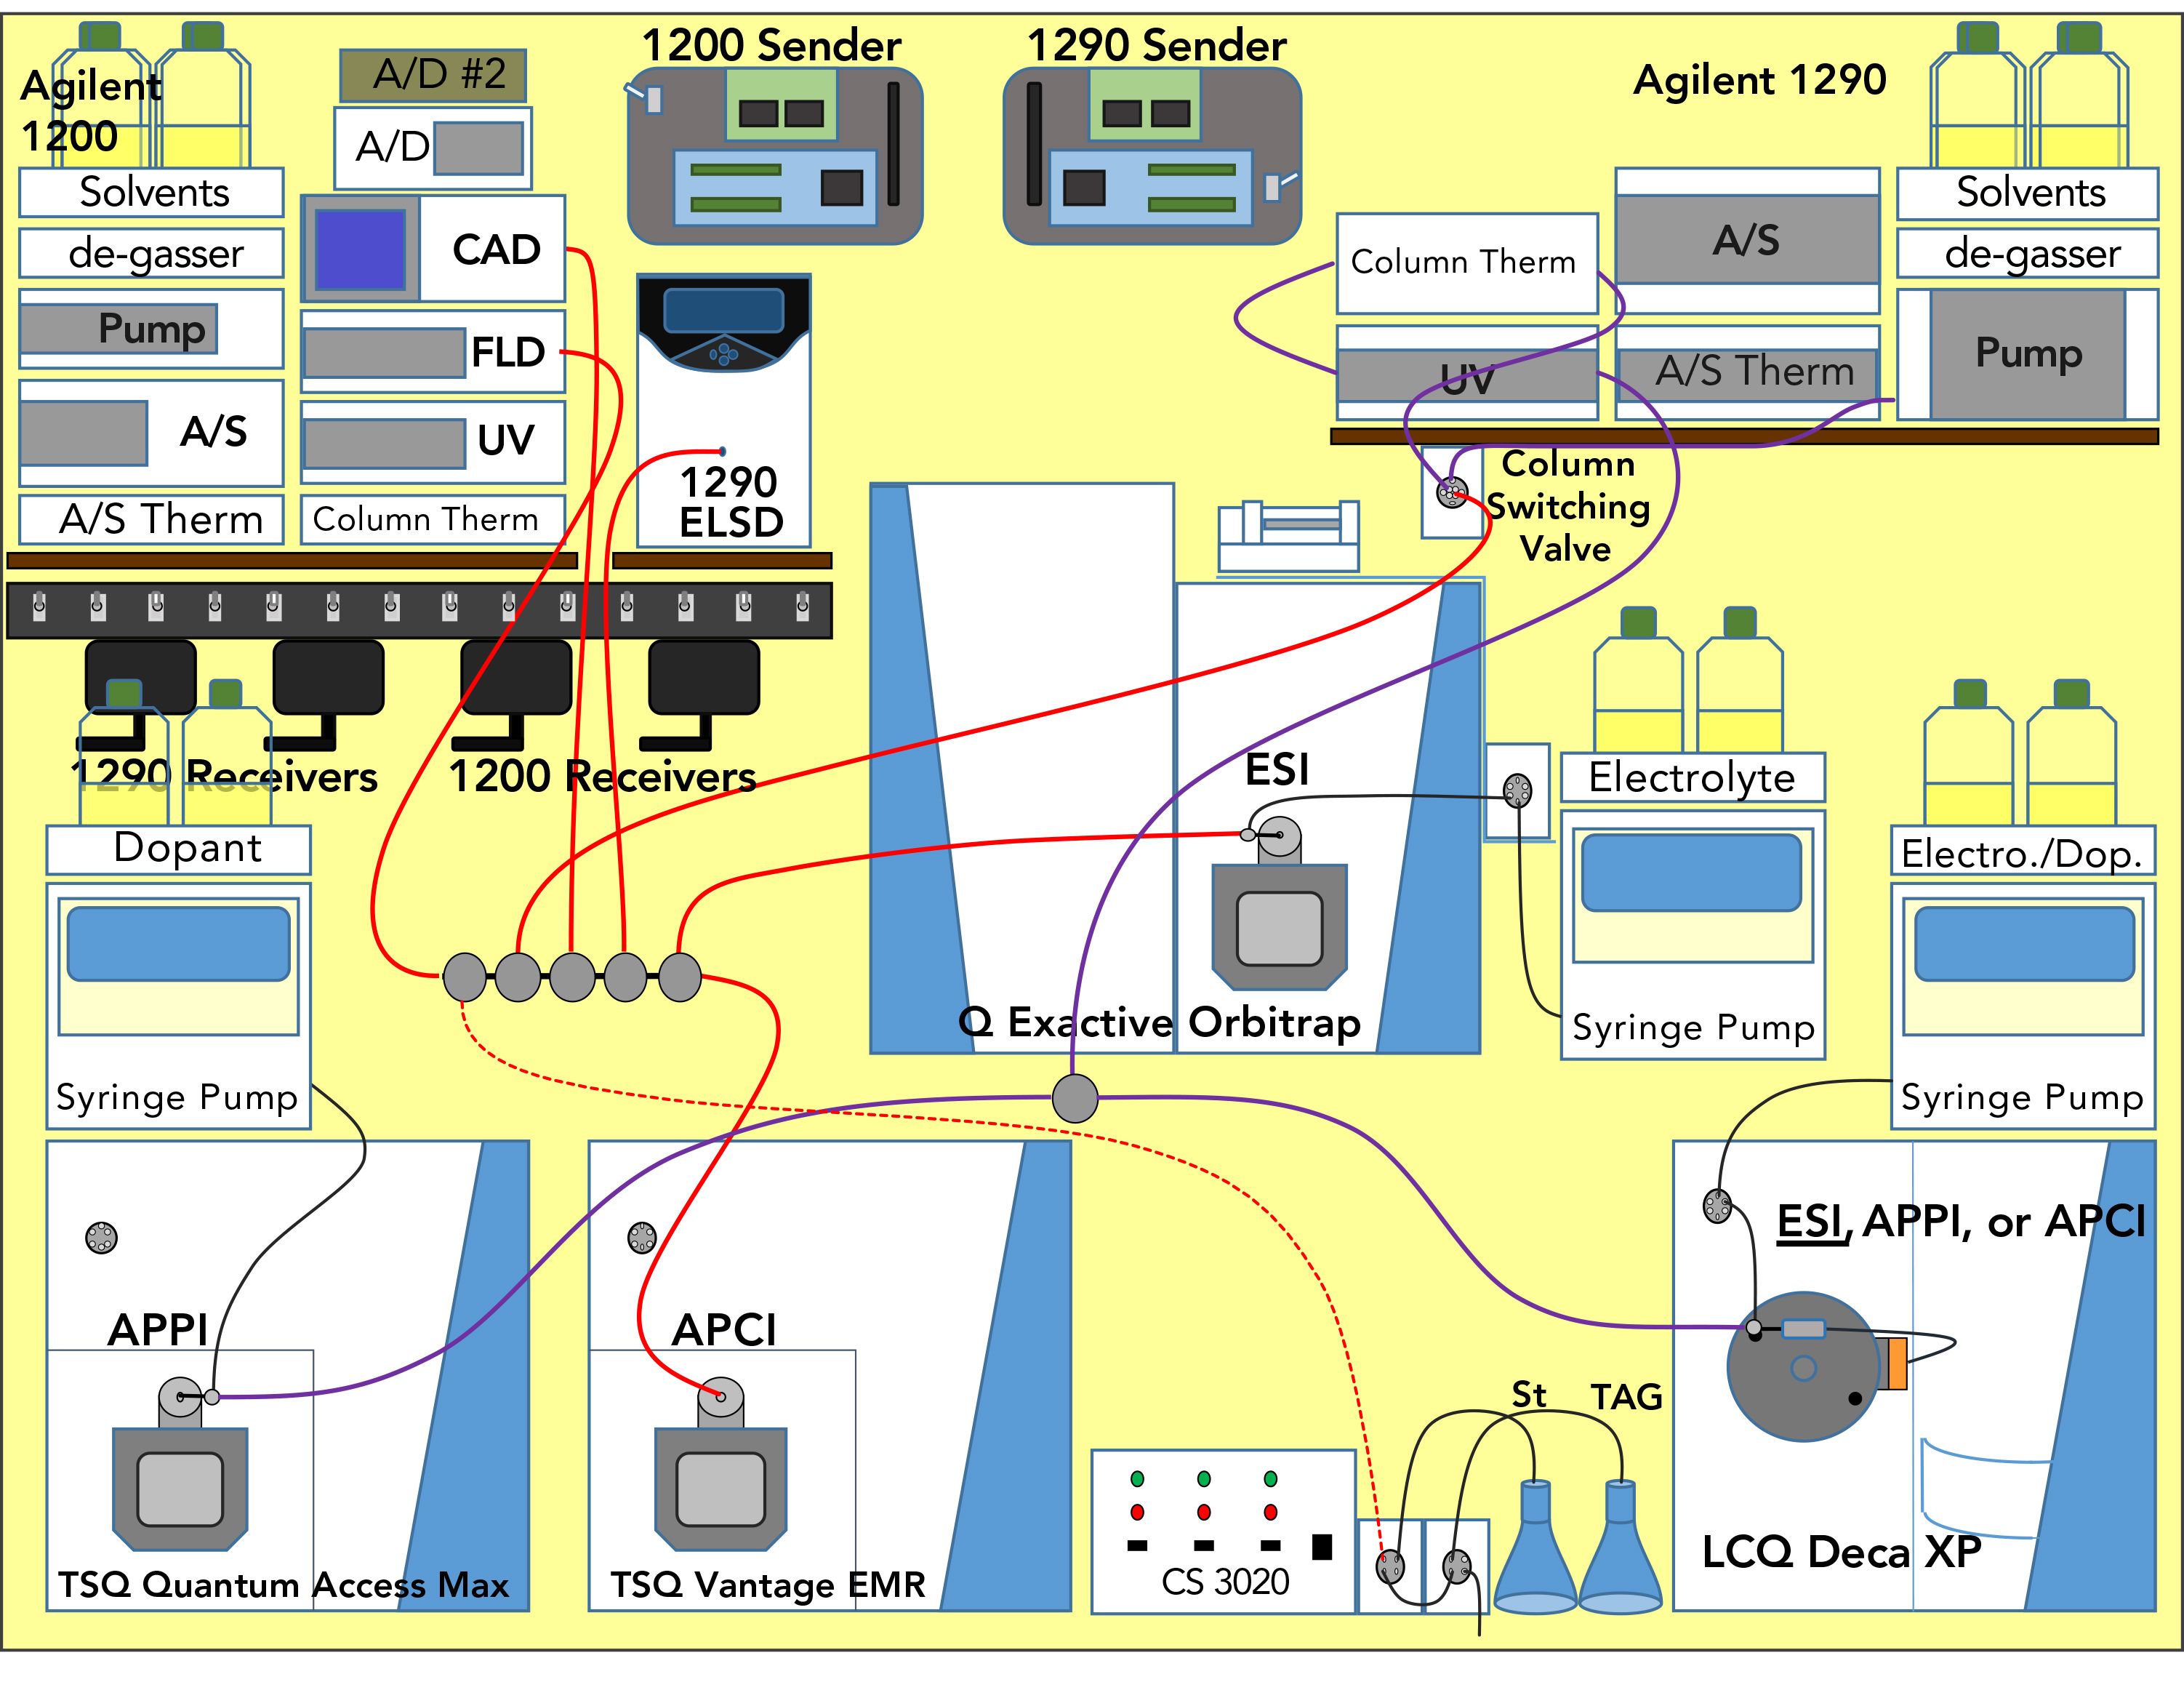
Two Thermo Scientific mass spectrometers, a TSQ Vantage EMR for APCI-MS and a QExactive for ESI-HRAM-MS, were used to monitor the 1D, and two more Thermo Scientific mass spectrometers, a TSQ Quantum Access Max for APPI-MS and an LCQ Deca XP for ESI-MS monitored the 2D. LC×LC software (GC Image, Inc.) was used to visualize the 2D chromatograms. All instruments and detectors were coordinated and controlled using the wireless communication contact closure system (WCCCS) previously described (23).
D6-α-tocopherol was used as an internal standard for quantification of fat-soluble vitamins (FSVs) using EICs, selected ion monitoring (SIM), and selected reaction monitoring (SRM). Triacylglycerols (TAGs) were quantified by percent relative composition, using response factors developed from a calibrated gas chromatograph with flame ionization detection (GC-FID), as previously described (24).
LC1MS2 × (LC1MS1 + LC1MS1) = LC3MS4
Standard reference material 1849a, infant–adult nutritional formula was extracted using the modified extraction that Folch and others used (21), with vitamin D2 added as an extraction internal standard, and vitamin K2 (menaquinone) added as an analytical internal standard. Figure 1 shows the arrangement of three liquid chromatographs (LC3) and four mass spectrometers (MS4) used for these experiments. The valve interface to the second 2D was constructed from available parts, as described elsewhere (25). The 1D separation employed the Agilent 1200 HPLC, with two Inertsil ODS-2 columns in series at 1.0 mL/min, as above. The NARP-LC gradient was a methanol:acetonitrile:dichloromethane gradient (15,16), but the isocratic methanol time range was replaced with a methanol gradient (necessary for FSVs) combined with acetonitrile and dichloromethane, to shorten the analysis from 130 min to 75 min, as shown in Figure S2. The entire flow went through the UV and FL detectors before entering the splitter. The tee branch used to provide effluent to the 2D(1) supplied ~52 μL/min, while the branch to the 2D(2) gave ~67 μL/min, with additional transferred eluent dilution (TED) solvent (70% acetonitrile:30% water) added just before each valve.
Figure 1: Arrangement of instruments for 3D-LC, LC1MS2 × (LC1MS1 + LC1MS1) = LC3MS4 experiments.
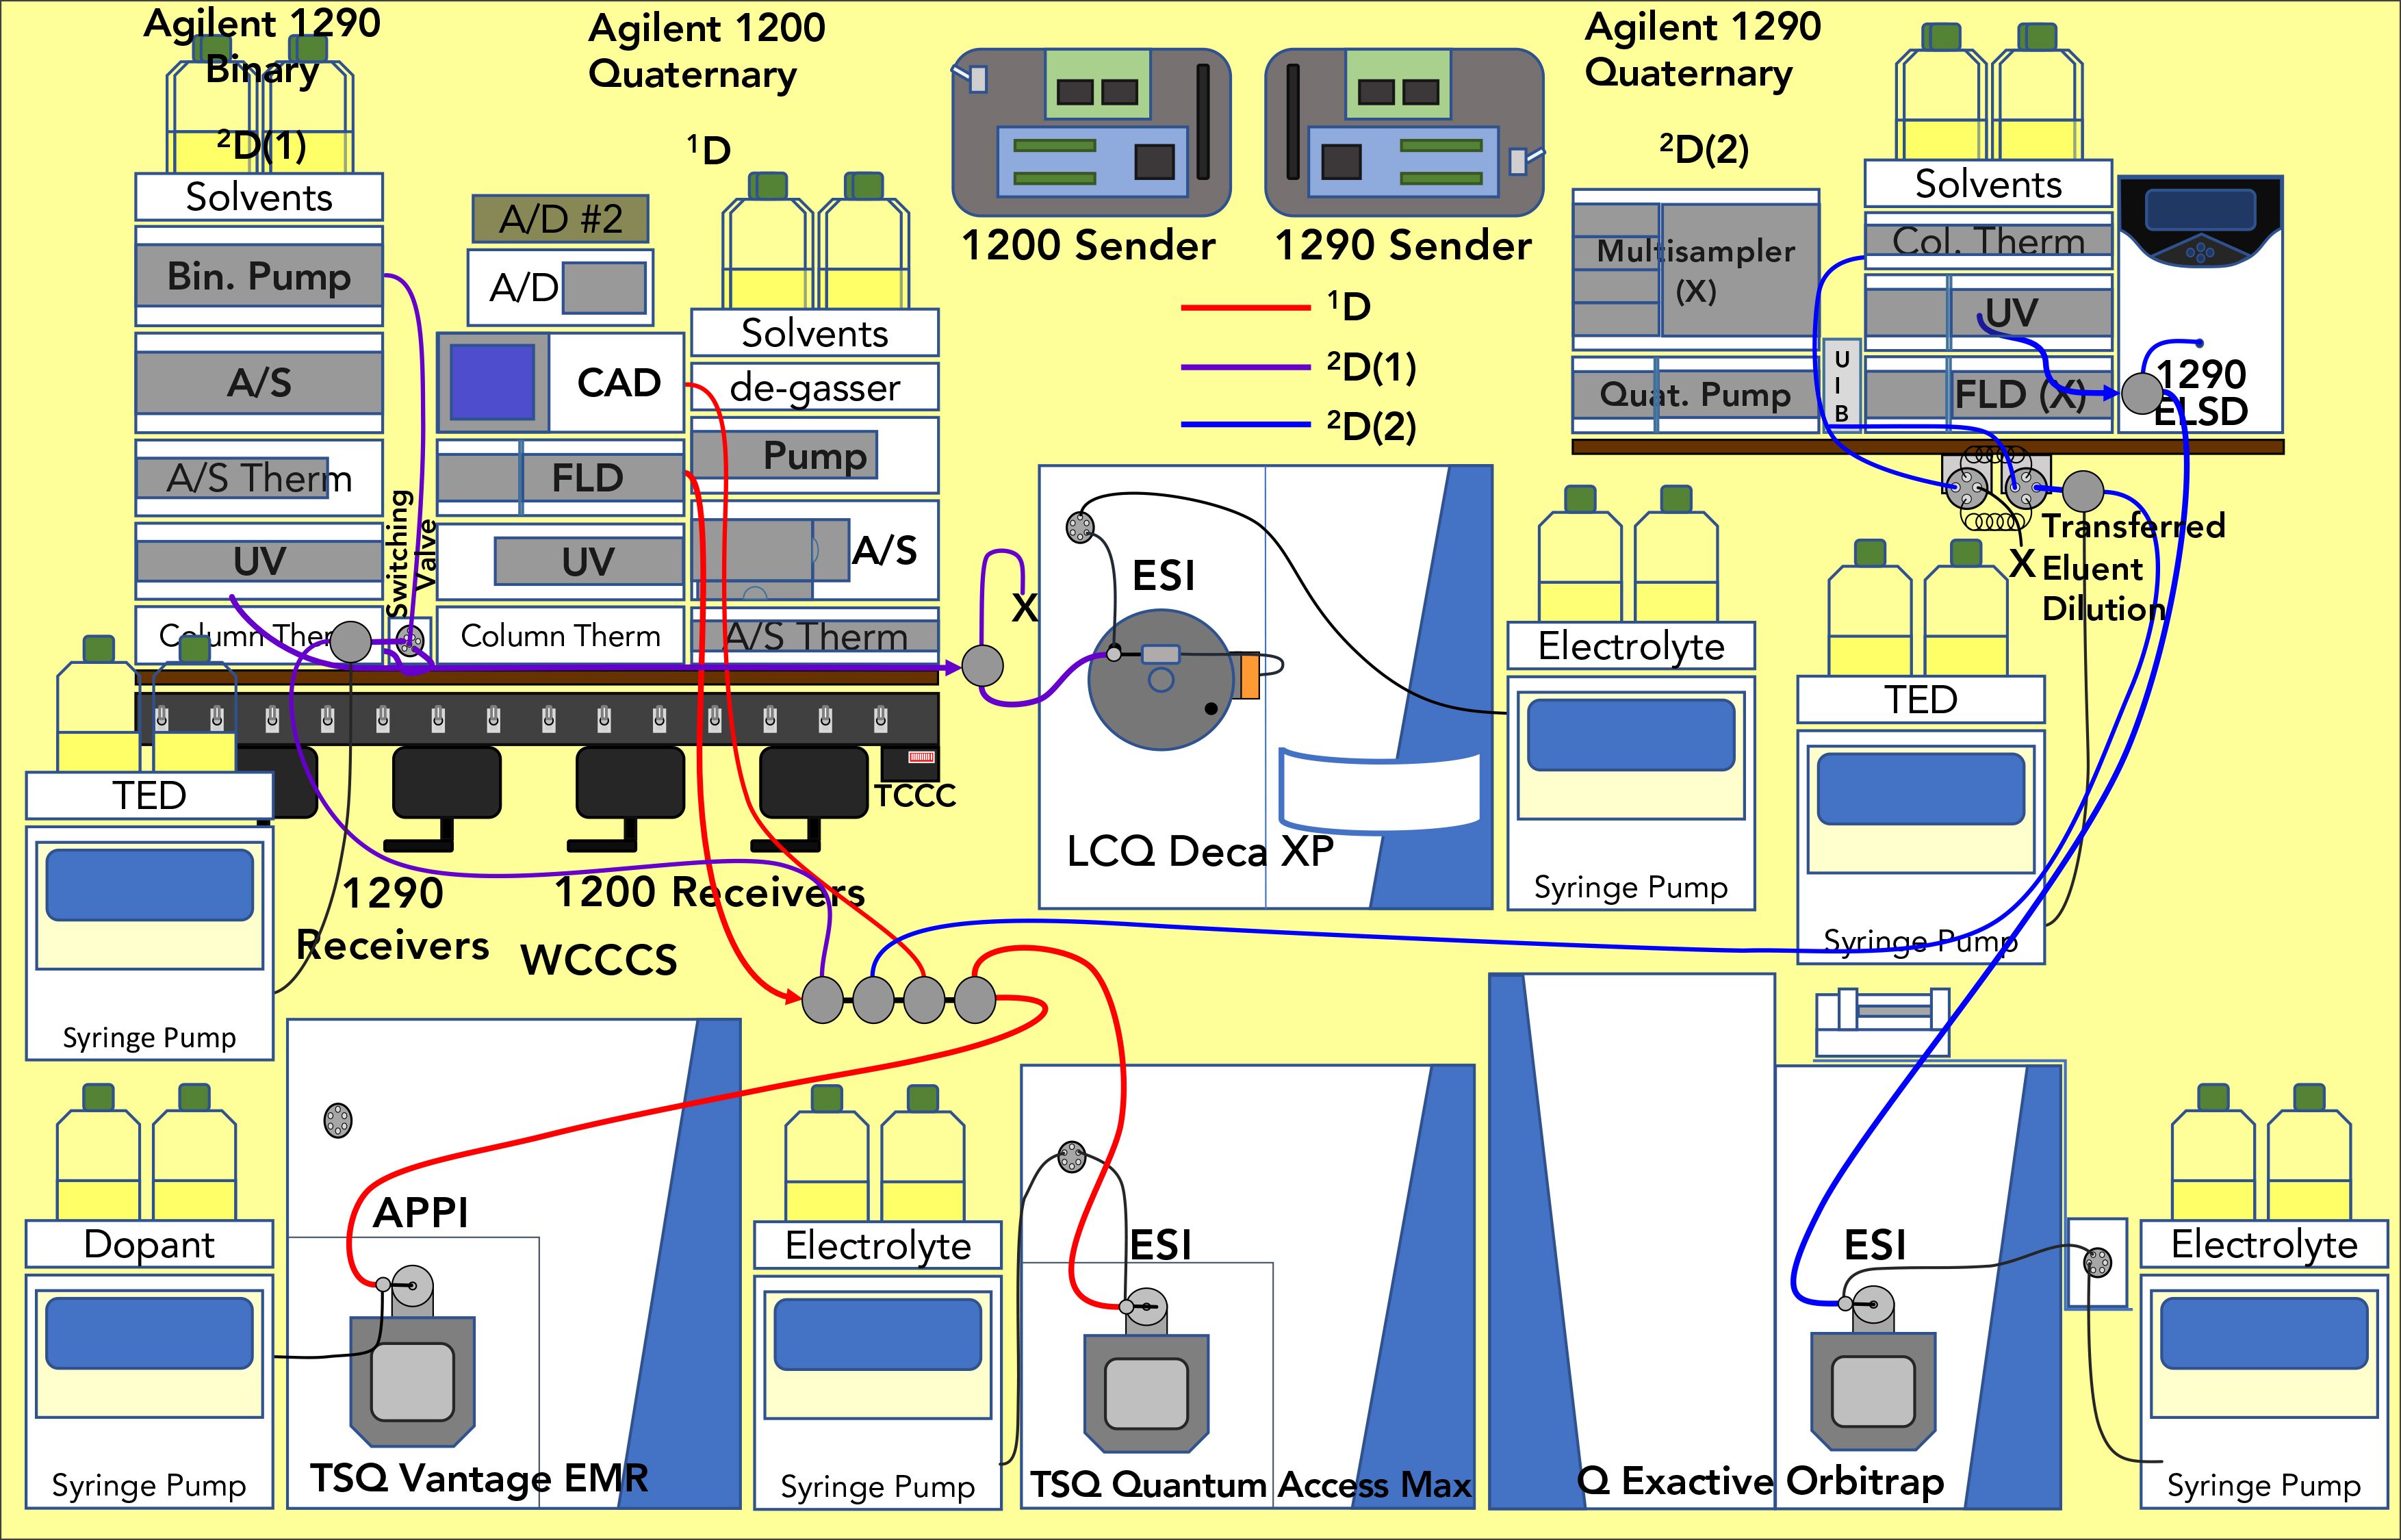
Figure S2: Solvent gradients used for (a) first dimension, 1D, HPLC; (b) first, second dimension, 2D(1), UHPLC; and (c) second, second dimension, 2D(2) UHPLC. Plot of 2D(2) method includes flow rate programming on right-hand scale.
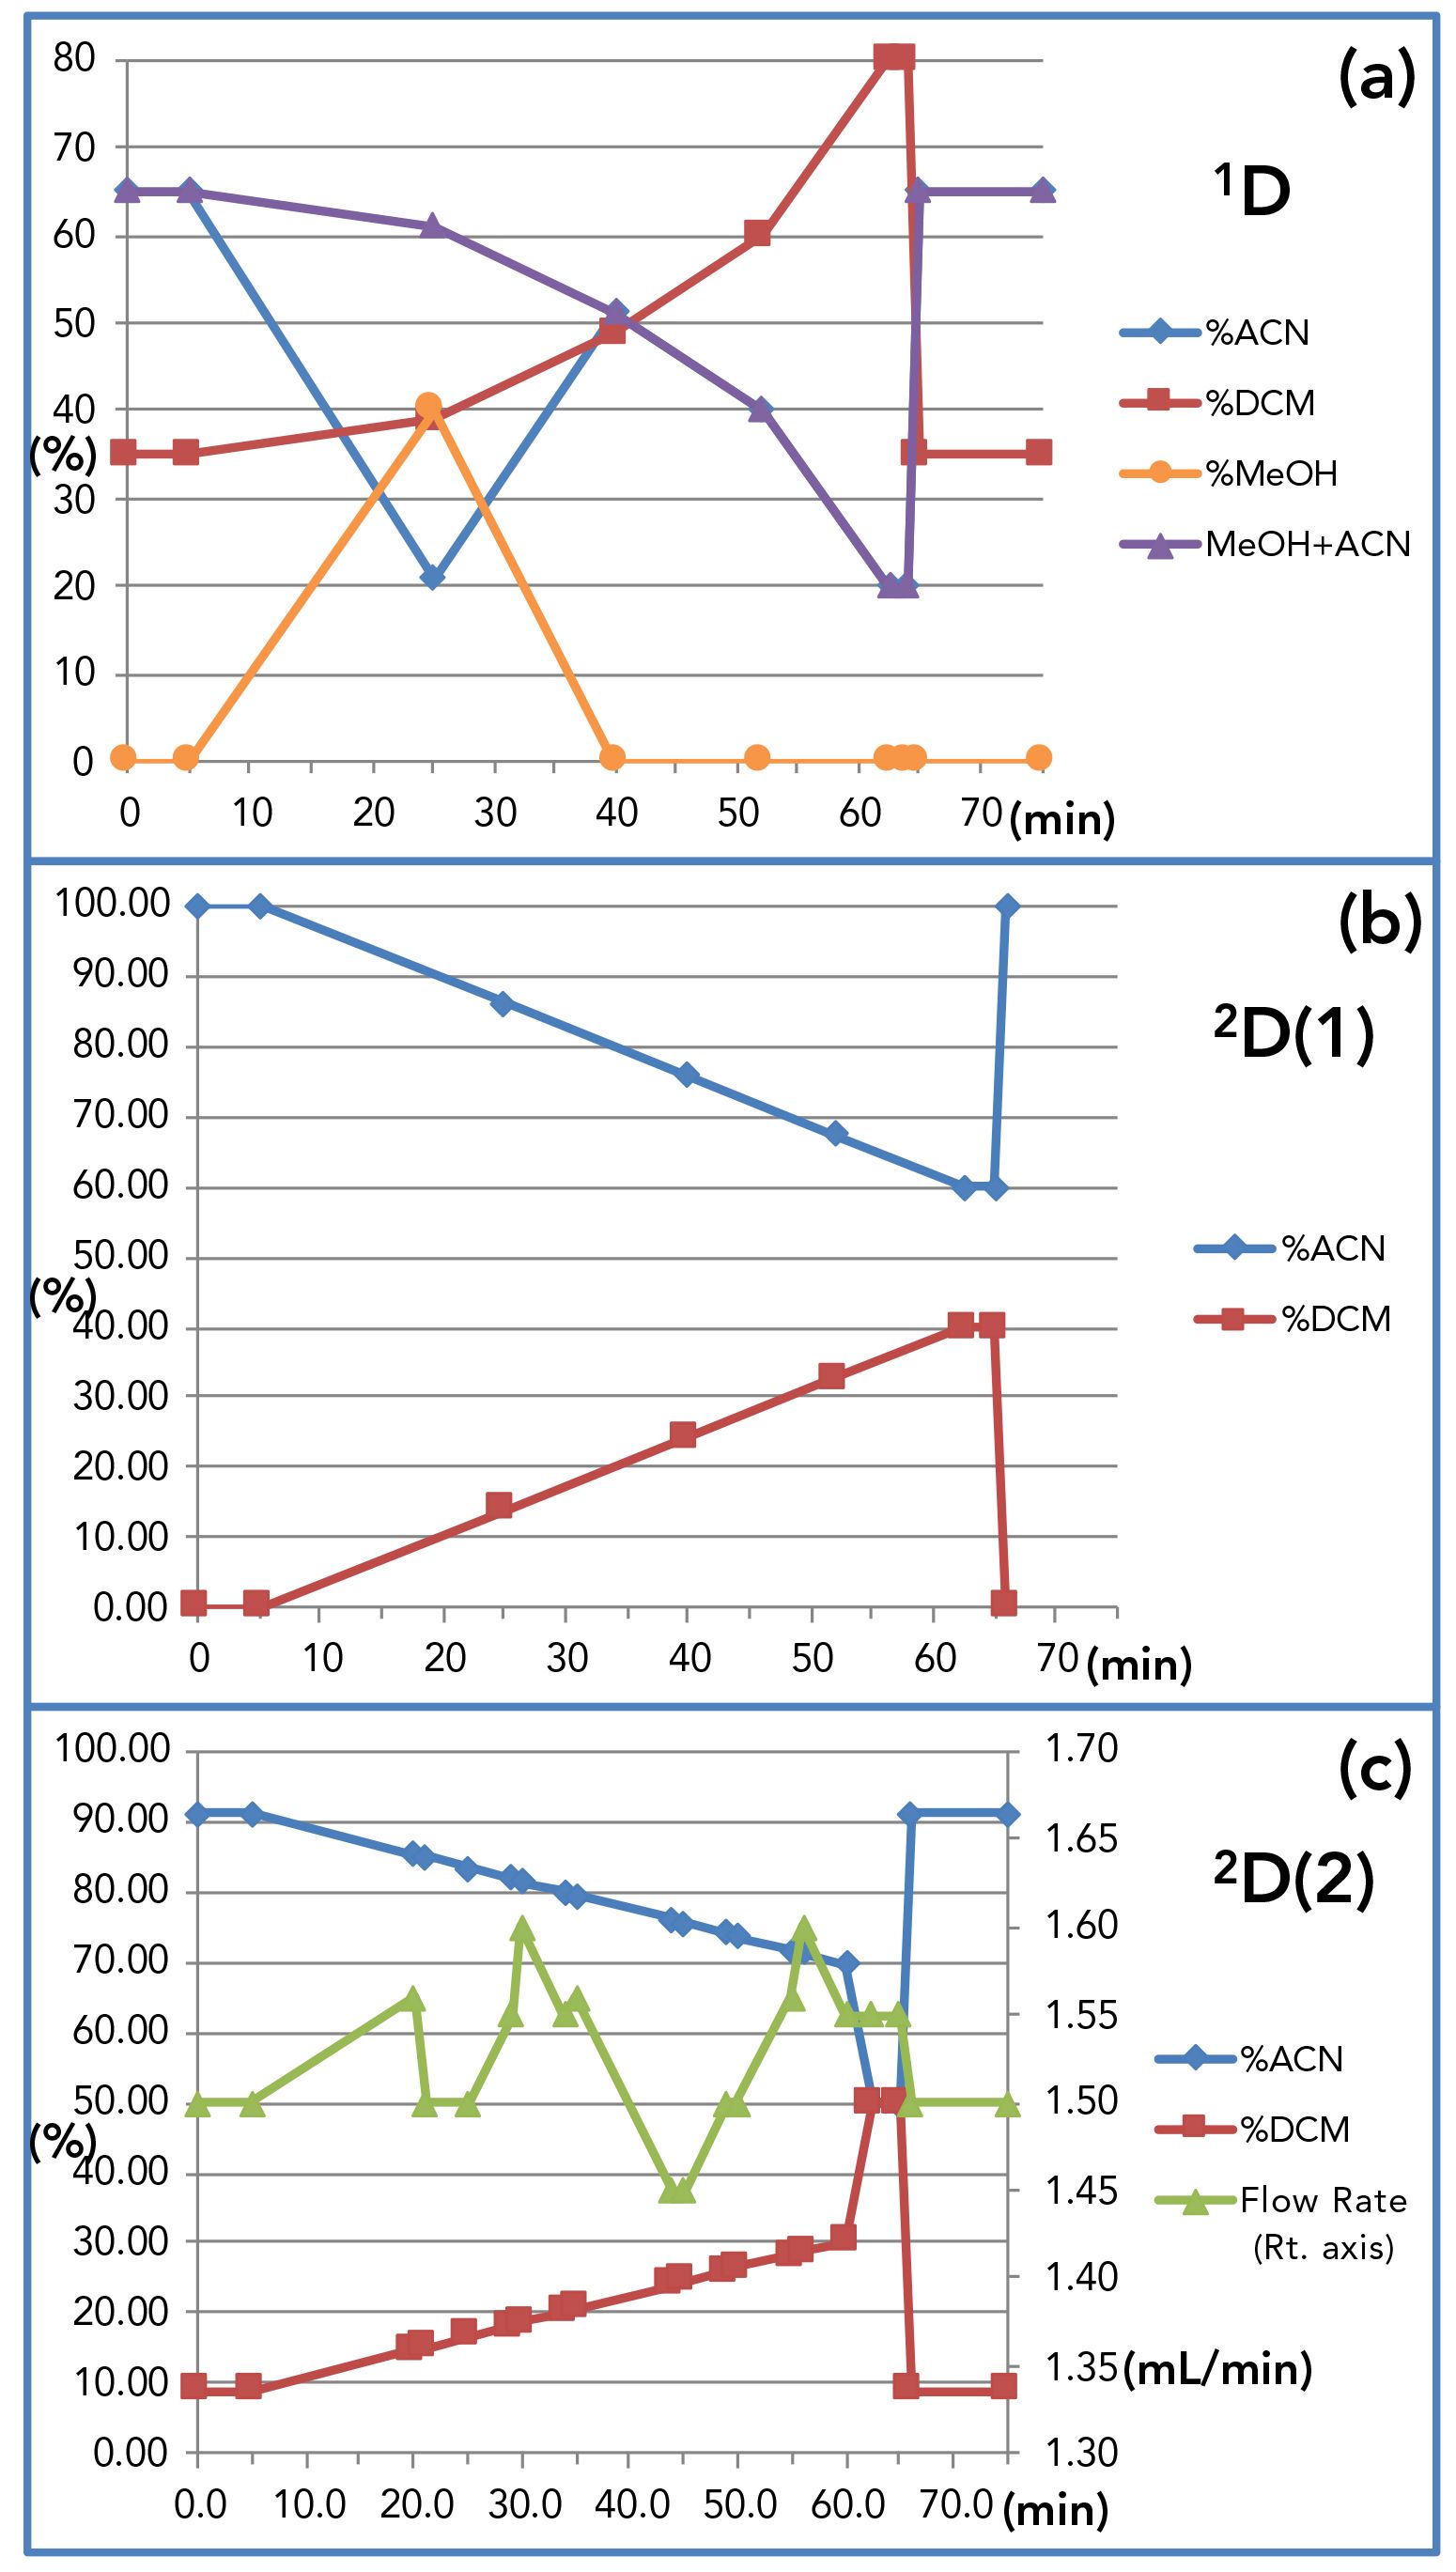
The 2D(1) Agilent 1290 binary UHPLC system was operated with a Thermo Scientific Accucore C30, 50 mm × 2.0 mm, 2.6 μm column at 10 oC, using an acetonitrile:dichloromethane parallel gradient at 1.30 mL/min, shown in Figure S2b. All of the 2D(1) flow went through the UV detector to an equal splitter, one half of which was directed to the Thermo Scientific LCQ Deca XP ion trap mass spectrometer in ESI-MS mode, and the other half was directed to waste.
An Agilent Infinity Flex II quaternary UHPLC pump, column compartment (at 10 oC), and UV detector were added to the arrangement of instruments to allow 2D(2), as shown in Figure 1. Separations were performed on a 100 mm × 3.0 mm, 2.6 μm particle Accucore C30 column using the acetonitrile:dichloromethane gradient shown in Figure S2c. A Valco tee split the flow so the majority went to the ELSD and ~150 μL/min went to a Thermo Scientific QExactive HRAM-MS mass spectrometer operating in ESI-MS mode.
Because of the highly correlated stationary phases and solvent systems, a TED solvent was employed to “knock down” the solvent strength of the 1D solvent, thereby dramatically sharpening peaks in the 2D(1) and 2D(2).
In contrast to LC2MS4 experiments, the LC3MS4 experiments employed only NARP separations in all three dimensions. Thus, instead of the shifted gradients used in LC2MS4 experiments, 3D LC3MS4 experiments utilized parallel gradients, inspired by discussions with T. Górecki (26) at the 2019 Eastern Analytical Symposium. The 2D(2) used a parallel gradient that did not elute analytes in one modulation period, but instead intentionally kept analytes on-column through multiple modulation periods, or cycles, which we refer to as multicycle comprehensive multidimensional LC (MC-CMDLC). LC3MS4 used flow rate programming (as shown in Figure S2c), to adjust flow rates that minimized the elution of major peaks across modulation period boundaries.
Results and Discussion
Our work may be referred to as split-flow comprehensive multidimensional LC (SF-CMDLC), specifically split-flow comprehensive 2-D LC (SF-C2DLC) and split-flow comprehensive 3-D LC (SF-C3DLC).
LC1MS2 × LC1MS2 = LC2MS4
The data from LC2MS4 runs are summarized in Figure 2, which shows dual parallel mass spectrometry, LC1MS2, (APCI-MS and ESI-HRAM-MS) in the 1D and dual parallel mass spectrometry, LC1MS2, (APPI-MS and ESI-MS) in the 2D. The first benefit of the LC2MS4 approach is that we completely bypassed the problem of undersampling, since the 1D was not reconstructed from multiple 2D modulations across the 1D peaks. This gave us much greater flexibility and longer run times in the 2D.
Another benefit of the LC2MS4 approach was the ability to use conventional quantification for SIM and SRM analyses of fat-soluble vitamin analytes, as shown in Figure 2 (22) and Figure 3 (27) using APCI-MS on a relatively slower scanning tandem sector quadrupole (TSQ ) instrument. Quantification of 2D-LC chromatograms based on the blobs in contour plots is improving, but it is still not as simple or reproducible as integrating a conventional SIM or SRM chromatogram in the 1D.
Figure 2: Summary of data for LC2MS4 experiments for analysis of African mobola plum seed oil, Parinari curatellifolia, showing quantification of fat-soluble vitamins using ultraviolet (UV) in the 1D; APCI-MS and ESI-MS chromatograms of TAGS in the 1D; 3D of the 2D by APPI-MS; and 3D chromatogram of the 2D by ESI-MS. Quantification of FSVs by SIM and SRM not shown. Red asterisks mark the TAG regioisomers ElElP/PElEl/ElPEl that were unresolved in the 1D and well separated into ElElP/PElEl versus ElPEl in the 2D. For fatty acyl chain abbreviations see Figure 4.
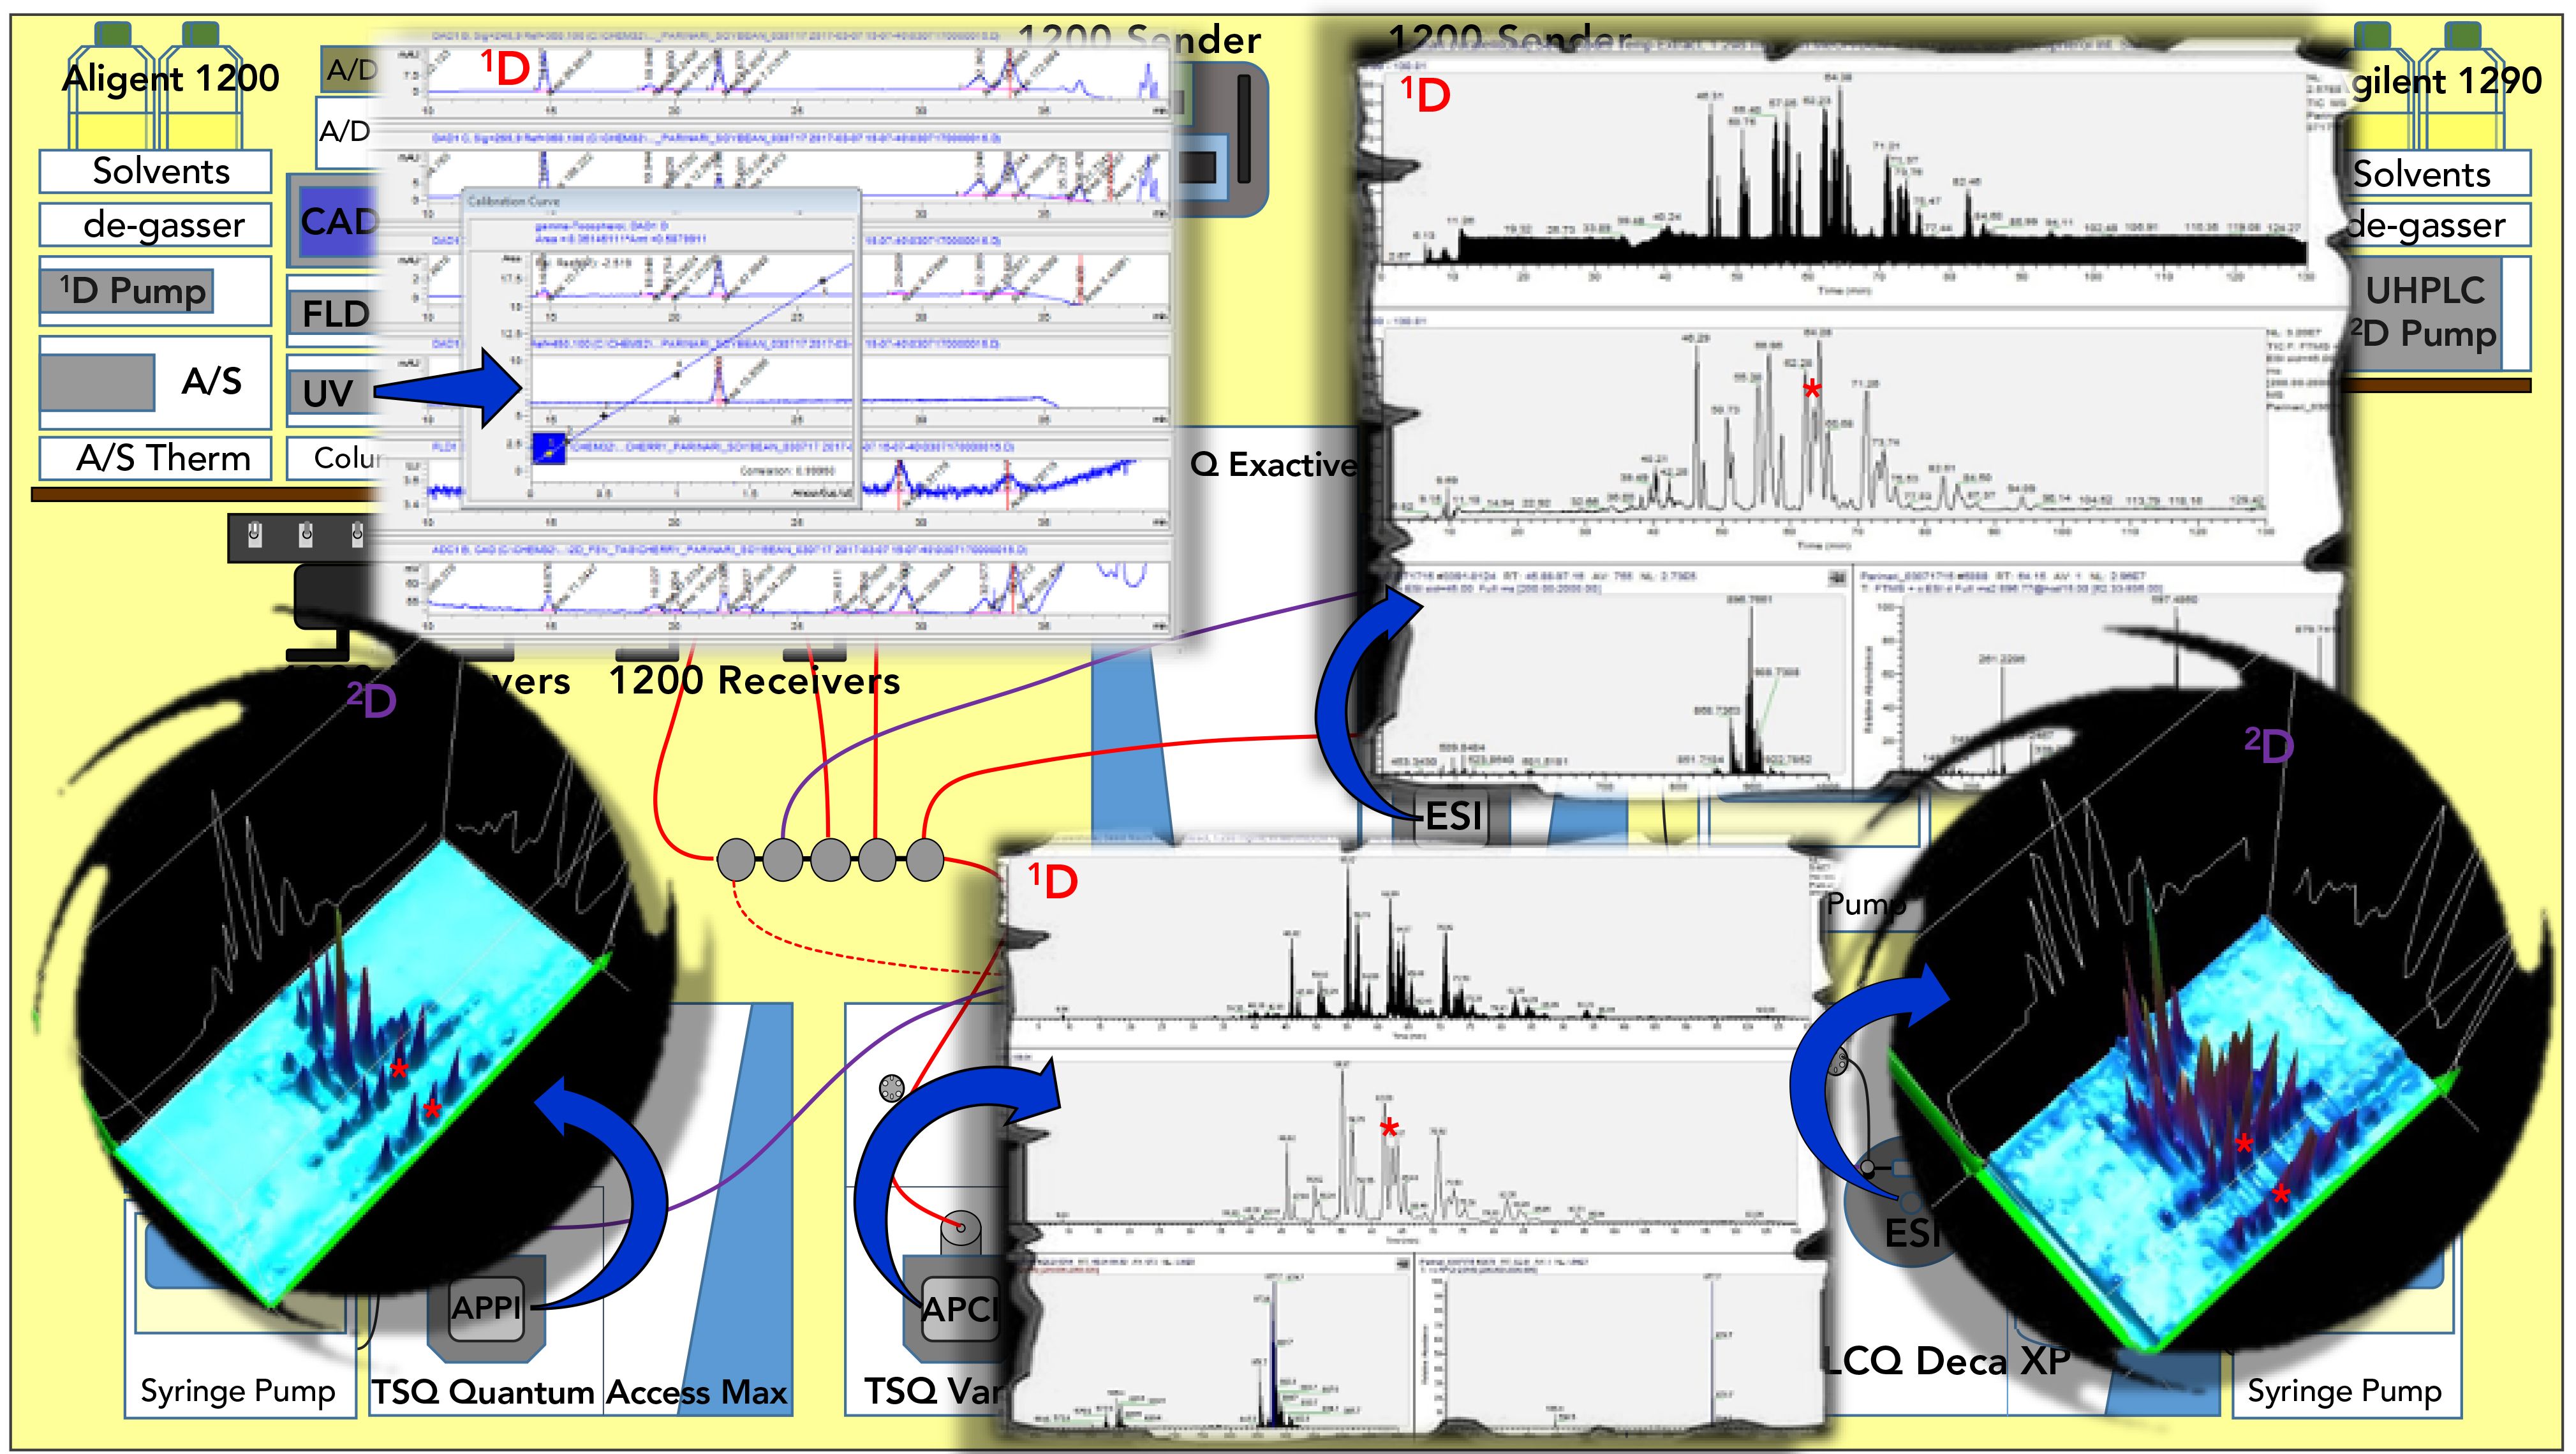
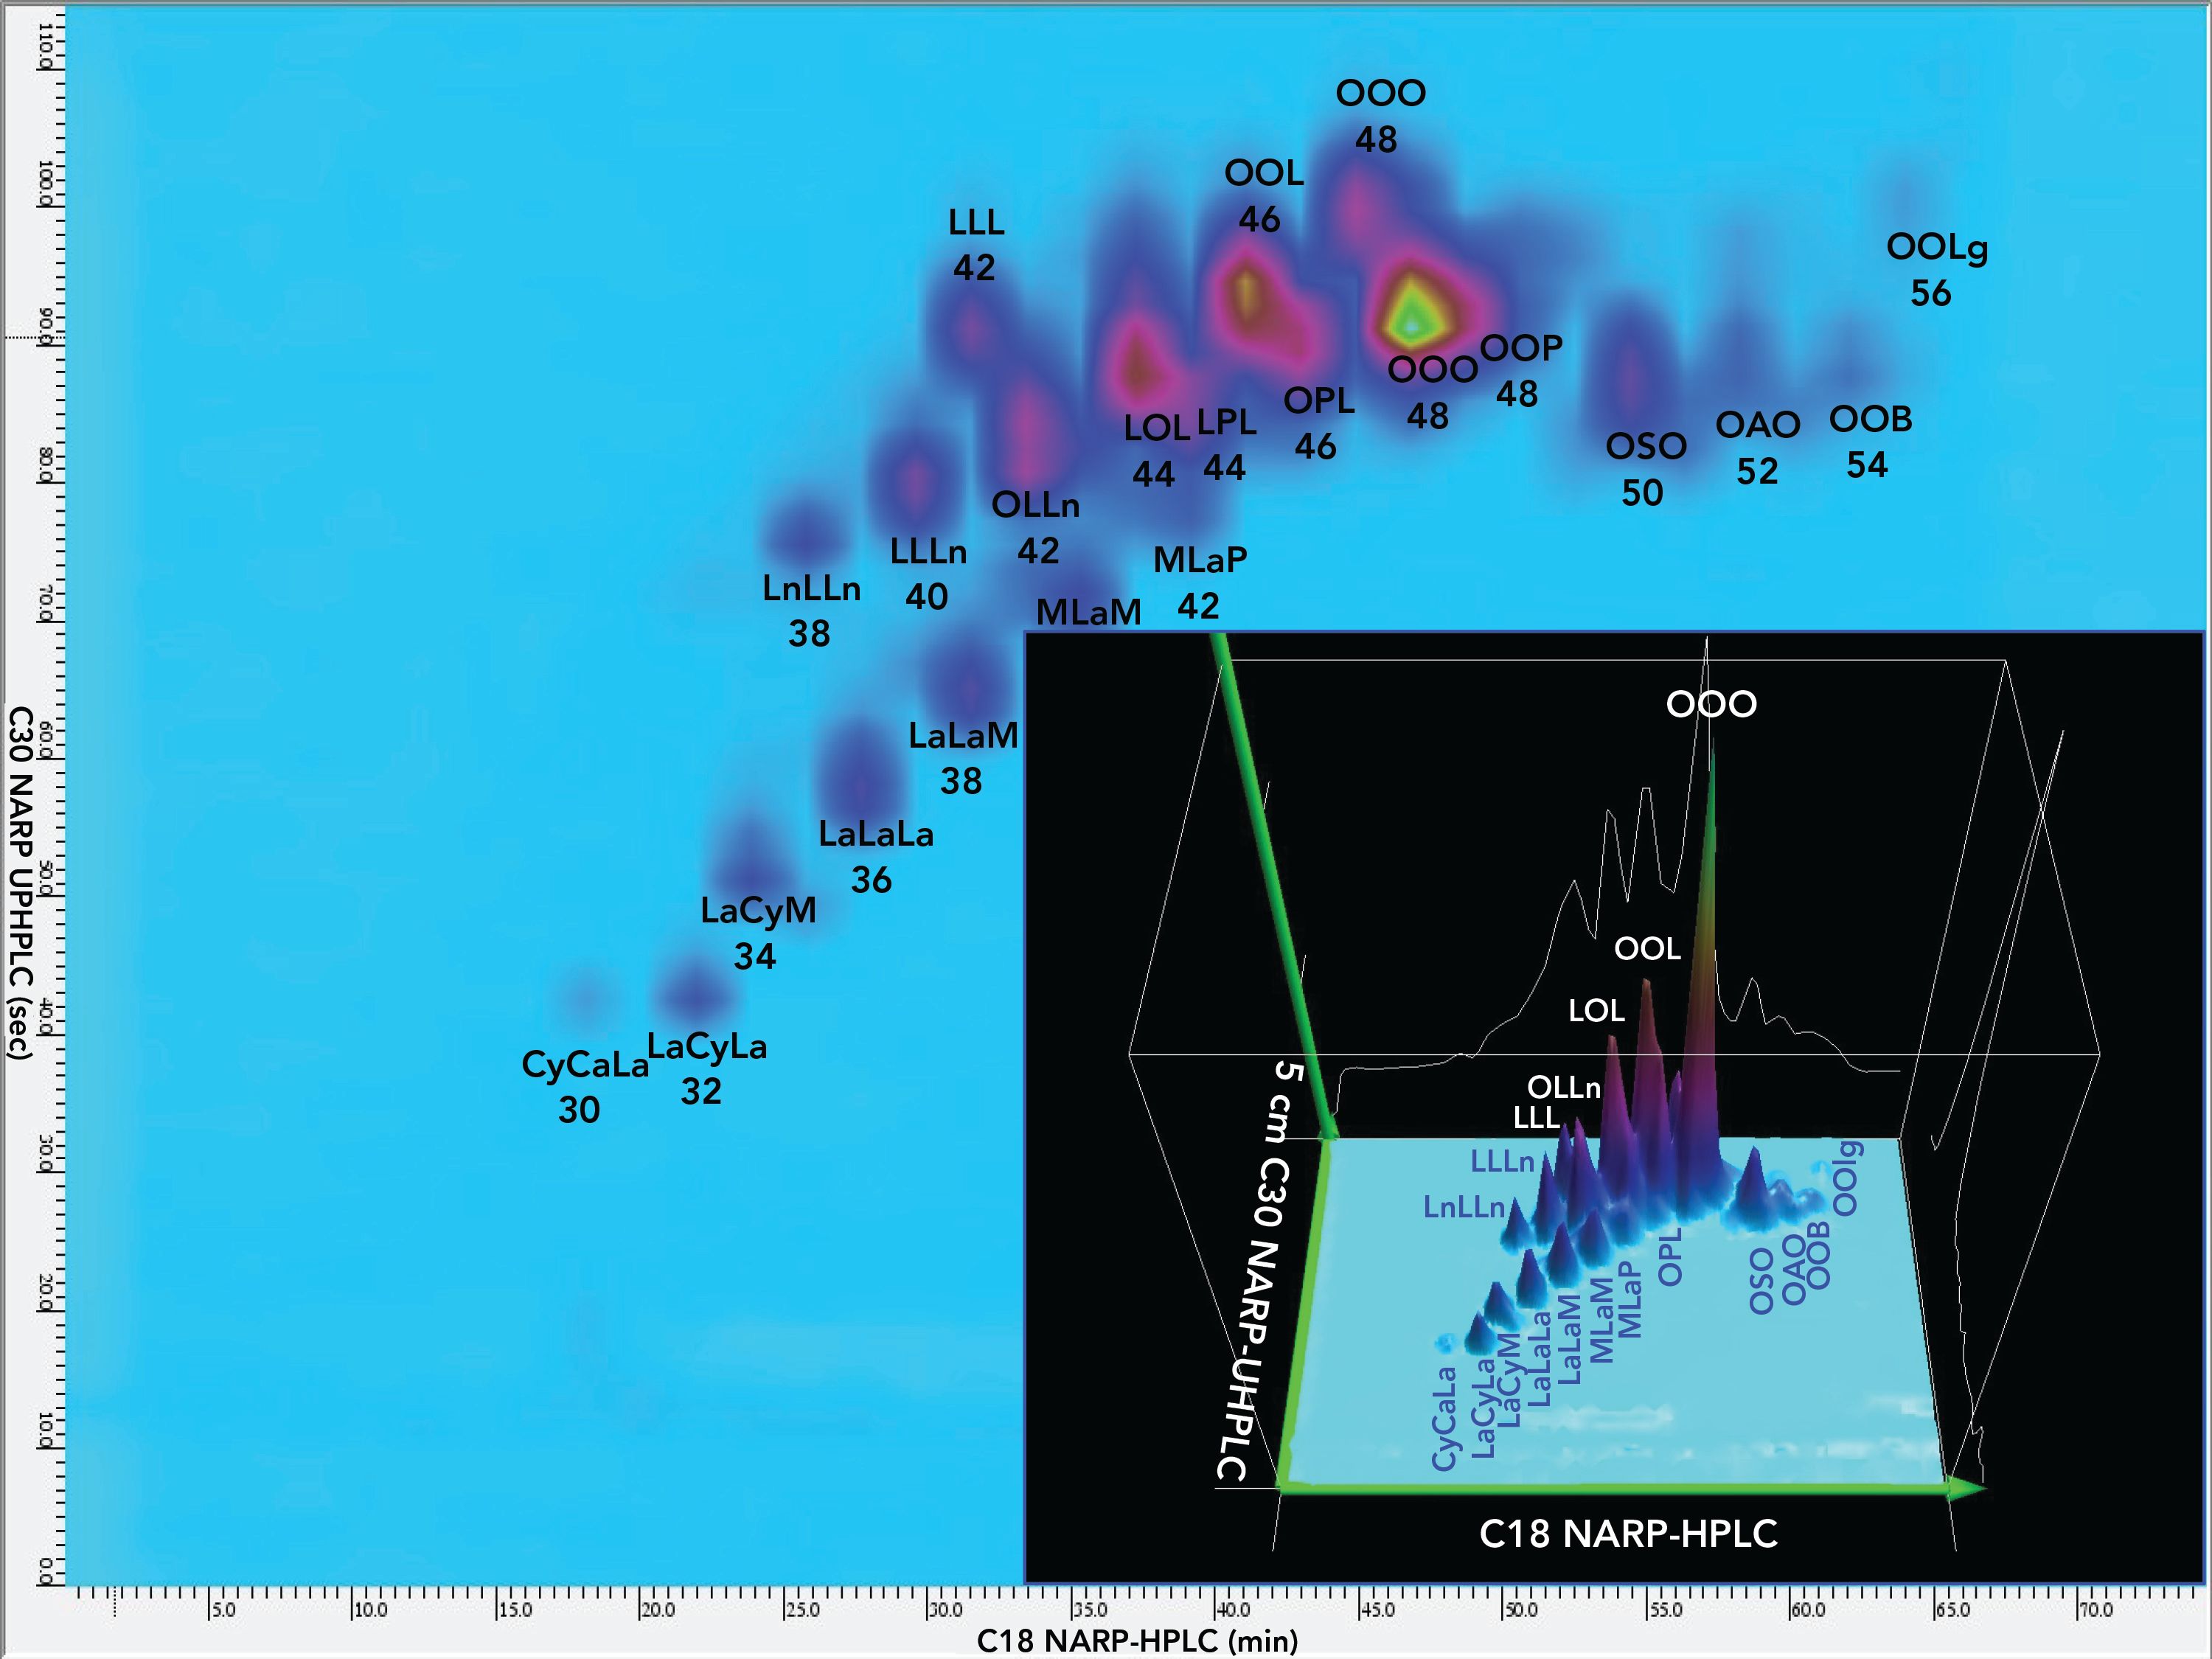
Figure 3: Contour plot and 3D chromatogram of first second dimension separation, 2D(1), on 5.0 cm C30 column with detection by ESI-MS on LCQ Deca XP mass spectrometer. See abbreviations in Figure 4.
Furthermore, we were able to readily identify oxo-TAGs (Figure 3 (22)). Then, we used conventional extracted ion chromatograms (EICs) of diacylglycerol-like fragment ions, [DAG]+, and protonated molecules, [M+H]+, by APCI-MS to quantify the percent relative composition of normal and oxo TAGs in the 1D. APCI-MS mass spectra in Figure 2 showed protonated molecule peaks and some [DAG]+ fragments, depending on the degree of unsaturation (28), while ESI- HRAM-MS gave ammonium adducts. Figure 2 shows average mass spectra across the whole range of TAGs, as well as an ESI-HRAM-MS/MS spectrum of m/z 896.766, oleoyl,linoleoyl,eleostearin (OLEl), one of the most abundant TAGs in P. curatellifolia, as well as a typical single APCI-MS mass spectrum of ElElO, all from the 1D.
Figure 2 also shows 2D-LC chromatograms by APPI-MS and ESI-MS. The more saturated colors in the LC×LC chromatogram from ESI-MS indicates its larger peak heights and greater sensitivity than APPI-MS. These chromatograms both display good peak shapes, indicating that the orthogonal natures of the two stationary phases and mobile phase solvent systems led to minimal peak broadening.
Regioisomers
TAGs have their fatty acids (FAs) arranged in different ways on the three-carbon glycerol backbone (stereospecific numbering sn-1, sn-2, and sn-3), giving rise to regioisomers. While TAG regioisomers do not separate in the 1D, and when silver-ion LC is used as the 2D, the location of unsaturation in the TAGs allows them to be separated by 2D-LC. If the unsaturation was located in the sn-2 position, it was less accessible for coordination with the silver ion, and was retained more poorly (eluted earlier) than when the unsaturation was in the outer sn-1 and sn-3 positions.
Figure S3 illustrates the dramatic separation of regioisomers using silver-ion UHPLC in the 2D of a SF-C2DLC separation. Figure S3a shows a single sharp peak in the 1D EIC for the TAG made of two eleostearic acid (El, =9Z, 11E, 13E octadecatrienoic acid, 18:3) moieties and one palmitic acid (P, hexadecanoic acid, 16:0), ElElP/PElEl/ElPEl, by NARP-HPLC-APCI-MS at m/z 851.71.
Figure S3: a) Extracted ion chromatogram (EIC) of TAG regioisomers ElElP/PElEl/ElPEl at m/z 851.7 by APCI-MS that were unresolved in the 1D; (b) the untransformed 2D chromatogram of TAGs by APPI-MS; (c) untransformed EIC of m/z 851.7, the [M+H]+ of ElElP/PElEl/ElPEl, by APPI-MS in the 2D with peaks integrated showing peak areas; (d1) APPI-MS mass spectrum across peak #1 above; (d2) APPI-MS mass spectrum across peak #3 above; (e) the untransformed 2D chromatogram of TAGs by ESI-MS; (f) untransformed EIC of m/z 868.7, the [M+NH4]+ of ElElP/PElEl/ElPEl, by ESI-MS in the 2D with peaks integrated showing peak areas; (g1) ESI-MS mass spectrum across peak #1 above; (g2) ESI-MS mass spectrum across peak #3 above. For fatty acyl chain abbreviations see Figure 4.
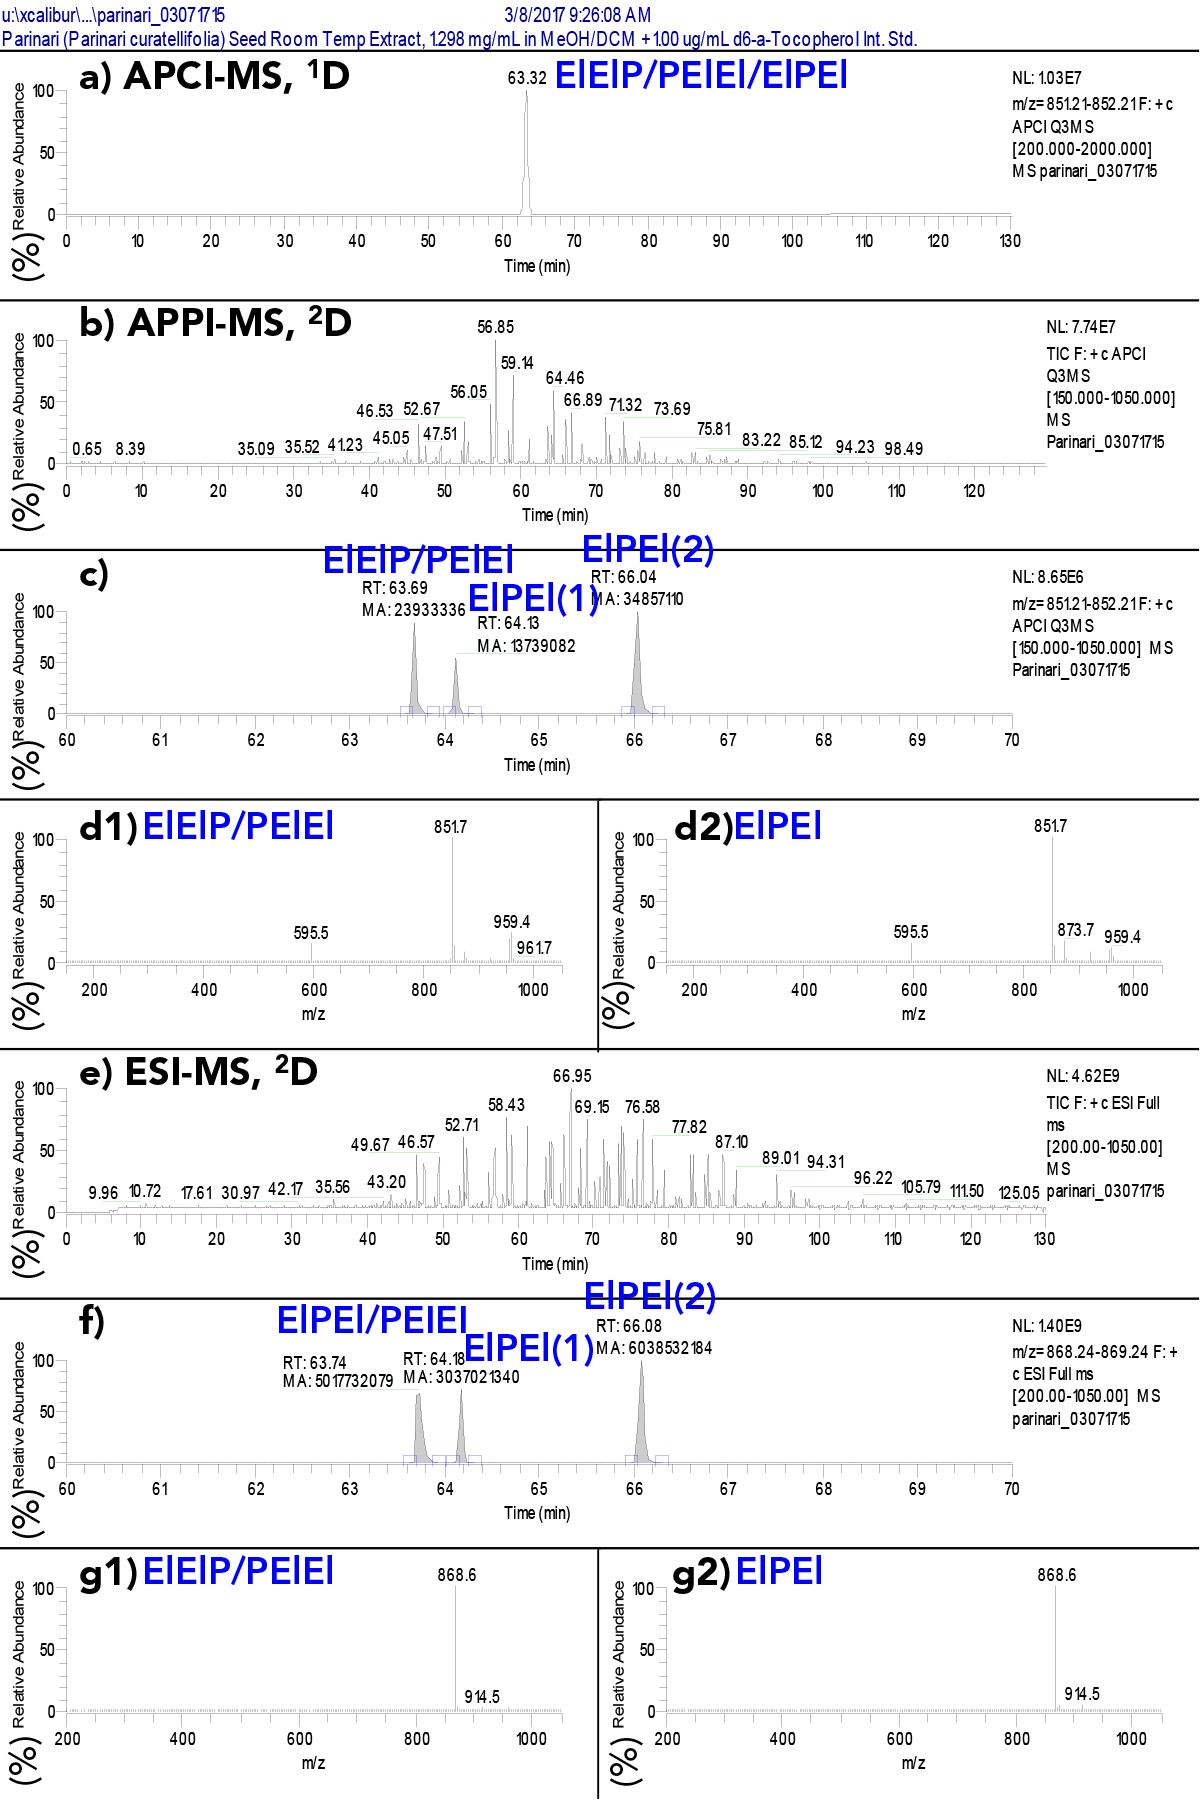
The dual parallel MS 2D chromatograms prior to transformation into modulation periods are shown in Figures S3b and 3e, and after transformation in the 3D chromatograms in Figure 2, with the peaks marked by red asterisks. In the expanded time range from 60 to 70 min for the EICs of the [M+H]+ at m/z 851.71 in Figure S3c, and the EIC of the [M+NH4]+ at m/z 868.74 in Figure S3f, the single peak was split into three peaks, with the last two peaks being separated by ~1.91 min. The first peak in each set is the earliest eluting regioisomer pair, ElElP and PElEl, which can only be separated by lengthy chiral chromatography. The second and third peaks are the later-eluting isomer ElPEl, which was split into two modulation periods, because of elution during a valve switch.
Because the raw 2D EICs are simple (Figures S3c and S3f), the peak areas were readily integrated and quantified, and the peak areas are shown in Figures S3c and S3f. These areas lead to the conclusion that the ElElP/PElEl/ElPEl regioisomers, which theoretically should be evenly distributed at 33.3%, were actually composed of ElElP + PElEl = 33% and ElPEl = 67.0% by APPI-MS and ElElP + PElEl = 35.6% and ElPEl = 64.4% by ESI-MS. This means there was twice as much ElPEl as statistically expected. The differences between quantification of regioisomers by APPI-MS and ESI-MS have been discussed in detail elsewhere (29) and an example of 2D-LC for identification of TAG regioisomers in Jacarand mimosifolia seed oil has been shown elsewhere (27).
LC1MS2 × (LC1MS1 + LC1MS1) = LC3MS4
Milk and infant formula analyses presented unique challenges compared to the seed oils described above. First, milk and formula contain many saturated (no double bonds in FAs) short-chain (SC) FAs that are essentially unretained on a silver-ion column, which depends on coordination of double bonds with the silver ions. Thus, silver-ion UHPLC as the 2D, described above, is ineffective for the saturated SC-FAs. Second, the 1D peaks for TAGs with SC-FAs are composed of typically one to four isomers made of different combinations of SC-FAs. Many of these are not separable using 1D NARP-HPLC, so a different approach was required for milk and formula.
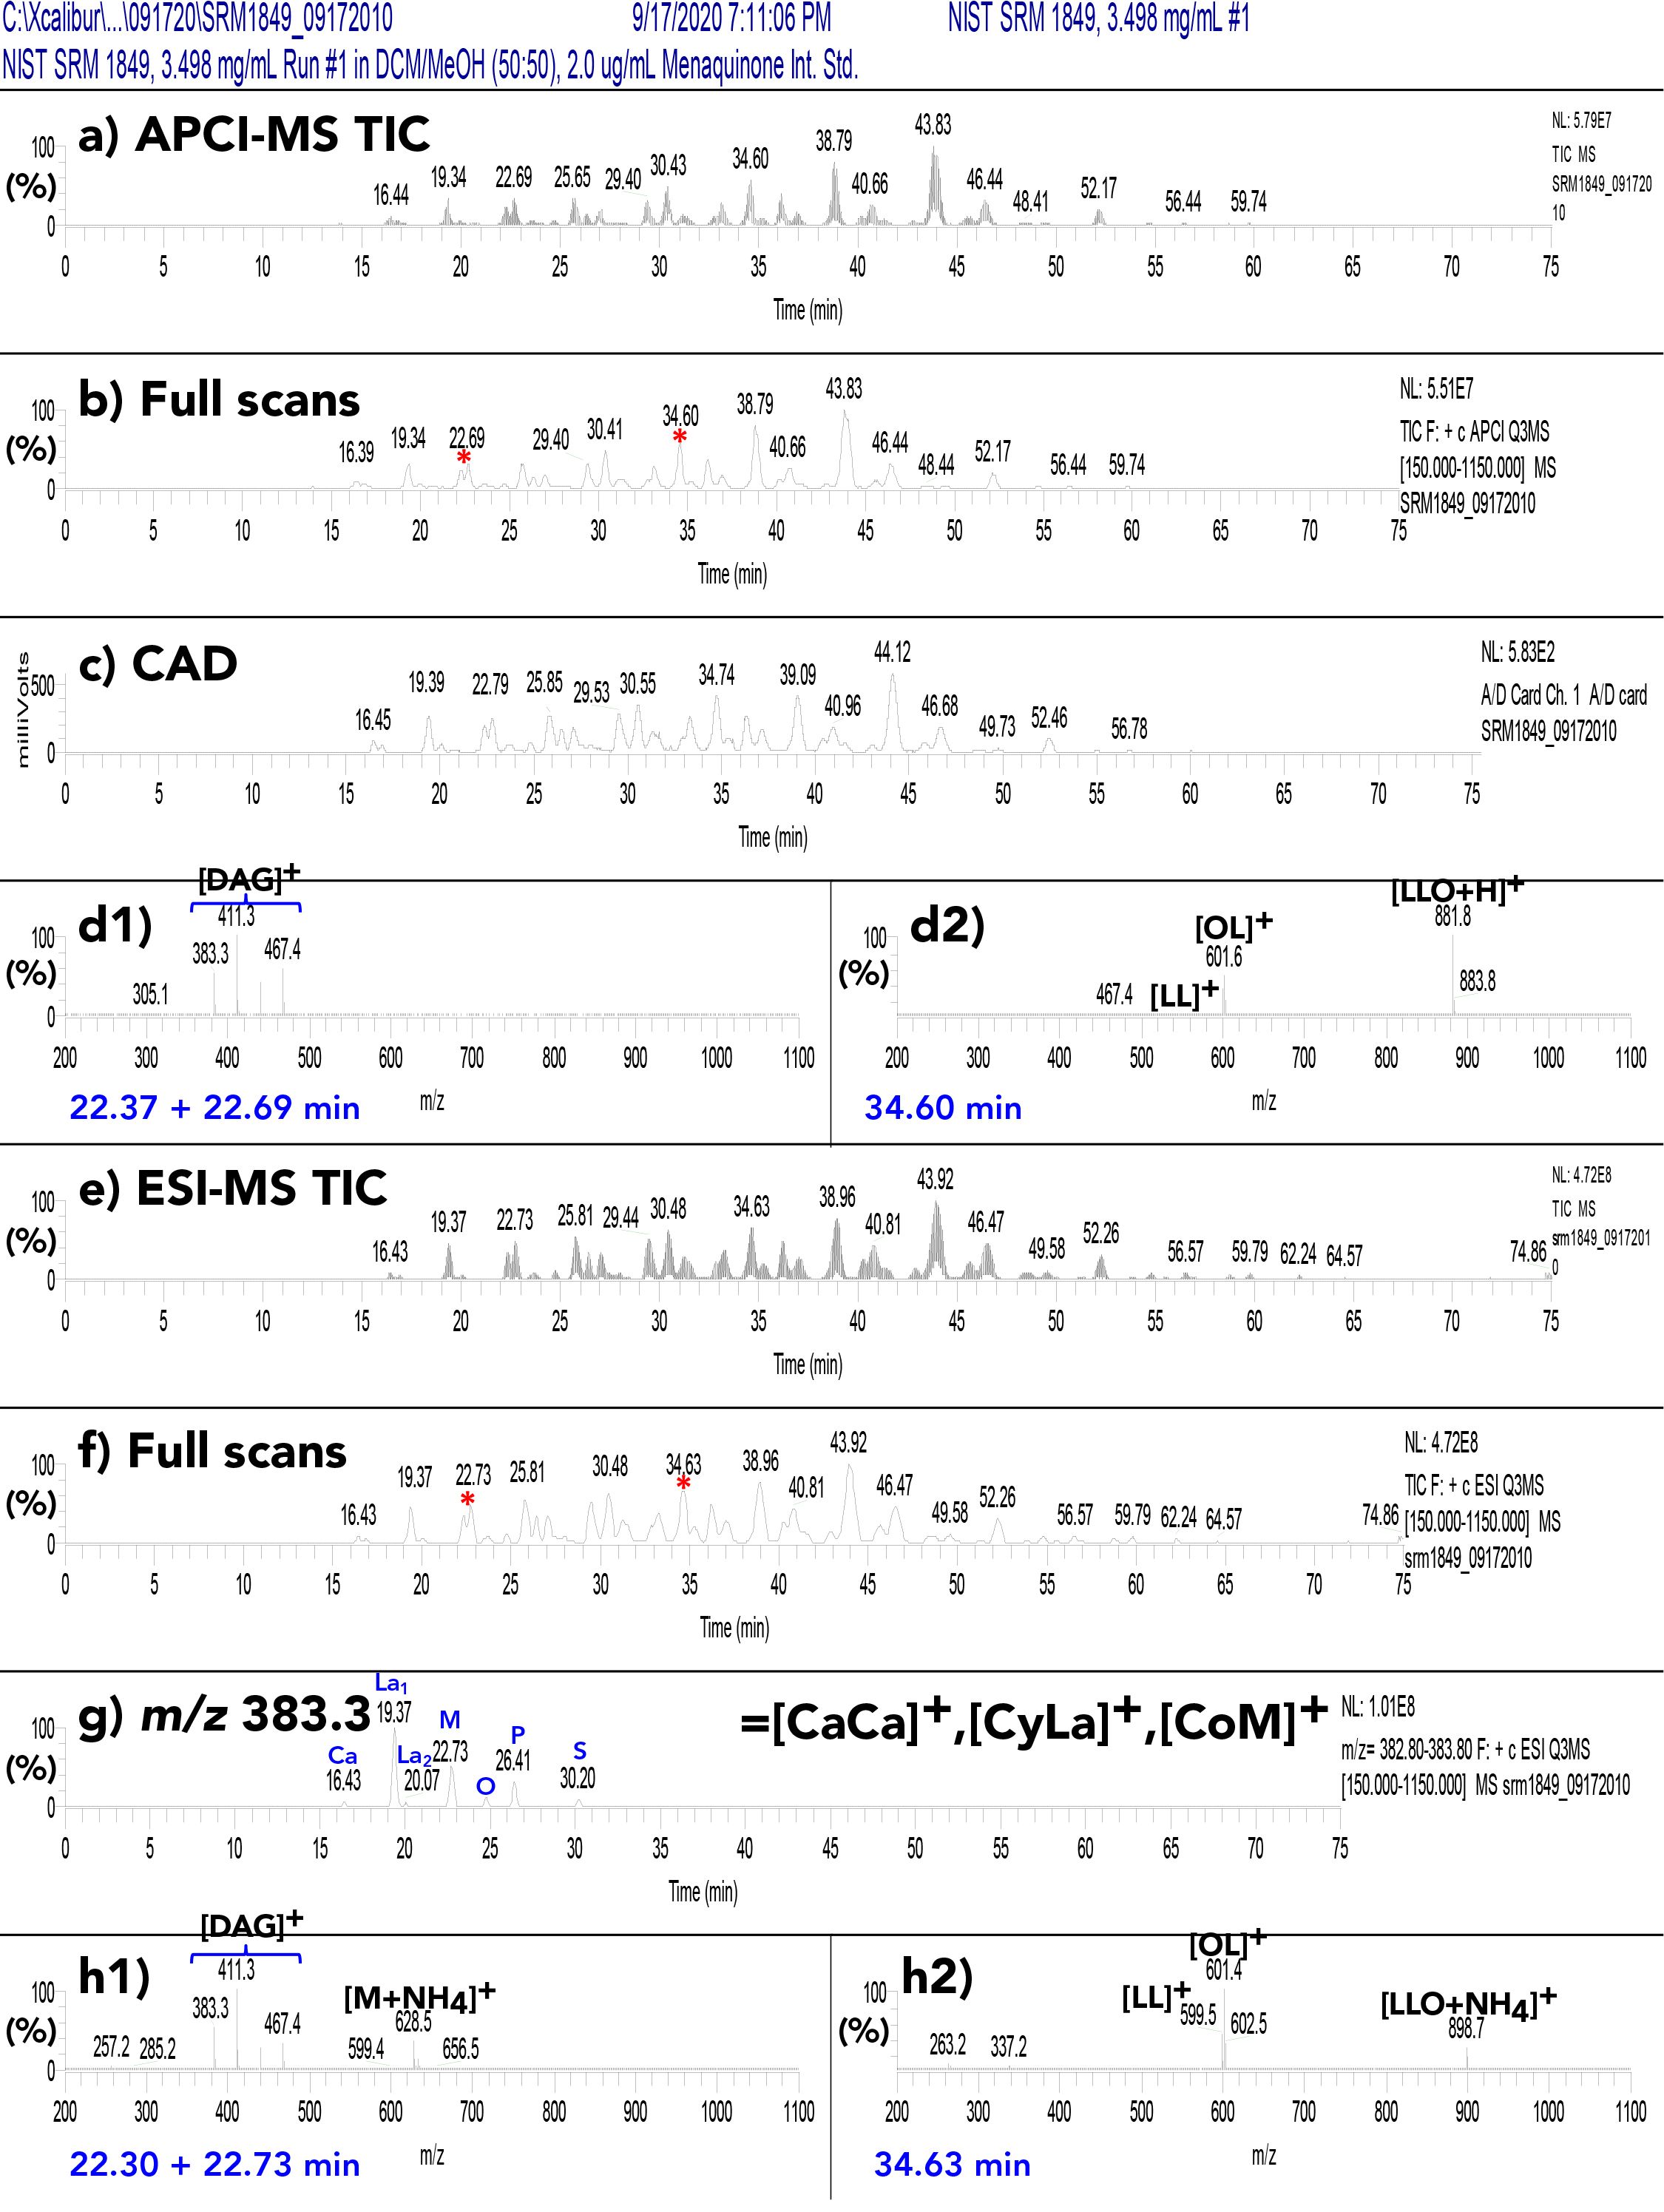
We used National Institute of Standards and Technology (NIST) standard reference material 1849a adult–infant formula as a model for milk and formula analysis. After testing multiple columns with varying stationary phases on standard reference material 1849a, we found that no alternative chemistries that provided better separation in the 2D than a C30 column. Figure S4 shows typical 1D chromatograms from parallel APPI-MS (Figure S4a, S4b, and S4d), ESI-MS (Figure S4e–h), and the CAD (FIGURE S4c). The APCI-MS mass spectra of SC saturated TAGs in Figure S4d1 shows no protonated molecule, highlighting the benefit in the “dual parallel mass spectrometry” approach, in which ESI-MS data were obtained simultaneously in parallel. The ESI-MS mass spectrum in FIGURE S4h1 clearly showed the intact [M+NH4]+ ion at m/z 628.5 (as well as the [M+Na]+ at m/z 633.5).
Figure S4: (a) Total ion current chromatogram (TIC) of NIST standard reference material 1849a by APCI-MS; (b) full-scan chromatogram; (c) corona charged aerosol detector (CAD) chromatogram; (d1) APCI-MS mass spectrum across peak pair at 22.28 and 22.69 min, representing LaCaLa + CaCaM + LaCyM; (d2) mass spectrum across peak at 34.60 min, representing LLO; (e) TIC by ESI-MS; (f) ESI-MS Full-scan chromatogram; (g) EIC of m/z 383.3 = [CaCa]+, [CyLa]+, and [CoM]+; (h1) ESI-MS mass spectrum across peak pair at 22.30 + 22.73 min, representing LaCaLa + CaCaM + LaCyM; (h2) mass spectrum across peak at 34.63 min, representing LLO. For fatty acyl chain abbreviations see Figure 4.
Fat-Soluble Vitamins (FSVs) in the 1D
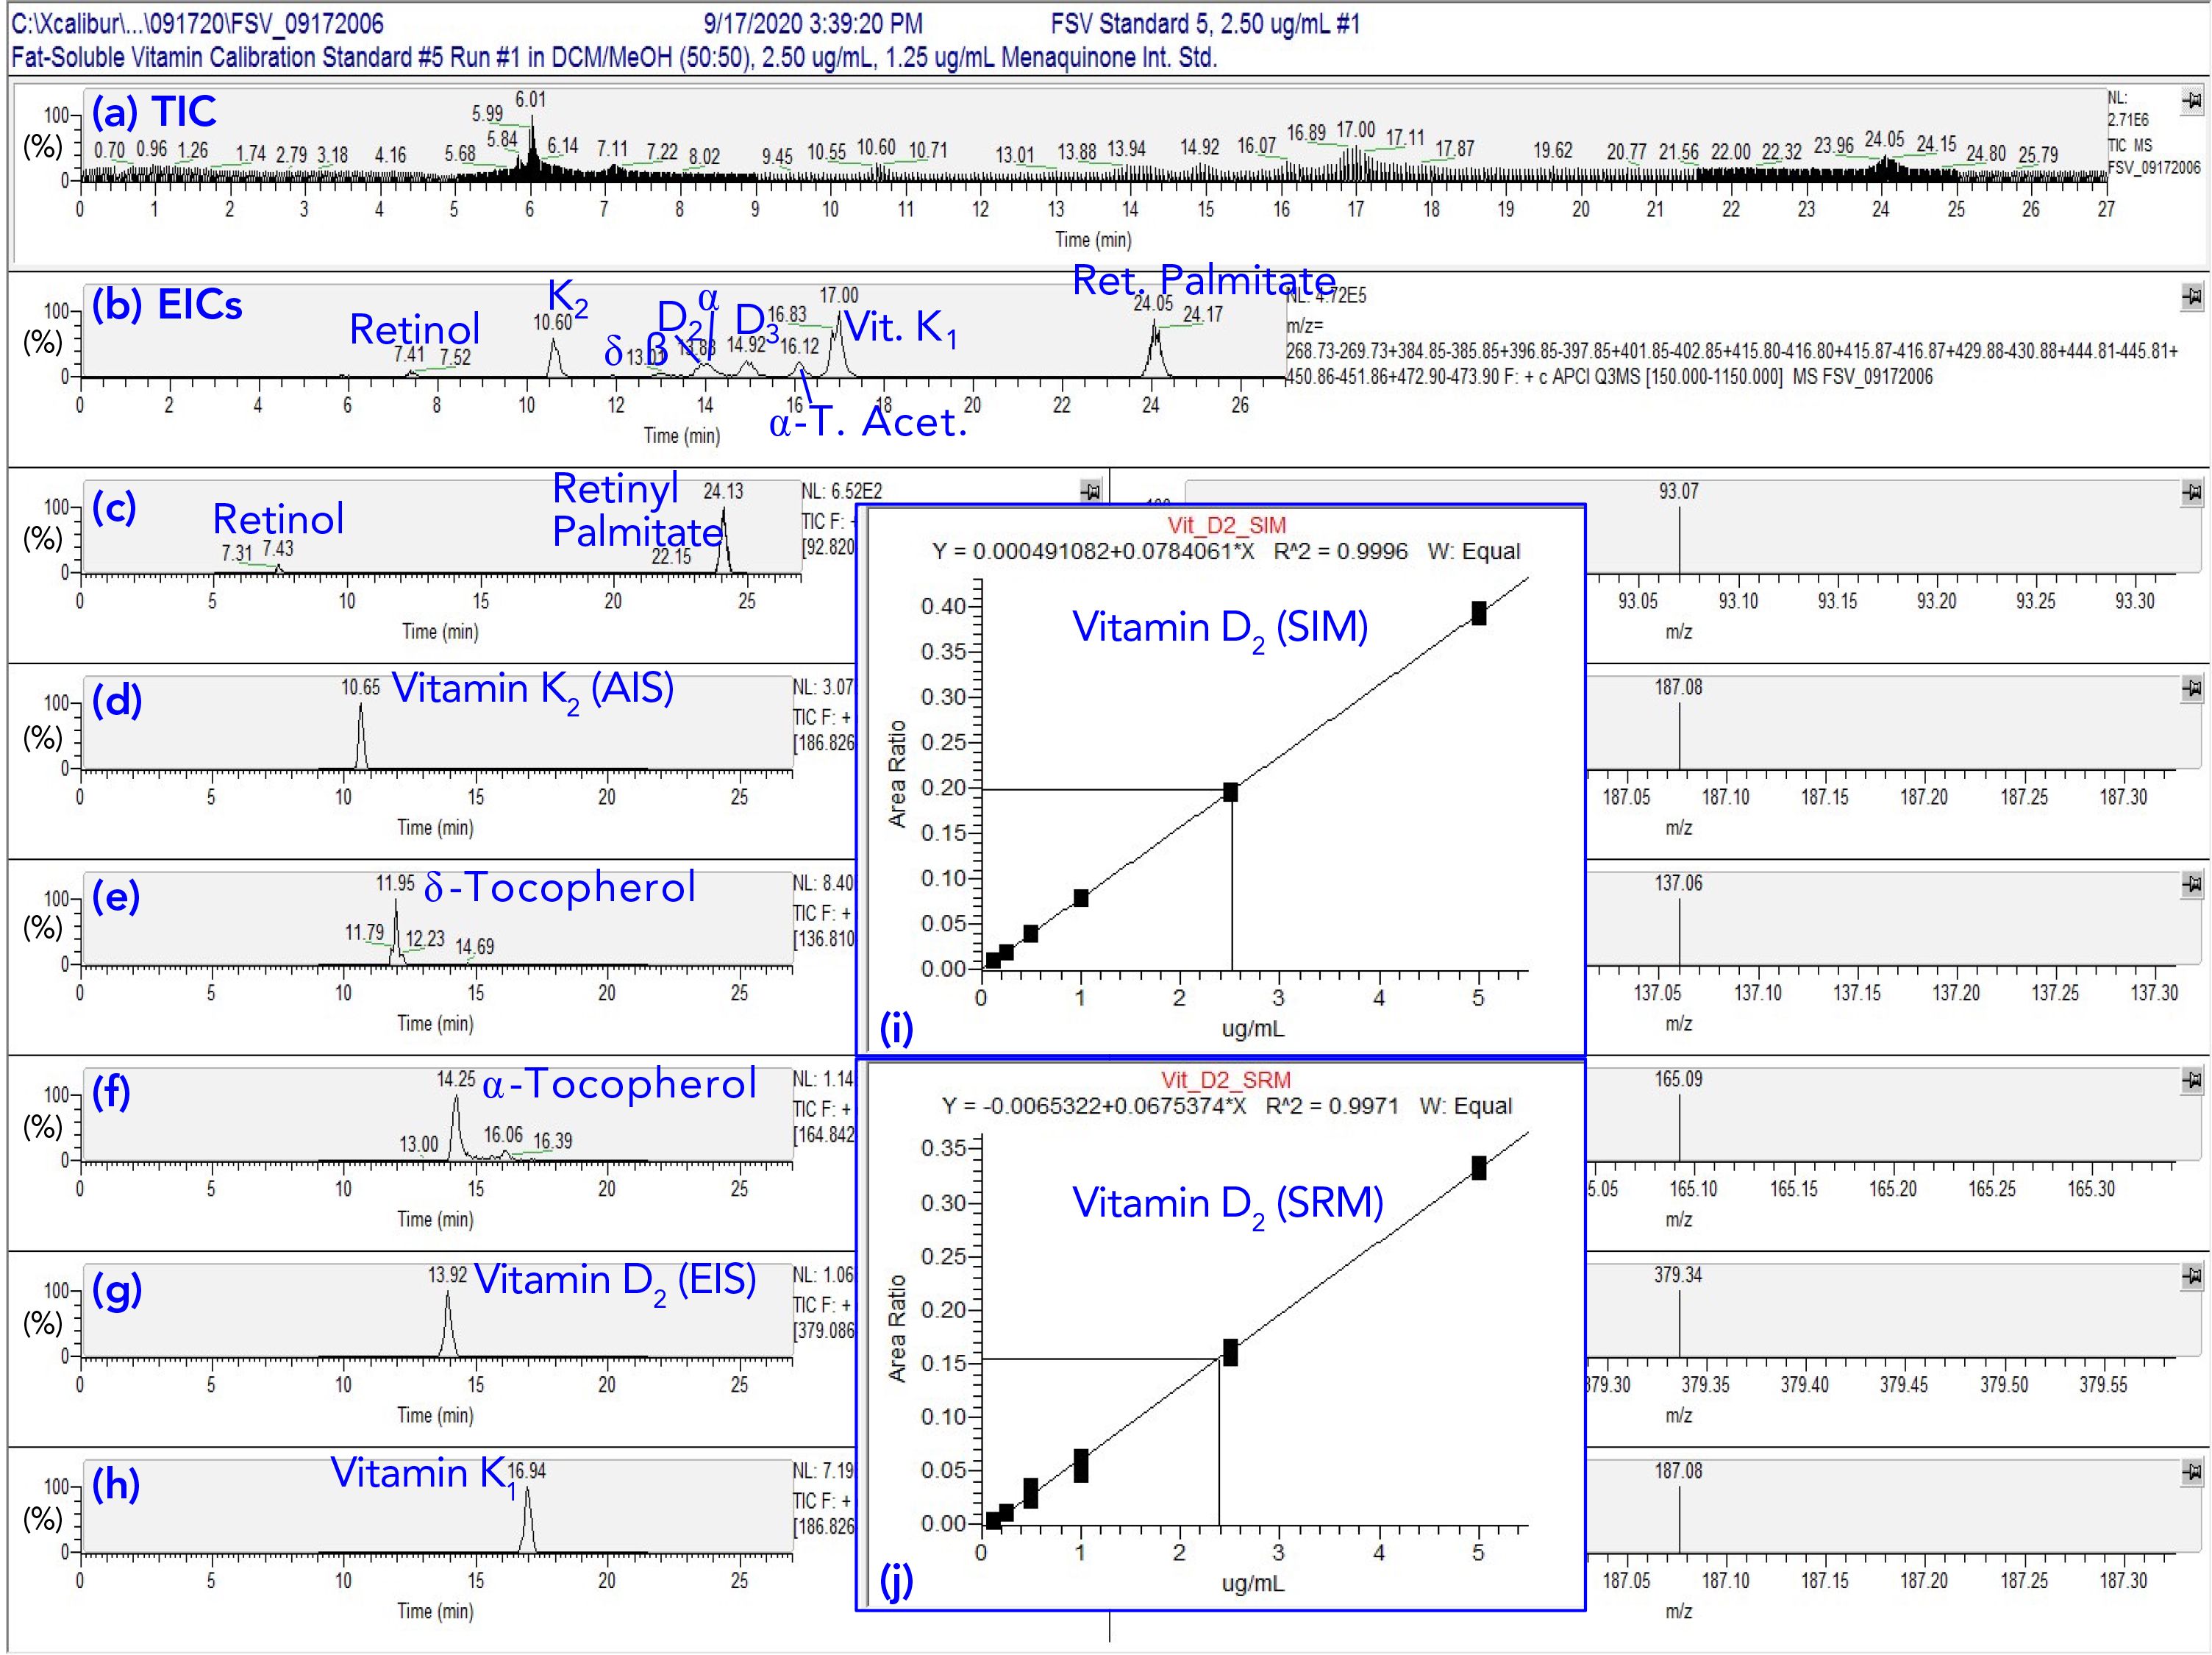
Figure S5 shows the chromatograms obtained from SRM of FSVs, as well as inset panels showing the resulting calibration lines from both SRM and SIM. Vitamin D2 was added to samples before extraction, as an extraction internal standard (EIS), and menaquinone, vitamin K2, was added to extracts before analysis as an analysis internal standard (AIS). As can be seen in Figure S5, most FSVs gave sharp peaks with good peak shapes. Peaks were integrated using conventional software, which overcame the problems with quantification using “blobs” in 2D chromatograms.
Figure S5: Fat-soluble vitamin (FSV) 27-minute run for quantification by APPI-MS selected reaction monitoring (SRM). (a) TIC of 2.5 ug/mL calibration standard; (b) EIC of masses for FSVs; (c) SRM chromatogram of m/z 269.227 =[Fragment]+ → m/z 93.070 for retinol and retinyl palmitate; (d) SRM chromatogram of m/z 445.310 =[M+H]+ → m/z 187.076 for menaquinone, vitamin K2, the analytical internal standard (AIS); (e) SRM chromatogram of m/z 402.350 =[M]+→ m/z 137.060 for δ-tocopherol; (f) SRM chromatogram of m/z 430.381 =[M]+ → m/z 165.092 for α-tocopherol; (g) SRM chromatogram of m/z 397.346 =[M+H]+ → m/z 379.336 for vitamin D2, the extraction internal standard (EIS); (h) SRM chromatogram of m/z 451.357 =[M+H]+ → m/z 187.076 for phylloquinone, vitamin K1; (i) calibration line for vitamin D2 by selected ion monitoring (SIM); (j) calibration line for vitamin D2 by SRM. Note that APPI-MS gave both [M]+ and [M+H]+ for tocopherols, and [M]+ was larger, so was used as SRM precursor ion.
TAGs in 2D(1)
The first 2D used the conventional approach of having peaks elute in one modulation period. Figure 3 shows the contour plot and 3D plot of the 2D(1). The first feature to notice is the sharp and rather symmetric peaks. The TED solvent was very effective at sharpening peaks, which were broad and indistinct in the absence of TED. The 2D(1) separation did a better job of separating overlapped TAGs containing short-chain FAs from TAGs having long-chain FAs.
TAGs in 2D(2)
The second 2D employed a multicycle elution strategy that is analogous to twin-column recycling chromatography (TCRC) (30), which employs two columns with a switching system that repeatedly transfers analytes from one column to another to effectively increase the length of column used without increasing the back pressure.
Instead of using two different physical columns and switching between them, our approach was to employ a single column, but allow analytes to remain on the column through multiple modulation cycles, which we refer to as multi-cycle chromatography, also known as “constructive wraparound chromatography.” In these experiments, triolein eluted in the 1D in the twenty-third modulation period and eluted from the 2D(2) in the twenty-seventh modulation period.
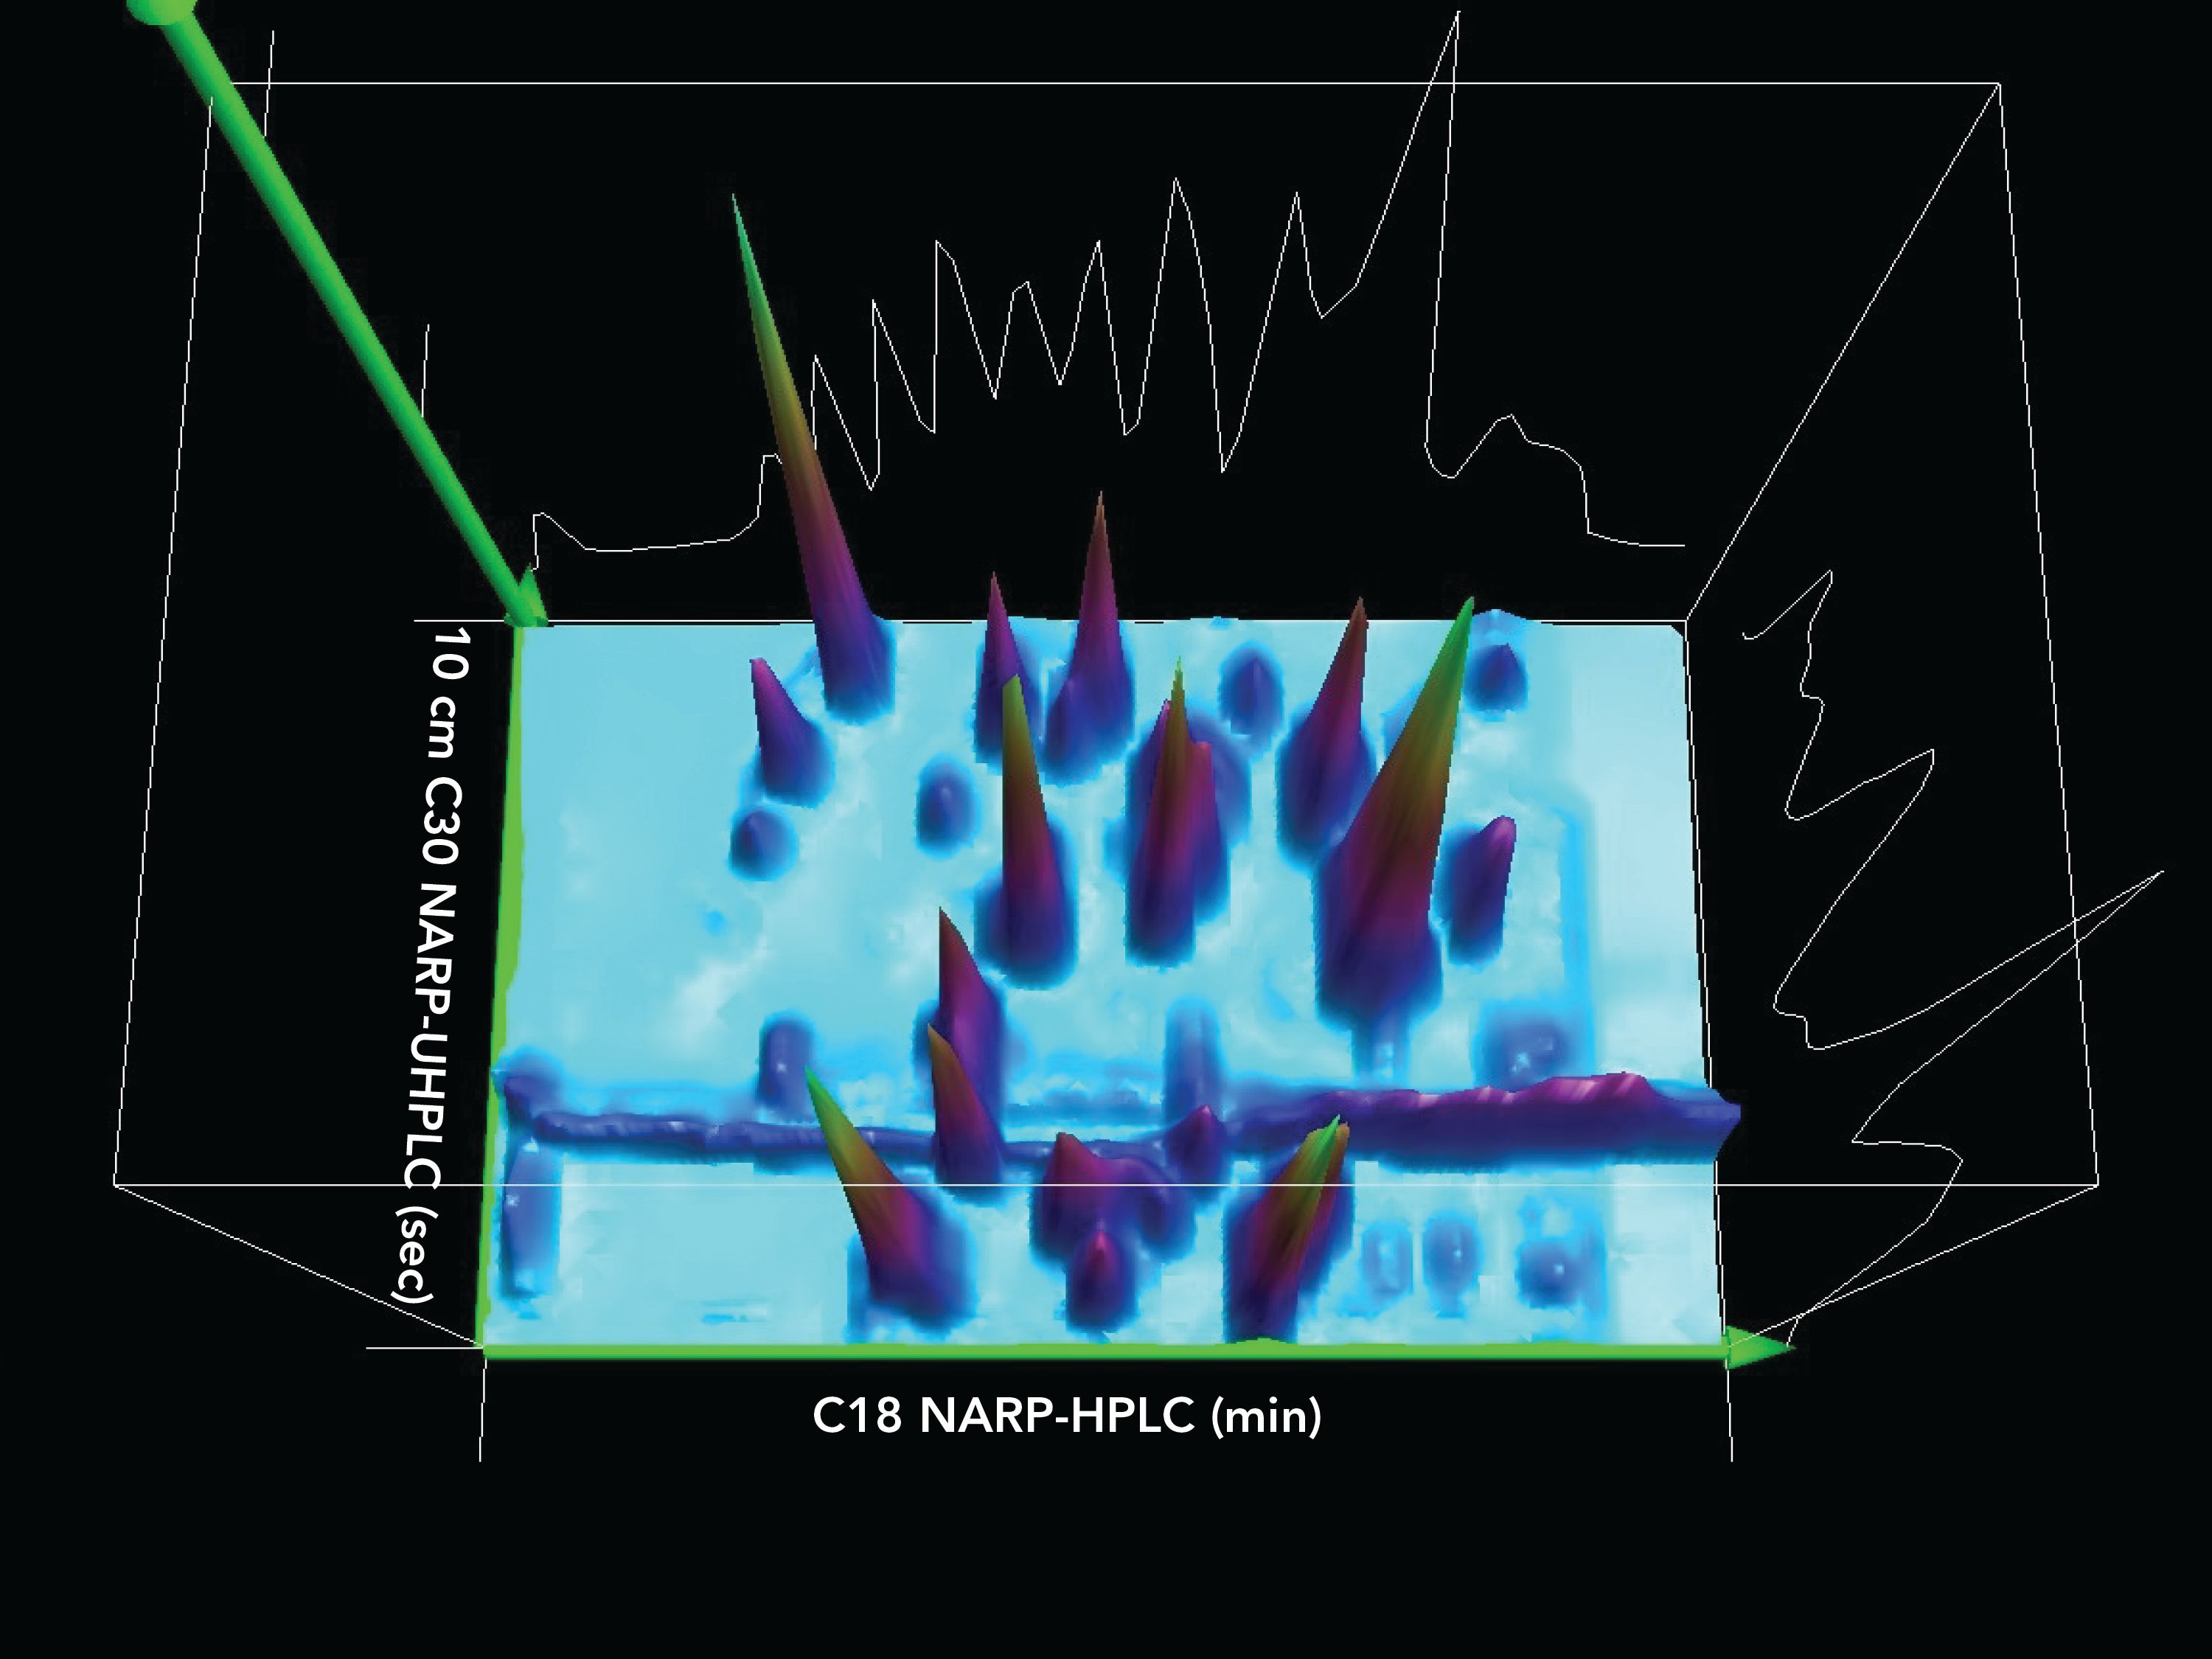
Figure 4 shows the contour plot for the 2D(2) separation of NIST standard reference material 1849a TAGs, while Figure 5 shows the associated 3D chromatogram. Even though several modulation periods elapsed, the components still produced fairly sharp and symmetric peaks, showing that the TED solvent was very effective at minimizing peak broadening despite large injection volumes and extended time on the column.
Figure 4: Contour plot of second second dimension separation, 2D(2), on 10.0 cm C30 column with detection by ESI-MS on QExactive high-resolution accurate–mass (HRAM) mass spectrometer. Abbreviations: Co: caproic acyl chain, 6:0 (carbon number:double bonds); Cy: caprylic acyl chain, 8:0; Ca: capric acyl, 10:0; La: lauric acyl, 12:0; M: myristic acyl, 14:0; P: palmitic acyl, 16:0; S: stearic acyl, 18:0; O: oleic acyl, 18:1Δ9: L: linoleic acyl, 18:2; Ln: linolenic acyl, 18:3; Va: vaccenic acyl, 18:1Δ7; El: α-eleostearic acyl, 18:3 (9c,11t,13t); A: arachidic acyl, 20:0; G: gadoleic acyl (20:1); B: behenic acyl, 22:0; E: erucic acyl, 22:1.
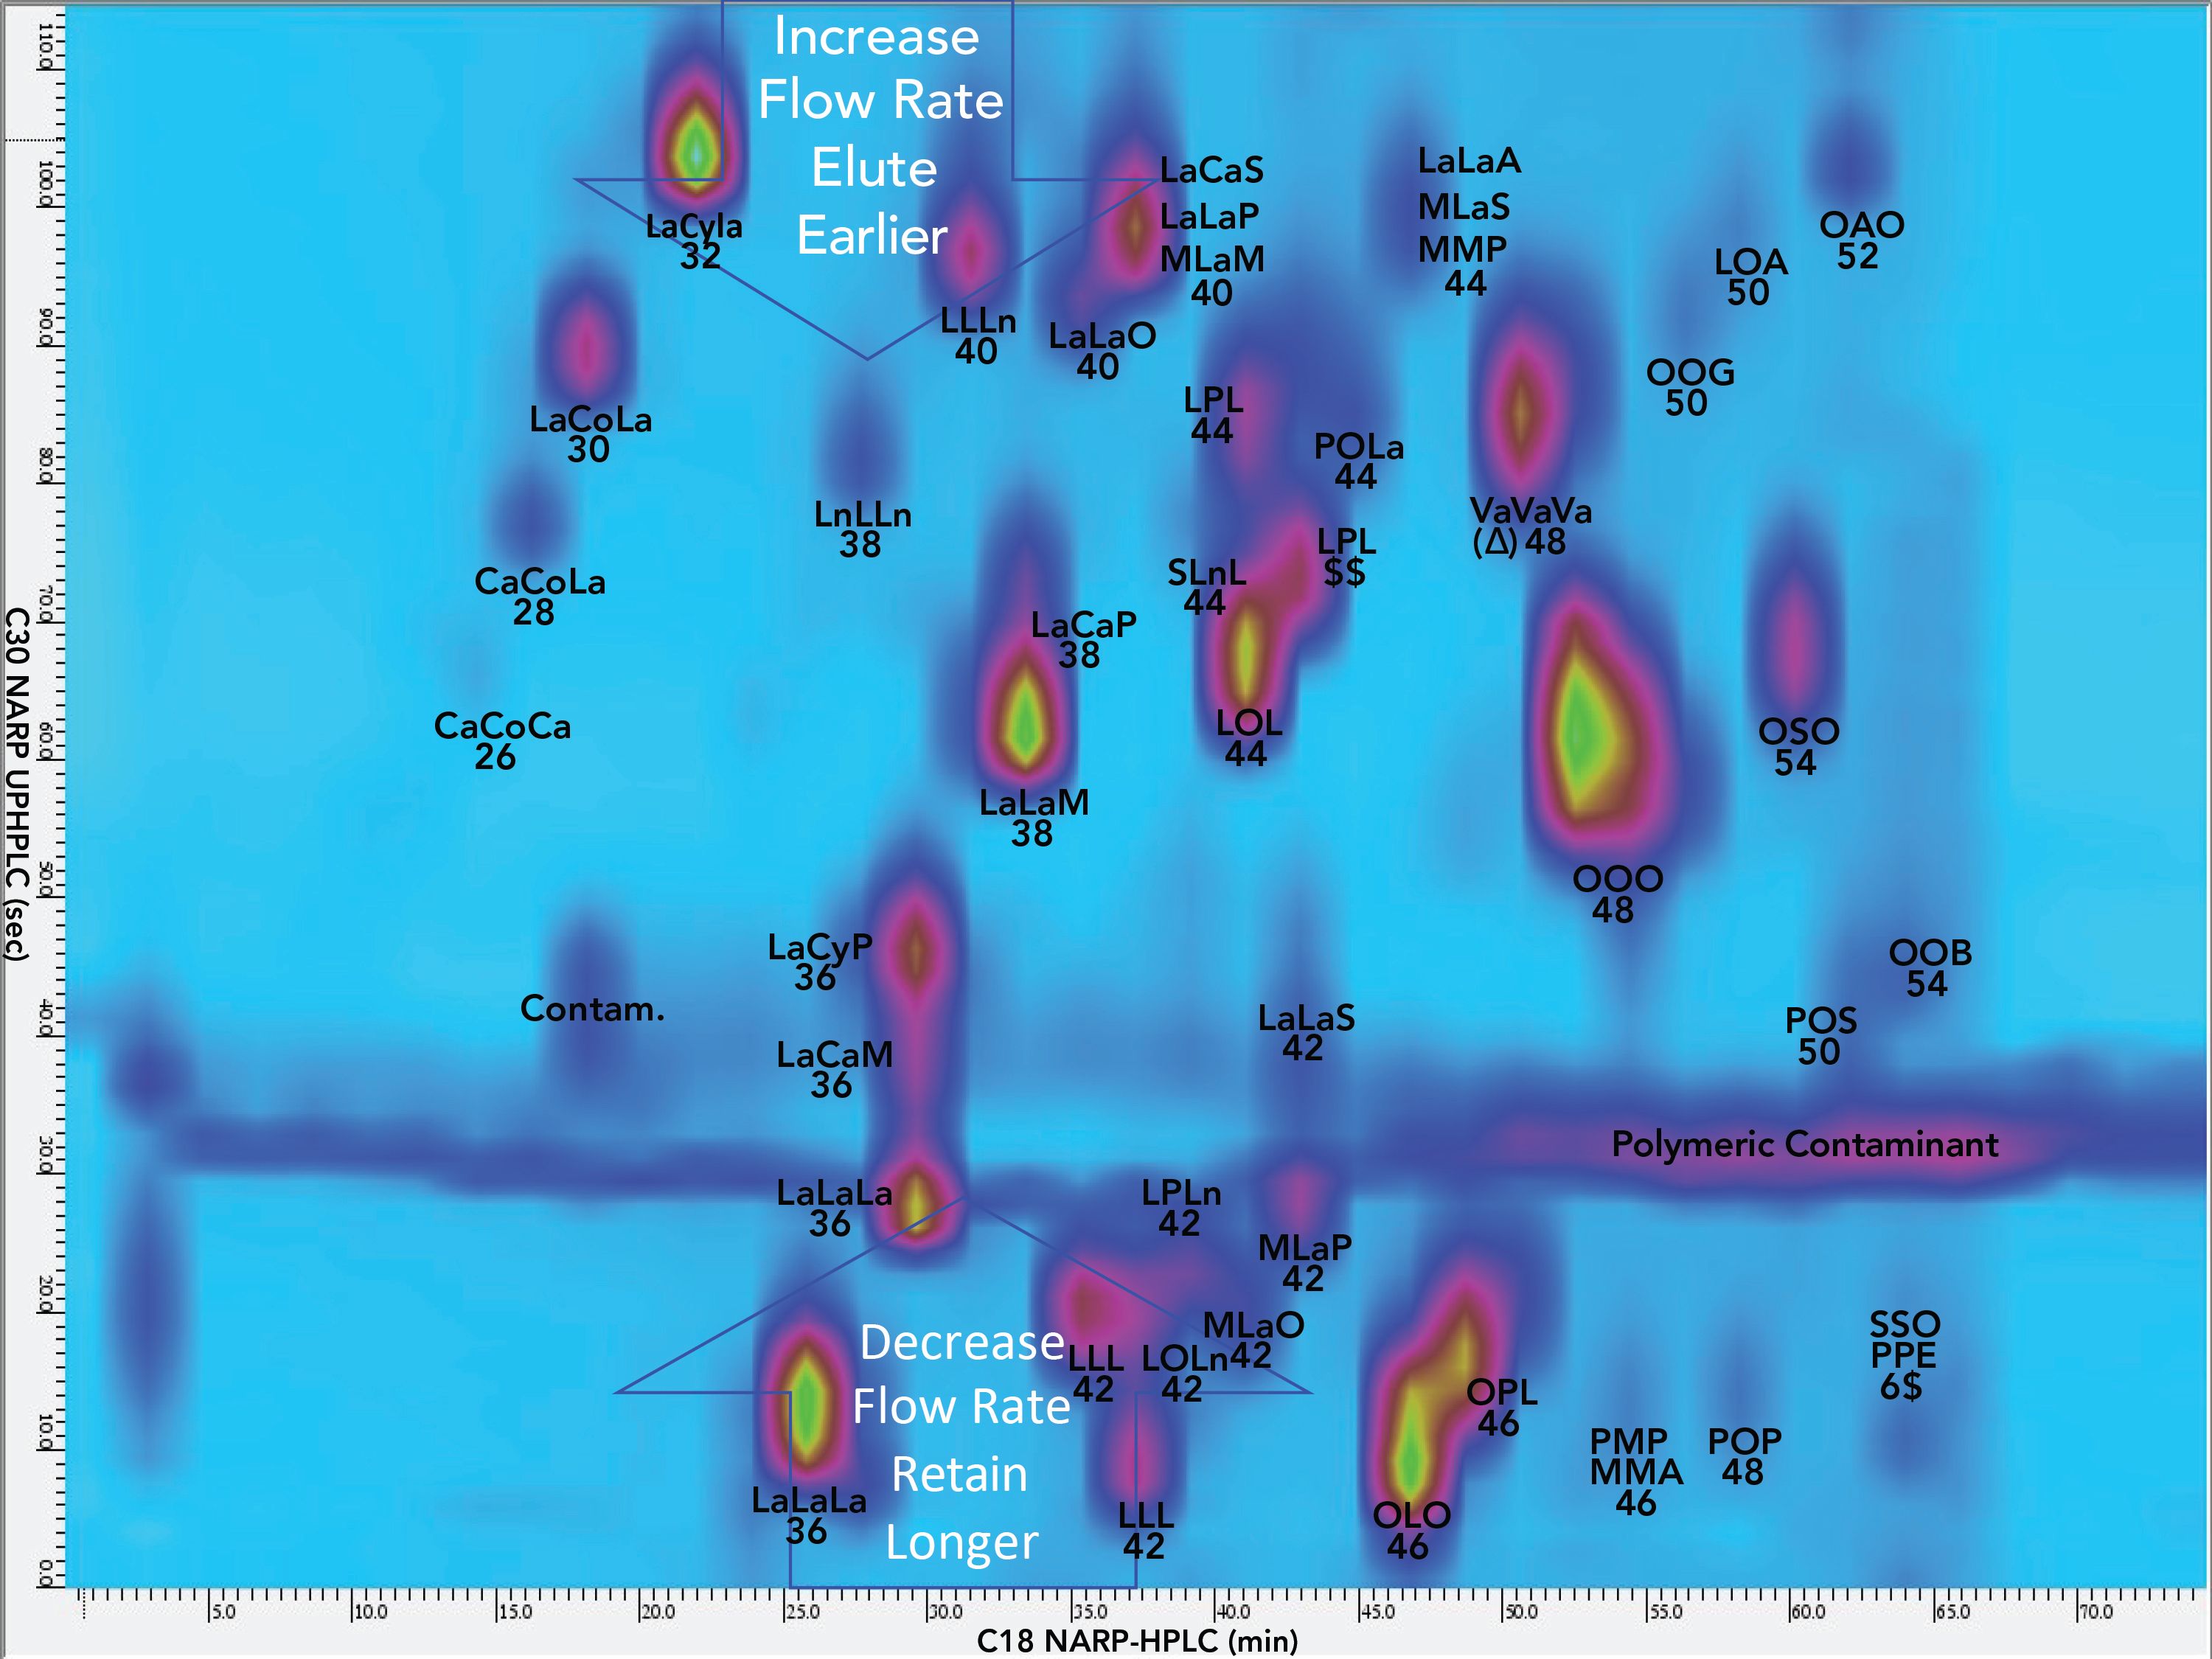
Figure 5: 3D chromatogram plot of second second dimension separation, 2D(2), on 10.0 cm C30 column with detection by ESI-MS on a QExactive HRAM mass spectrometer.
TAG Regioisomers
Unlike silver-ion chromatography, the NARP-UHPLC used in the 2D(2) was not effective to resolve regioisomers. Instead, critical ratios (CR) defined previously (28,29,31–33) were used for structural analysis of TAGs. CR 2 allowed us to identify regioisomers using the APPI-MS and ESI-MS/MS mass spectra. For instance, C10:0,C6:0,C10:0 (CaCoCa) gave a value below 50% for [CaCa]+, so Byrdwell CR analysis (BCRA) indicated that it was the sn-1,3 isomer. On the other hand, the TAG LaLaM (12:0,12:0,14:0) gave a [LaLa]+ fragment greater than 50%, so BCRA indicated that it was not the sn-1,3 isomer. It was the 1,2 and 2,3 isomers. BCRA also revealed that if “B” was shorter than “A”, then “B” was in the sn-2 position, and the isomer was ABA. Conversely, if “A” was shorter than “B”, then “B” was in the 1 or 3 position, and the isomer was AAB/BAA. Thus, the shortest FA was always in the sn-2 position, and if there were two short FAs, one was always in the sn-2 position and one was in an outside (1,3) position.
For Type III TAGs, BCRA used the fact that the [DAG]+ with the lowest abundance was the sn-1,3 isomer (34), so was labeled as [AC]+. Both Type II and Type III TAGs had structures in which the shortest FAs were in the sn-2 positions.
Flow Rate Programming
To make the appearance of 2D (and 3D) chromatograms more appealing, flow rate programming was used to make late-eluting peaks elute a little earlier and early eluting peaks elute a little later to avoid the edges of the 2D and 3D chromatograms, as shown in Figure 4.
Instrumental Limitations
Only a binary UHPLC could be configured and used in 2D OLCS version C.01.09. Also, the 2D-LC software did not allow flow rate programming like that used in the standalone 2D(2). One of the most important shortcomings, though, was the limit of 100 steps allowed in a method in the standalone 2D(2) (and the 1D), which limited our ability to emulate the shifted gradient used previously. Two 2D(2) methods had to be “stitched together” for each 1D run (data not shown). The use of a parallel gradient alleviated this shortcoming. Finally, a limit was also encountered in the complexity of 2D(1) runs using the 2D OLCS software. Complex 2D(1) methods failed to implement the gradient; it simply remained isocratic, because it overtaxed the 2D(1) binary pump.
Conclusions
The LC1MS2 × LC1MS2 = LC2MS4 data above clearly indicated that the combination of conventional 1D LC with dual parallel mass spectrometry, combined with SF-C2DLC allowed conventional quantification in the 1D using EICs, SIM, SRM, and UV. In the 2D, silver-ion UHPLC allowed separation of TAGs based on the degree of unsaturation and location, as well as type (cis/trans).
But silver-ion UHPLC was not useful for short-chain saturated TAG isomers. Samples like milk and infant formula were more challenging and required a different approach. To accomplish better separations of TAGs, we had to break many of the rules of conventional 2D-LC. We employed two parallel second dimensions; we used parallel gradients instead of shifted gradients; we used multi-cycle elution; we employed flow rate programming to optimize the appearance of chromatograms; and we pushed instrument capabilities past their designed limits.
Overall, these LC–MS experiments demonstrate several benefits of split-flow comprehensive multidimensional LC. The use of a TED solvent in an open split-flow system was very easy and inexpensive to implement, while being extremely effective at keeping peaks sharp and well resolved in the 2D. The SF-CM-DLC approach allowed the use of up to six detectors simultaneously in the 1D, meaning that conventional quantification could be used, and that the problems with under-sampling the first dimension to reproduce the second dimension were completely bypassed. This allowed much greater flexibility and longer run times in the 2D runs, opening new opportunities for innovative separation strategies.
References
(1) J.C. Giddings, Anal. Chem. 56(12), 1258A–1264A (1984).
(2) D.R. Stoll et al., J. Chromatogr. A 1168(1–2), 3–43 (2007).
(3) P. Schoenmakers, B. Pirok, K. Sandra, and A. DeVilliers, The Analytical Scientist (2019). Available at: https://theanalyticalscientist.com/techniques-tools/the-coming-of-age-of-2d-lc. (Accessed: 25th September 2020)
(4) F. Bedani, P.J. Schoenmakers, and H.G. Janssen, J. Sep. Sci. 35(14), 1697–1711 (2012).
(5) B.W.J. Pirok, D.R. Stoll, and P.J. Schoenmakers, Anal. Chem. 91(1), 240–263 (2019).
(6) B.W.J. Pirok, A.F.G. Gargano, and P.J. Schoenmakers, J. Sep. Sci. 41(1), 68–98 (2018).
(7) B.W.J. Pirok and P.J. Schoenmakers, LCGC Eur. 31(5), 242–249 (2018).
(8) D.R. Stoll and T.D. Maloney, LCGC North Am. 35(9), 680–687 (2017).
(9) D.R. Stoll, Bioanalysis 7(24), 3125–3142 (2015).
(10) F. Cacciola, F. Rigano, P. Dugo, and L. Mondello, TrAC - Trends Anal. Chem. 127(6), 115894 (2020).
(11) F. Cacciola, M. Russo, L. Mondello, and P. Dugo, Compr. Anal. Chem. 79, 81–123 (2018).
(12) D.R. Stoll and P. W. Carr, Anal. Chem. 89(1), 519–531 (2017).
(13) Z. Wu, P. Schoenmakers, and P.J. Marriott, LCGC Eur. 25(5), 272–275 (2012).
(14) W.C. Byrdwell, J. Chromatogr. A 1217(25), 3992–4003 (2010).
(15) W.C. Byrdwell, Anal. Bioanal. Chem. 401(10), 3317–3334 (2011).
(16) W.C. Byrdwell, J. Chromatogr. A 1320, 48–65 (2013).
(17) W.C. Byrdwell, in Modern Methods for Lipid Analysis by Liquid Chromatography/ Mass Spectrometry and Related Techniques, W.C. Byrdwell, Eds. (AOCS Press, 2005), 298–412.
(18) W.C.Byrdwell, in Extreme Chromatography: Faster, Hotter, Smaller, W.C. Byrdwell and M. Holčapek, Eds. (AOCS Press, 2011), 255–299.
(19) W.C. Byrdwell, in Handbook of Advanced Chromatography/Mass Spectrometry Techniques, M. Holčapek and W.C. Byrdwell, Eds. (Elsevier/AOCS Press, 2017), 365–405.
(20) W.C. Byrdwell, Lipid Technol. 27(7), 151–154 (2015).
(21) J. Folch, M. Lees, and G.H. Sloane-Stanley, J. Biol. Chem. 226, 497–509 (1957).
(22) W.C. Byrdwell, Anal. Chem. 89(19), 10537–10546 (2017).
(23) W.C. Byrdwell, J. Lab. Autom. 19(5), 461–467 (2014).
(24) W.C. Byrdwell, W.E. Neff, and G.R. List, J. Agric. Food Chem. 49(1), 446–457 (2001).
(25) W.C. Byrdwell, BMC Res. Notes 12(1), 477 (2019).
(26) A.A. Aly et al., J. Chromatogr. A 1628, 461452 (2020).
(27) W.C. Byrdwell, Chromatogr. Today May/June(June 13), 56–64 (2018).
(28) W.C. Byrdwell, Lipid Technol. 27(11), 258–261 (2015).
(29) W.C. Byrdwell, J. Am. Oil Chem. Soc. 92(11–12), 1533–1547 (2015).
(30) Q. Liu et al., J. Chromatogr. A 1363, 236–241 (2014).
(31) W. C. Byrdwell, Lipids 40(4), 383–417 (2005).
(32) W. C. Byrdwell, Anal. Bioanal. Chem. 407(17), 5143–5160 (2015).
(33) W. C. Byrdwell, Lipids 51(2), 211–227 (2016).
(34) H. R. Mottram and R. P. Evershed, Tetrahedron Lett. 37(47), 8593–8596 (1996).
William Craig Byrdwell is with the Methods and Application of Food Composition Laboratory at the Agricultural Research Service, U.S. Department of Agriculture, in Beltsville, Maryland. Direct correpondence to: Craig.Byrdwell@usda.gov.

New Method Explored for the Detection of CECs in Crops Irrigated with Contaminated Water
April 30th 2025This new study presents a validated QuEChERS–LC-MS/MS method for detecting eight persistent, mobile, and toxic substances in escarole, tomatoes, and tomato leaves irrigated with contaminated water.

.png&w=3840&q=75)

.png&w=3840&q=75)


.png&w=3840&q=75)


.png&w=3840&q=75)


