Trace-Level Organochlorine and Organophosphorus Pesticides Analysis by SBSE–GC–TOFMS and SBSE–GCxGC–TOFMS
Special Issues
Gas chromatography and comprehensive two-dimensional gas chromatography with time-of-flight mass spectrometry (GC–TOFMS and GCxGC–TOFMS) were utilized to develop trace-level calibration curves in brewed green tea spiked with organochlorine and organophosphorus pesticide standards. A sensitive and robust calibration curve was developed from 10 to 500 parts per trillion (ppt), which allowed quantitative results to be determined for organochlorine–organophosphorus pesticides in brewed green tea. Exceptional limits of detection were achieved by GC–TOFMS and GCxGC–TOFMS at or below 10 ppt (solution concentration) for all but one of the pesticides. Stir bar sorption extraction (SBSE) was utilized to isolate the pesticide components from brewed green tea samples prior to analysis by GC–TOFMS and GCxGC–TOFMS. Different types of green tea were analyzed qualitatively by SBSE and GC–TOFMS with subsequent quantification for organochlorine–organophosphorus..
Gas chromatography and comprehensive two-dimensional gas chromatography with time-of-flight mass spectrometry (GC–TOFMS and GCxGC–TOFMS) were utilized to develop trace-level calibration curves in brewed green tea spiked with organochlorine and organophosphorus pesticide standards. A sensitive and robust calibration curve was developed from 10 to 500 parts per trillion (ppt), which allowed quantitative results to be determined for organochlorine–organophosphorus pesticides in brewed green tea. Exceptional limits of detection were achieved by GC–TOFMS and GCxGC–TOFMS at or below 10 ppt (solution concentration) for all but one of the pesticides. Stir bar sorption extraction (SBSE) was utilized to isolate the pesticide components from brewed green tea samples prior to analysis by GC–TOFMS and GCxGC–TOFMS. Different types of green tea were analyzed qualitatively by SBSE and GC–TOFMS with subsequent quantification for organochlorine–organophosphorus pesticides.
In addition, SBSE coupled with comprehensive GCxGC–TOFMS was conducted on one type of green tea spiked with organochlorine–organophosphorus pesticides at 10–500 ppt levels. GCxGC offers dual column orthogonal separation, which delivers enhanced resolution, increased detectability, and more available peak capacity. The benefit of coupling GCxGC with TOFMS includes acquiring full range nonskewed mass spectral information for all chromatographic peaks. This article presents the results of the GC–TOFMS and GCxGC–TOFMS trace-level pesticides analysis.
Experimental
SBSE–GC–TOFMS
Analytical results were generated with a LECO Pegasus 4D TOF-MS system. The Pegasus GC–TOFMS instrument was equipped with an Agilent (Wilmington, Delaware) 6890 gas chromatograph featuring a multipurpose autosampler (MPS2), a thermal desorption unit (TDU), a cryogenic inlet system (CIS4), and a GERSTEL/MACH low thermal mass (LTM) oven. LECO ChromaTOF software was used for all instrument data acquisition, calibration curve development, peak identification, and data quantification. A 10 m × 0.18 mm, 0.20-μm film thickness (Rtx-5, Restek Corp., Bellefonte, Pennsylvania) MACH/LTM capillary column was used for the chromatographic separation. The GC system was operated with helium carrier gas at a corrected constant flow of 1 mL/min. The organochlorine–organophosphorus pesticides standards were spiked in various brands of brewed green tea from 10 to 500 ppt. Aliquots (10 mL) of different brewed green tea spiked with organochlorine–organophosphorus pesticides were stir-bar extracted at 1000 rpm for 60 min. The individual stir bars were placed in a clean quartz tube and then placed in an automatic tube exchanger (ATEX). The tube containing the stir bar was placed in the thermal desorption unit automatically by the autosampler for sample desorption and analysis. Thermal desorption was followed by sample focusing in the cryogenically cooled inlet before introduction onto the GC column. The chromatographic temperature program for the oven module was set at an initial temperature of 40 °C for 2.00 min and then ramped at 50 °C/min to 300 °C with a 1.00-min hold time, for a total chromatographic run time of 8.2 min. The GC oven was maintained at an isothermal temperature of 300 °C. The MS transfer line temperature was set to 280 °C. The MS mass range was 50–510 amu with an acquisition rate of 20 spectra/s. The ion source chamber temperature was set to 230 °C, and the detector voltage was 1800 V with electron energy of -70 eV.
SBSE–GCxGC–TOFMS
Analytical results for the GCxGC analysis were also generated with a Pegasus 4D TOFMS system. The same 10-m Rtx-5 MACH/LTM capillary column used for the GC–TOFMS analysis was used as the primary column for the GCxGC–TOFMS analysis. However, in the GCxGC configuration, a second column (1 m × 0.10 mm, 0.10-mm film thickness, Rtx-17, Restek Corp.) was placed inside the GC oven after the thermal modulator. The MACH/LTM column was programmed with an initial temperature of 40 °C for 2.00 min and ramped at 8 °C/min to 300 °C for 1 min. The GC oven was set to an initial temperature of 45 °C for 2.00 min and then ramped at 8 °C/min to 305 °C with a 1-min hold time. The thermal modulator was set to +30 °C relative to the primary oven, and a modulation time of 4 s was used. The MS mass range was 45–550 amu with an acquisition rate of 150 spectra/s. The ion source chamber was set to 230 °C, and the detector voltage was 1800 V with an electron energy of -70 eV. GCxGC data were processed in ChromaTOF software.
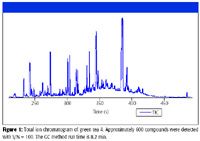
Figure 1
Results and Discussion
Analysis of brewed green tea was carried out in duplicate on both the GC–TOFMS and the GCxGC–TOFMS system. Six-point calibration curves (10–500 ppt) were developed by spiking known concentrations of organochlorine and organophosphorus pesticides in the post-brewed tea before SBSE extraction. The extraction efficiency of SBSE is based upon the Log Kow of each compound. Analytical results shown here do not account for the loss in extraction efficiency. Fresh brewed green tea samples were then extracted and analyzed for pesticides. Correctly identified pesticides were quantified against the reference calibration curves. Calculated concentrations are based upon the initial concentration in solution in parts per trillion, and extracted results are back calculated assuming 100% recovery. Quantitative results indicate that the various green tea types tested showed no significant concentrations of organochlorine and organophosphorus pesticides. However, three brands of green tea did show trace levels of pesticide residue at parts-per-trillion to low parts-per-billion levels. This study is not intended to place any significance or implications on the toxicological effects of these findings. Figure 1 displays the total ion chromatogram for the analysis of brewed green tea by GC–TOFMS. Approximately 550–600 compounds were found with a signal-to-noise ratio (S/N) of 100 with a run time of 8.2 min even with peak overlap of the complex sample matrices. TOFMS is able to acquire full-range nonskewed mass spectra at full-range sensitivity. This feature allows for identification of coeluted compounds in complex sample matrices. Deconvolution is performed through algorithms, which assign a unique mass for each peak that successfully identify and quantify all targeted compounds in a single run.
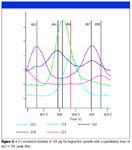
Figure 2
Figure 2 shows a 3-s zoomed-in single-dimension chromatogram of the quantification mass m/z = 353 for heptachlor epoxide (peak 486) and four other unique masses of matrix interferences. Peak 486 at 408.3 s represented by the red peak marker at mass 353 amu is a 100-ppt spike of hepatchlor epoxide in brewed green tea. Interfering unique masses m/z = 174, 100, 204, and 223 are shown for coeluted and matrix interference peaks. Notice that heptachlor epoxide is completely buried in the peak with mass m/z = 174. The heptachlor epoxide peak is submerged with matrix interference compounds, making identification difficult without deconvolution. This demonstrates the ability to locate and deconvolute trace concentrations of analytes at low parts-per-trillion levels in complex matrices.
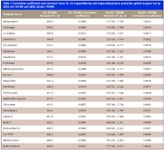
Table I
Figure 3 shows in detail the automated mass spectral deconvolution process for heptachlor epoxide. Figure 3a, the total ion chromatogram (Caliper) mass spectrum, shows the full range of all masses collected at 408.3 s. Figure 3b, the deconvoluted (peak true) mass spectrum, is the true mass spectrum for the peak identification with the matrix interference masses subtracted. Figure 3c displays the (library hit) mass spectrum for heptachlor epoxide. It is the deconvoluted mass spectrum (Figure 3b) that is searched against the library. The deconvoluted mass spectrum clearly shows fragment ions such as m/z 353, 317, 263, and 81 that are observed in the library spectral match (Figure 3c). The matrix interfering masses shown in the Caliper spectra are removed from the deconvoluted peak true mass spectra using the deconvolution algorithm that combines only nonskewed mass spectral data together. A similarity match score of 805 out of 1000 was returned for heptachlor epoxide at 100 ppt.
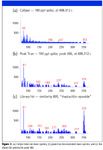
Figure 3
GCxGC–TOFMS Analysis
The GCxGC–TOFMS chromatogram in Figure 4 clearly illustrates the increase in peak capacity as opposed to one-dimensional GC–TOFMS for the organochlorine and organophosphorus pesticides analysis. Over 1200 peaks were found in this sample utilizing a data processing method with a S/N of 100. Both planes of the separation are clearly labeled with a first-dimension retention time (x axis) of approximately 2200 s and a second-dimension retention time (y axis) of 4 s. In GCxGC, the analytes are separated by volatility in the first dimension and by polarity in the second dimension. Peaks are displayed on the contour plot with blue being the baseline and red being the most intense peaks. The contour plot shows the ability of GCxGC to separate and resolve additional components in the second dimension that would otherwise be coelutions.
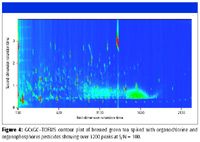
Figure 4
Calibration Curve Development
Pesticide calibration standards were prepared and spiked into brewed green tea at parts-per-trillion levels. Two injections of each SBSE extracted standard were made to develop calibration curves at the following concentrations: 10, 25, 50, 100, 250, and 500 ppt. The calibration curves were utilized to examine and quantify trace-level organochlorine and organophosphorus pesticide residues in five types of green tea. A complete list of all organochlorine and organophosphorus pesticides with retention times and correlation coefficients is provided in Table I for both the GC–TOFMS and GCxGC–TOFMS analysis.
Shown in Figure 5 is the full-range six-point calibration curve acquired for ethoprophos and developed from two data points for each concentration level. The inset shows the low-end linearity for the concentrations from 10 to 50 ppt. The correlation coefficient for ethoprophos is 0.9994.
Table I lists the absolute retention time and correlation coefficient values for the calibration curves of organochlorine and organophosphorus pesticides for both SBSE–GC–TOFMS and SBSE–GCxGC–TOFMS. The spiked green tea calibration standards data were processed automatically by ChromaTOF software with a user-defined data processing method. Data review was conducted on a single midpoint standard. The midpoint standard was used as a reference to process the remaining five points of the calibration curve. Review and assessment of all peak assignments, integrations, and calibration curve linearity were conducted for both GC–TOFMS and GCxGC–TOFMS. For the GC–TOFMS analysis, 21 pesticides exhibited correlation coefficient values greater than 0.9900. Disulfoton is known to give poor chromatographic performance; however, a correlation coefficient of 0.9876 for disulfoton was calculated at a concentration range of 50–500 ppt. In addition, excellent linearity was achieved for the GCxGC–TOFMS analysis over the range of 10–500ppt.
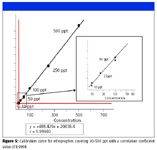
Figure 5
Once the calibration curves were developed, the raw brewed green teas were analyzed quantitatively against the calibration curves. Various pesticides were found in all of the green teas; however, they fell below the minimum reportable levels. Of notable interest was the identification of primiphos-methyl and tebuconazole. These two pesticides are under further analytical investigation. All teas analyzed showed trace levels of dieldrin below minimum reportable levels.
Conclusions
This study demonstrates a novel sampling method requiring no sample preparation utilizing SBSE and automated sample introduction. Both the GC–TOFMS and the GCxGC–TOFMS analysis results show that low trace-level pesticides can be identified accurately and measured quantitatively. The analysis conducted by GC–TOFMS presents a fast, accurate, and sensitive analysis for trace-level quantitation of organochlorine and organophosphorus pesticide residues found in five types of green tea. Excellent results for the GCxGC–TOFMS analysis were achieved for the calibration linearity, plus increased peak capacity showing at least 1200 identified peaks per sample.
Fast-acquisition TOF–MS acquires simultaneous nonskewed full mass range spectra, which allow deconvolution algorithms to successfully assign unique ions for all compounds in a sample, even where serious chromatographic overlap occurs. The ability to successfully identify and deconvolute target compounds is imperative for qualitative and quantitative studies in heavy sample matrix. This experimental approach demonstrates how the integration of a novel sampling method SBSE with thermal desorption soupled with an LTM column in combination with GC–TOFMS and GCxGC–TOFMS provides a highly efficient method for the quantitative evaluation of organochlorine and organophosphorus pesticides in complex sample matrices such as green tea.
John Heim and Mark Libardoni are with LECO Corporation, Saint Joseph, Michigan. Nobou Ochiai and Kikuo Sasamoto are with GERSTEL K.K., Japan.

Analysis of Pesticides in Foods Using GC–MS/MS: An Interview with José Fernando Huertas-Pérez
December 16th 2024In this LCGC International interview with José Fernando Huertas-Pérez who is a specialist in chemical contaminants analytics and mitigation at the Nestlé Institute for Food Safety and Analytical Sciences at Nestlé Research in Switzerland, In this interview we discuss his recent research work published in Food Chemistry on the subject of a method for quantifying multi-residue pesticides in food matrices using gas chromatography–tandem mass spectrometry (GC–MS/MS) (1).
The Use of SPME and GC×GC in Food Analysis: An Interview with Giorgia Purcaro
December 16th 2024LCGC International sat down with Giorgia Purcaro of the University of Liege to discuss the impact that solid-phase microextraction (SPME) and comprehensive multidimensional gas chromatography (GC×GC) is having on food analysis.

.png&w=3840&q=75)

.png&w=3840&q=75)


.png&w=3840&q=75)


.png&w=3840&q=75)


