Tips & Tricks GPC/SEC: Sample Recovery and More
This article provides some tips and tricks for monitoring sample recovery and peak area using GPC/SEC.
Method validation often includes the measurement of sample recovery. There are easy ways to do this with gel permeation chromatography/size-exclusion chromatography (GPC/SEC) while taking a look at the peak area. Peak area is also an important parameter because it allows a more comprehensive characterization of the samples. Last but certainly not least, it is a critical parameter when using advanced detection such as light-scattering or viscometry.
Samples for gel permeation chromatography/size-exclusion chromatography (GPC/SEC) have to be dissolved prior to analysis in an appropriate solvent. Non-soluble compounds can therefore not be characterized. However, even if the molecules are completely dissolved, this does not guarantee suitable characterization. Components might be retained on the column because of unwanted interactions between the stationary phase and sample; or removed during filtering prior to injection; or when inline filters are used. It is therefore recommended to monitor and measure the sample recovery.

Photo Credit: pixhook/Getty Images
Basic Principles
A simple equation that helps to understand how experimental and sample parameters influence the signal intensity of a GPC/SEC concentration detector is as follows:

with SI = signal intensity; KDet = detector constant; ksample = sample constant; and minjected = injected mass.
Equation 1 shows that with an increase of the injected mass (a product of the concentration and injected volume), the signal area will increase. It also means that for repeat injections with the same conditions (sample type, concentration, and injected volume) the peak area should be the same.
If this is not the case, there is a problem with either the injector or the method. Some applications have been reported to have a constant peak area after a few "priming" injections, but in general it is preferable to have an application where the peak area always matches the injected mass. However, even a constant peak area does not guarantee a complete recovery.
Sample Recovery Measurement
The easiest way to check sample recovery is to measure the peak area of the sample with and without columns while keeping all other conditions constant. Since the peak will be extremely narrow without a column, tubing of 300-mm length and 0.25-mm inner diameter for example should be installed to avoid saturation of the detector. As usual, there are some important details to be kept in mind:
1) This test should be done using completely functional hardware — all parts of the system, especially the injector, should be in good shape and properly maintained. Failure of this test can be attributed to poor performance of an instrument component.
2) As RI detectors can show several system or ghost peaks, the test needs to be performed using blank injections.
3) The injected mass should be within a set range so that the measurement with tubing does not result in a saturated detector signal. A typical procedure is as follows:
- Prepare a sample and a blank injection (mobile phase treated as sample).
- Replace the columns with the tubing.
- Inject the blank three times and determine the signal area (Ablank, 0).
- Inject the sample three times and determine the signal area (Asample, 0).
- Reinstall the columns and equilibrate the system.
- Inject the blank three times and determine the signal area, Ablank, col).
- Inject the sample three times and determine the signal area (Asample, col).
The peak areas for each of the three repeat injections should be constant within the expected error range. If not, the system, and especially the injector, deserves a thorough investigation.
The recovery (%) is then obtained by ratio of the peak areas (average of 3):

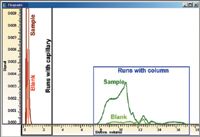
Figure 1 shows an overlay of the peaks obtained for the runs of the blank and the sample with and without tubing. For better visibility of the smaller signals, the signal for the sample with tubing is not fully shown.

Figure 1: Overlay of signals and comparison of peak areas for the blank and the sample with and without tubing.
Additional Results for GPC/SEC Measurements
Every GPC/SEC system requires at least one concentration detector such as an RI, ELSD, or UV detector. A typical GPC/SEC evaluation combines the weight (or number) of chains determined from the signal intensity of the concentration detector signal with the molar mass taken from a calibration curve1 or measured on-line using a light scattering detector.2 This results in the complete molar mass distribution with all molar mass averages. In addition, the amounts above or below the molar mass borders are available.
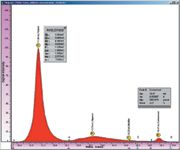
An additional result often overlooked for a complete sample or for single, fully resolved peaks can be obtained from a high performance liquid chromatography (HPLC) evaluation of the signal area. A detector response calibration is performed and the complete peak area is used to determine the concentration. This kind of evaluation is often especially useful for low molar mass components that are fully separated into single peaks. Figure 2 shows an example of such a separation where the high molar mass polymer peak has been evaluated using GPC/SEC with light scattering while the concentration detector signals for the low molar mass components have been used to measure the concentration of a contaminant peak. A sample can therefore be comprehensively characterized with just one injection.

Figure 2: Simultaneous HPLC and GPC/SEC data evaluation. The molar mass averages for the polymer peak are obtained using GPC/SEC light-scattering. In addition, the concentration of a contaminant has been determined using an HPLC-type calibration of the RI detector.
Conclusions
- By comparing peak areas with and without columns, sample recovery can be easily monitored.
- The complete peak area or the peak areas for single peaks are often overlooked, but can provide interesting results in GPC/SEC. For example, the peak area can be used to measure the concentration of contaminants. In addition it is a useful parameter to monitor polymer peaks. If the peak area changes this can be an indication of upcoming problems with instrumentation.
- Monitoring the peak area/sample recovery is especially useful when using advanced detection like triple detection, light scattering (MALS, RALS, LALS), or viscometry is applied. Here, reproducible injections are a prerequisite for reliable evaluation.3
References
1. D. Held, The Column 06/2008, (http://www.pss-polymer.com/fileadmin/custom_documents/Tips_Tricks0608_CalibrationGPCSystem_Column.pdf)
2. D. Held and P. Kilz, The Column 04/2009, (http://www.pss-polymer.com/fileadmin/custom_documents/Tips_Tricks_How_to_choose_a_LS_Technique_TheColumn0409.pdf)
3. D. Held and P. Kilz, The Column 10/2011, (http://www.pss-polymer.com/fileadmin/custom_documents/TheColumn_1011_ImprovingReliability.pdf)
Daniela Held studied polymer chemistry in Mainz, Germany, and now works in the PSS software and instrument department. She is also responsible for education and customer training.
Peter Kilz studied polymer chemistry in Mainz, Germany, and Liverpool, UK. He is one of the founders of PSS and head of the software and instrument department. He is also involved in customer support and training.
E-mail: Dheld@pss-polymer.com
Website: www.pss-polymer.com

New Method Explored for the Detection of CECs in Crops Irrigated with Contaminated Water
April 30th 2025This new study presents a validated QuEChERS–LC-MS/MS method for detecting eight persistent, mobile, and toxic substances in escarole, tomatoes, and tomato leaves irrigated with contaminated water.

.png&w=3840&q=75)

.png&w=3840&q=75)


.png&w=3840&q=75)


.png&w=3840&q=75)


