Fast and Accurate Determination of Algal Toxins in Water Using On-line Preconcentration and UHPLC–HRAM–MS
The Column
The development of a column-switching technique based on on-line preconcentration and HRAM–MS to obtain fast and accurate results for the determination of algal toxins in drinking water is discussed.
The development of a column-switching technique based on on-line preconcentration and high-resolution accurate mass full-scan mass spectrometry (HRAM–MS) to obtain fast and accurate results for the determination of algal toxins in drinking water is discussed.
When the density of Microcystis and Nodularia cyanobacteria colonies surpass a certain level, they produce hepatotoxic substances called microcystins and nodularins, respectively1; the cyanobacteria Anabaena and Apha-zinomenon are known to produce a neurotoxin called anatoxin.2 These toxins can cause the deaths of wild animals and domestic livestock. If ingested by humans it can lead to gastrointestinal and allergy-like reactions and, on rare occasions, death.3 Of the cyanobacteria species, Microcystis has been observed to be dominant in the majority of eutrophication events. The toxins it produces are cyclic peptides comprised of seven amino acids, each with a relatively large molecular mass ranging from 900 Da to 1100 Da. There are approximately 60 to 85 variants of microcystins reported to date. Nodularins produced by Nodulariais are peptide-based hepatotoxins similar to microcystins.
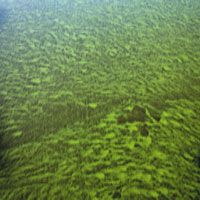
Photo Credit: Dave Porter Peterborough Uk/Getty Images
According to the World Health Organization (WHO), microcystins are chemically stable and can have an adverse impact on human health if present in a water supply source.4 Previous research has shown that the microcystins-LR, -RR, and -YR are the most common isomers detected, and that microcystin-LR is the most toxic. Based on these results, the WHO has set forth a water quality guideline specifying that the microcystin-LR concentration be maintained below 1 ng/mL. This guideline is currently being used in Korea as part of a candidate list for drinking water standards.
In Korea, when an algal bloom is forecasted, samples from the water supply source are collected and the chlorophyll-a concentration and the cyanobacteria cell number are measured. Based on the results, the situation is categorized into one of the following situations: "algal bloom watch", "algal bloom alert", or "algal bloom". In the latter two situations, the cyanotoxins, mainly microcystin-LR, are analyzed.7 Accurate analysis of multiple samples within a short time frame is required to monitor the multiple points of the water supply source and each process taking place at water purification plants.
Traditionally, cyanotoxins have been measured by performing extraction and concentration using solid-phase extraction (SPE) followed by high performance liquid chromatography with ultraviolet detection (HPLC–UVD) or photodiode array detection (PAD).8 More recently, analysis time has been reduced and sensitivity improved through the use of liquid chromatography–mass spectrometry (LC–MS–MS) using electrospray ionization (ESI).9–15 The conventional SPE process required for all of these methods is time consuming and uses a lot of solvent.
An on-line preconcentration and injection method can shorten the sample pretreatment process and help detect trace amounts of target substances, while a high-resolution accurate-mass–mass spectrometry (HRAM–MS) method utilizes the retrospective aspect of the data, making both accurate identification of the analyzed toxins and post-process quantitation of microcystin isomers possible. We combined these two techniques for the identification and quantitation of microcystins-LR, -RR, and -YR as well as nodularin, and developed an optimized method to enhance the reliability and economic efficiency by reducing the run time and the amount of solvent necessary. The method was applied to raw and treated water from water purification plants and river systems.
Experimental
Reagents: Microcystin-LR, -RR, and -YR were procured from Wako Pure Chemical Industries, Ltd. in a dried crystal form. Nodularin was procured from Cayman Chemical in a dissolved form (500 μg in 500 μL of ethanol).
Information on each of the standard materials is summarized in Table 1. Solvents were of residual pesticide-grade. Water was double distilled by reverse osmosis.

Table 1: Chemical formula and molecular weight of target algal toxins.
Standard Solutions and Calibration Curves: The standard solutions containing the cyanotoxins were prepared by dissolving microcystin-LR, -RR, and -YR into methanol at 100 μg/mL and by dissolving nodularin in ethanol to a concentration of 10 μg/mL. Solutions were stored in a cold room at 4 °C. Taking into consideration the sensitivity of the analysis method and the WHO guideline of a microcystin-LR concentration of 1 ng/mL, the solutions were diluted into six different concentrations within the range of 100–1000 pg/mL. An external standard method was used for calibration curve verification and sample identification. The ratio of peak areas according to the concentration of standard solution was then calculated.
Sample Collection and Storage: A total of 173 raw and treated water samples were collected from 59 facilities at the Han (18 sites), Nakdong (18 sites), and Geum-Seomjin (19 sites) Rivers, and in the city of Geoje (four sites), as well as 55 sites in the Han River basin measurement network area. All samples were refrigerated during transport, and transferred directly to a cold room in the laboratory and maintained at 4 °C. Sample aliquots were analyzed within three days of delivery.
Pretreatment and Instrumental Analysis: On-line preconcentration using column switching was applied as a means to minimize sample pre-treatment and shorten analysis time. An EQuan MAX on-line sample concentration UHPLC–MS system (Thermo Scientific) equipped with a 20 × 2.1 mm, 12-μm Hypersil GOLD aQ preconcentration column (Thermo Scientific) and a 50 × 2.1 mm, 1.9-μm Hypersil GOLD analytical column (Thermo Scientific) was used. The sample injection amount was set at 1 mL after considering the WHO guidelines, equipment sensitivity, peak shape, and concentration ratio of the on-line injection. The standard material for the calibration curve and all the samples used in the analysis were filtered through a 0.45 μm glass fibre (GF) membrane syringe filter.
A Thermo Scientific Exactive Orbitrap mass spectrometer was operated in full-scan mode. Resolving power was set to 50,000 (FWHM at m/z 200). The conditions for the on-line sample concentration and injection are summarized in Table 2. For the post-analysis identification and quantitation, an external standard method was applied.
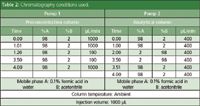
Table 2: Chromatography conditions used.
The following parameters were used: scan range: m/z 150–1100; resolving power: 50,000 (FWHM at m/z 200); polarity: positive; measured m/z: 995.5543 microcystin-LR, 519.7898 microcystin-RR, 1045.5344 microcystin-YR, 825.4501 nodularin; ionization source: electrospray; spray voltage: 4000 V; capillary temperature: 340 °C; capillary voltage: 37 V; tube lens voltage: 85 V; skimmer voltage: 22 V.
Results and Discussion
High-Resolution Mass Spectra of Toxins: The standards were prepared at a concentration of 1 ng/mL each and injected using a syringe pump to observe the mass spectra. The molecular ion and carbon isotope spectra of microcystins-LR, -RR, -YR, and nodularin are shown in Figure 1(a). Four carbon isotopes were observed for most compounds. Using this isotopic pattern, it was possible to match the experimentally recorded carbon isotopic distribution ratios to the theoretical isotopic ratio to provide confirmation of the toxin using the analysis software. Meanwhile, molecular ions were observed in nodularin at m/z 825 and the isotopic pattern was confirmed (Figure 1[b]).

Figure 1: (a) Carbon isotope patterns by high-resolution, full-scan MS of microcystins and nodularin, and (b) simulated spectrum of nodularin (top) compared to actual spectrum (bottom), confirming isotope pattern.
From the results of the syringe injection, the quantitation ions for microcystins-LR, -RR, and -YR and nodularin were set at 995.5543, 519.7898, 1045.5344, and 825.4501, respectively. In addition, the scanning range for identification and quantitation of the target compounds was between m/z 400 and 1100 for simultaneous analysis. However, the minimum range was set at m/z 150 to allow confirmation and quantitation of various algal toxins, such as anatoxin generated by Anabaena, which occurs just as frequently during an algal bloom.
Optimization of the On-line Preconcentration Method: In this study, 1 mL of each sample was used for the on-line preconcentration method. An injection of 1 mL of sample when the 0.1% formic acid and water/acetonitrile ratio was 98:2 led to the target toxin being adsorbed in the front part of the trap column and the remainder of the water sample being diverted to waste. The valve was then switched to postion 2 for elution from the SPE column onto the analytical column using 98% acetonitrile.
A comparison of the absolute amount introduced into the mass spectrometer using this on-line method and off-line SPE shows that the on-line method has the same concentration-injection effect as pretreating and concentrating a 200 mL sample into 2 mL using off-line SPE and injecting 5 μL of the preconcentrated sample. Therefore, it is possible to perform a microanalysis without a separate pretreatment.
The retention times for microcystin-LR, -RR, and -YR and nodularin using this method were between 2.6 and 2.8 min. By using a relatively short column and a simple solvent combination, mass separation occurs under high-resolution conditions at a resolving power of 50,000. Therefore, even if there is an overlap of retention times, identification and quantitation based on the difference of the precise mass unique to each of the toxins is possible. Thus, there was no actual interference between the toxins (Figure 2).
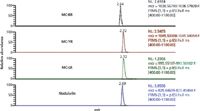
Figure 2: Extracted chromatograms from full-scan data by UHPLCâHRAMâMS.
Compared to the conventional SPE method, which requires the use of 0.5 to 1 L sample, the on-line injection method reduced the analysis time and amount of sample required. In a typical analysis with five samples, a conventional SPE method would require 8 h for the filtration, solid-phase extraction, and concentration processes; 2.3 h for instrumental analysis; and 1 h for data analysis and quantitation, for a total of 12.3 h. In contrast, the optimized method developed in this study required 10 min for sample division and filtration, 0.8 h for instrumental analysis with the application of UHPLC, and the same amount of time for data analysis and quantitation, for a total of 2 h. Other benefits of using this rapid pretreatment method include enhanced productivity when there is a large amount of sample, reduced use of organic solvents, reduced labour for the pretreatment process, and omission of a nitrogen concentration apparatus.
Calibration Curve Assessment: To review the linearity, the calibration curve of the standard toxin mixture of microcystin-LR, -RR, and -YR and nodularin was measured repeatedly within the range 100 to 1000 pg/mL. As shown in Figure 3, the correlation coefficient for each of the toxins was between 0.9971 and 0.9996. Reproducibility was ±15%. This is an improvement when compared to the quantitation range for algal toxins in the water quality test samples previously reported.13 In addition, it was possible to perform a linearity assessment at lower concentrations if necessary, since thesignal-to-noise ratio (S/N) was sufficient at the minimum concentration of 0.1 ng/mL. Based on these results, we therefore determined that the on-line preconcentration high-resolution full-scan MS method has the equivalent trace quantitation capacity as SPE and LC–MS–MS.

Figure 3: Calibration curve of microcystin-LR, -RR, -YR, and nodularin.
Recovery Rate and Detection Limit: To assess the recovery rate of the optimized method, seven 20 mL samples were taken from the 1 L sample of the raw water collected from the Daecheong Dam in which the target toxins were not detected. Microcystin-LR, -RR, and -YR and nodularin were added to prepare a solution of 0.1 ng/mL of sample. The solution was then filtered through the 0.45 μm glass fibre filter and repeated analyses were conducted to measure the recovery rate for each toxin. As shown in Table 3, the recovery rates for microcystin-LR, -RR, and -YR and nodularin were 113.7%, 70.3%, 103.7%, and 83.9%, respectively. The recovery rates for the three types of microcystin toxins in the conventional SPE method were reported to be 70% to 110%.15,16 The degree of precision of this method was calculated to be 2.5–10.9%. The method detection limit (MDL) was 0.009–0.035 ng/mL and the practical quantitation limit (PQL) was 0.15–0.51 ng/mL. The MDL set forth in the WHO guidelines regarding microcystin-LR is a hundred times higher than what was achieved. These results are well below the guidelines set forth for microcystin-LR, such as 1 ng/mL in Australia, 0.3 ng/mL in Japan, 0.5 ng/mL in Canada, and 1 ng/mL by WHO.

Table 3: Validation results of the analytical method.
Application to Environmental Samples: The method described above was used on the samples collected from the water purification facilities. The raw water and river water samples were treated in an ultrasonic extraction apparatus for 30 min before being filtered through a 0.45-μm glass fibre filter. The four target algal toxins detected in the raw and treated water from the water purification facilities and the river water were well below the quantitation limit and were considered to be so low as to not be detected. On the other hand, molecular ions of microcystin-LR were detected in the cyanobacteria lake water sample and were identified through a comparison of the mass spectrum ratio of the carbon isotope of the standard toxin. It took approximately 16 h to complete the calibration curve and analysis of the blank sample and all 20 samples. It was determined that the method could be used to rapidly analyze a large number of samples, reduce the amount of labour and solvent necessary, and help to make quick responses in the field.
Conclusion
It is difficult to forecast algal blooms and so rapid diagnosis of cyanotoxins produced by cyanobacteria is an important element in making quick responses at water intake and purification facilities. In this study, a combination of the on-line pre-concentration and injection method and the high-resolution, full-scan mass spectrometry method was used to assess algal toxins and the results were applied to environmental samples. Based on the results, the following conclusions were reached:
- Microanalysis can be performed without a complex pretreatment procedure. The on-line preconcentration method produces 200× the concentration effect compared to SPE, even with a small sample of 1 mL. When combined with the high-resolution, full-scan mass spectrometry method, the method produced a linearity that was equivalent to that of the SPE and LC–MS–MS method. The recovery rate was over 70% and the degree of precision was within 10%. At the same time, the method detection limit (MDL) and the practical quantitation limit (PQL) were determined to be 0.009–0.035 ng/mL and 0.03–0.11 ng/mL, respectively.
- The application of the on-line preconcentration method decreased the analysis time by 80% compared to the conventional method and also reduced the amount of labour, solvent, and solid-phase cartridges required.
- The discussed method makes it possible to detect non-target compounds. Therefore, this method could be used in retrospective search and simultaneous quantitation of algal toxins with similar physicochemical properties such as anatoxin (mol. wt.: 165) and aplysiatoxin (mol. wt.: 672).
References
1. A.S. Henriksen and K. Olli, Phycologia 35, 94–101 (1996).
2. W.M. Repavich, L.F. Meisner, W.C. Sonzogni, J.H. Standridge, and R.E. Wedepohl, Water Research 24, 225–231 (1990).
3. I.R. Falconer, in Quality and Treatment of Drinking Water II. The Handbook of Environmental Chemistry, J. Hrubec (1998) pp. 53–82.
4. WHO, Toxic Cyanobacteria in Water, A Guide to Their Public Health Consequences, Monitoring and Management 1999, pp. 163–164.
5. J.J. Lee, H.B. Kim, J.S. Moon, J.A. Lee, H.J. Lee, H.K. Park, J.H. Park, and J.K. Seo, "Assessment of Microcystin Analysis Methods for Convenient Monitoring", paper presented at the Korean Society of Water Conference, 2010, 643–644.
6. K. Sivonen, Cyanobacterial Toxins. Encyclopedia of Microbiology (3rd ed., 2009) pp. 290–307.
7. K. Harada, K. Matsuura, and M. Suzuki, Journal of Chromatography A 448, 275–283 (1988).
8. J.-H. Jang, Y.-S. Kim, and J.-W. Choi, Journal of Korean Society on Water Environment 28(6), 843–850 (2012).
9. L.A. Lawton, G.A. Codd, and C. Edwards, Analyst 119, 1525–1530 (1994).
10. K. Harada, K. Matsuura, and M. Suzuki, Journal of Chromatography A 448, 275–283 (1998).
11. S.J. Yu, E.Y. Han, J.Y. Hwang, J.K. Ryu, and Y.S. Yoon, Journal of Korean Society on Water Environment 15(4), 517–526 (1999).
12. M. Petrovic, D. Barcelo, and S. Tavazzi, Journal of Chromatography A 971(20), 37–45 (2002).
13. J.A. Zweigenbaum, K.A. Beattie, G.K. Codd, and J.D. Henion, Journal of Pharmaceutical and Biomedical Analysis 23(4), 723–733 (2000).
14. L. Cong, Q. Chena, B. Huang, B. Lu, Y. Ren, and J. Zhang, Analytica Chimica Acta 569(31), 157–168 (2006).
15. J.H. Kim, H.C. Kim, and M.A. Yun, Journal of Korean Society on Water Environment 25(4), 597–605 (2009).
16. J. Fastner, I. Flieger, and U. Neumann, Water Research 32(10), 3177–3181 (1998).
Jaewon Choi is an investigator at the Water Analysis & Research Center, K water, Daejeon, Korea. She focuses on studying the fate and removal of contaminants of emerging concern in environmental and drinking water. She has a PhD from Ehime University in Japan in environmental analytical chemistry.
Je-Heon Jang is an investigator at the Water Analysis & Research Center, K water, Daejon, Korea. His area of interest is LC–MS measurement of PPCP and algal toxins in environmental water. His masters degree in engineering is from Chungnam National University, Korea.
Jennifer Massi is vertical marketing manager, Food & Beverage, Thermo Fisher Scientific, Chromatography and Mass Spectrometry.
Jonathan Beck is a regional market chemist, Environmental and Food Safety, Thermo Fisher Scientific. His PhD in chemistry is from the University of Missouri, USA.
E-mail: jennifer.massi@thermofisher.com
Website: www.thermoscientific.com
This article is from The Column. The full issue can be found here:http://images2.advanstar.com/PixelMags/lctc/digitaledition/October06-2014-uk.html#2

New Study Reviews Chromatography Methods for Flavonoid Analysis
April 21st 2025Flavonoids are widely used metabolites that carry out various functions in different industries, such as food and cosmetics. Detecting, separating, and quantifying them in fruit species can be a complicated process.
Quantifying Terpenes in Hydrodistilled Cannabis sativa Essential Oil with GC-MS
April 21st 2025A recent study conducted at the University of Georgia, (Athens, Georgia) presented a validated method for quantifying 18 terpenes in Cannabis sativa essential oil, extracted via hydrodistillation. The method, utilizing gas chromatography–mass spectrometry (GC–MS) with selected ion monitoring (SIM), includes using internal standards (n-tridecane and octadecane) for accurate analysis, with key validation parameters—such as specificity, accuracy, precision, and detection limits—thoroughly assessed. LCGC International spoke to Noelle Joy of the University of Georgia, corresponding author of this paper discussing the method, about its creation and benefits it offers the analytical community.
Understanding FDA Recommendations for N-Nitrosamine Impurity Levels
April 17th 2025We spoke with Josh Hoerner, general manager of Purisys, which specializes in a small volume custom synthesis and specialized controlled substance manufacturing, to gain his perspective on FDA’s recommendations for acceptable intake limits for N-nitrosamine impurities.


