Tips & Tricks GPC/SEC: Polydispersity — How Broad is Broad for Macromolecules?
The Column
The vast majority of macromolecules exhibit a molar mass distribution that is often described by the polydispersity index (PDI). This Tips & Tricks instalment offers practical advice to consider when analyzing macromolecules using liquid chromatography (LC).
Photo Credit: Andy Dean Photography/Shutterstock.com

Daniela Held and Wolfgang Radke, PSS Polymer Standards Service GmbH, Mainz, Germany
The vast majority of macromolecules exhibit a molar mass distribution that is often described by the polydispersity index (PDI). This Tips & Tricks instalment offers practical advice to consider when analyzing macromolecules using liquid chromatography (LC).
All technical polymerizations are statistical processes where monomer units react with each other to form polymer chains of different lengths. The number of monomer units, i, of a chain is defined as the degree of polymerization. The molar mass, Mi, of such a chain is the product of the degree of polymerization and the molar mass of the repetition unit, Mm, plus the molar masses of the initiator and the termination agent.
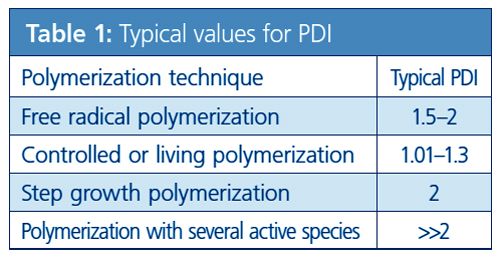
Even the simplest macromolecules (homopolymers comprising repetition units of the same chemical structure) are heterogeneous mixtures of molecules of different degrees of polymerization and hence molar masses. As a consequence, there is no distinct molar mass for a macromolecule, but different statistical averages are used to describe the molar mass of the sample. Common statistical averages are the number average molar mass, Mn, and the weight average molar mass, Mw. The ratio of Mw to Mn is the polydispersity index (PDI), which is a measure of the width of the molar mass distribution. Typical values for the PDI based on the polymerization technique are given in Table 1.

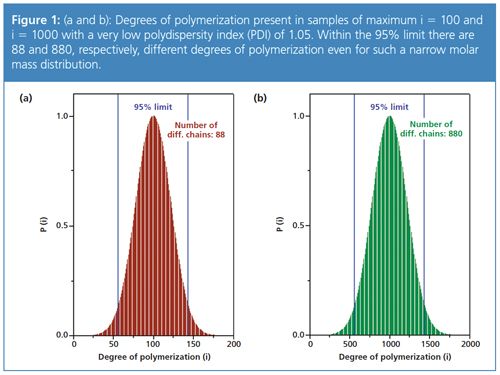
Figure 1 (a) and (b) compare two polymers with the same narrow molar mass distribution (same PDI of 1.05) but different degrees of polymerization, 100 and 1000, respectively. It becomes obvious here that the number of different chain lengths increases with the degree of polymerization, despite the same PDI. The number of different chain lengths that are present is much higher for the higher degree of polymerization, 1000 (880 different chain lengths for 95% coverage), than for the lower degree of polymerization (88 different chain lengths with 95% coverage).

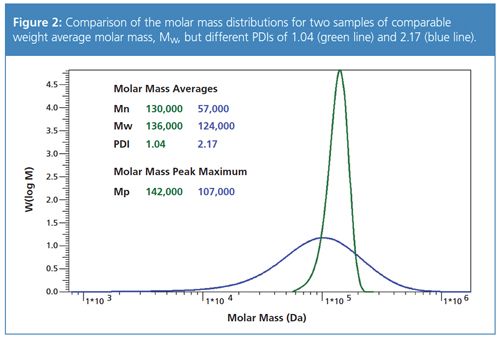
Figure 2 compares the molar mass distributions obtained for two polymers with similar weight average molar mass, but different polydispersities. For a PDI of 2 a very wide molar mass range is covered. As a consequence of the width of the molar mass distribution the common approach of showing a logarithmic (instead of a linear) molar mass axis is applied here.

While many gel permeation chromatography/size-exclusion chromatography (GPC/SEC) users are very familiar with the numbers and definitions above, the impact of the width of the distribution on practical considerations, such as column selection, detector selection, or sample preparation, are often underestimated and therefore discussed in the following three sections.
Column Selection
GPC/SEC is the method of choice to measure the molar mass distribution, MMD. When setting up a GPC/SEC method it is essential to select columns with a sufficient separation range to cover the complete molar mass range of the samples to be analyzed. It is of the utmost importance that large pores are available to also separate the high molar mass fractions that might be present - even for samples with a “low” average molar mass. If this is not the case an artificial shoulder might appear in the chromatograms at the exclusion limit. This artifact cannot be eliminated by result calculation (1).
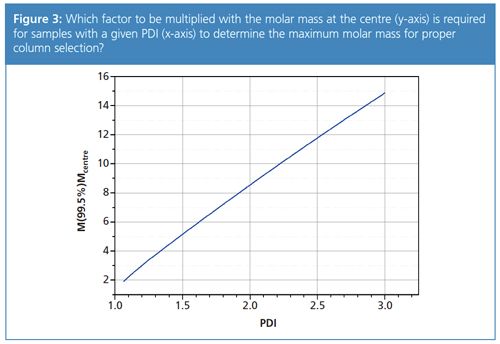
Figure 3 was created to help support GPC/SEC users to identify the upper molar mass separation range of the column for their samples based on the expected molar mass at the centre of the distribution and on the expected polydispersity.

The graph was generated based on a log normal distribution and was calculated so that the ratio between the molar mass at 99.5%, M (99.5%), and the centre of the distribution, Mcentre, is plotted versus the polydispersity. It therefore provides for a given PDI a factor to be multiplied with the expected molar mass so that the minimum upper molar mass limit of the column is obtained.
An example calculation for the sample with the blue trace in Figure 2 yields the following results: the molar mass at the centre is 107,000 Da, the PDI is 2.17. From Figure 3, a factor of approximately 9.5 for a PDI of 2.17 is obtained. The highest molar mass for this sample should therefore be in the range of 1,020,000 Da. A comparison with Figure 2 shows that the molar mass distribution indeed ends at approximately 1 million Da. In other words, a suitable column combination for these samples should have an exclusion limit of more than 1 million Da.
Experienced GPC/SEC users will note that the results in Figure 3 also show good agreement with the well-known rule of thumb that for a PDI of 2 the weight average molar mass should be multiplied by a factor of 10 to determine the required upper exclusion limit of the column.
GPC/SEC-Light Scattering
Static light scattering in solution is a well-established technique to measure the weight average molar mass of macromolecules. When hyphenated with GPC/SEC, light scattering can allow the molar mass distribution to be determined and some of the limitations of GPC/SEC to be overcome. Light scattering detectors are therefore an important addition for many R&D laboratories.
Commercially available detector types include right-angle (RALLS), lowâangle (LALLS), and multi-angle (MALLS) laser light scattering detectors. RALLS detectors have many advantages with respect to detector design and construction, but they only yield correct molar masses for isotropic scatterers. For anisotropic scatterers, RALLS detectors underestimate the molar masses.
The size of the molecule in solution, d, compared to the laser wavelength, λ, decides if a molecule is an isotropic scatterer (d< λ/20) or not. While many globular proteins exhibit a small size (and a narrow distribution) and RALLS is fully sufficient for them, many synthetic macromolecules exhibit larger sizes and a broad molar mass distribution
so techniques such as MALLS are required (2).
The rule-of-thumb states that random coil-like, linear polymers, such as polystyrene or pullulane, below 200,000 Da, are isotropic scatterers. However, the polydispersity of the samples has to be taken into account. Figure 2 shows that for the sample with the broad PDI of 2.17 a significant part of the sample is in the anisotropic region, while for the sample with the narrow molar mass distribution this is less pronounced. Users of GPC/SEC light scattering detection should therefore also keep the PDI of the sample in mind when deciding which technique to apply.
Sample Preparation
Every chromatographer aims to generate results as quickly as possible; however, speed is not appropriate when analyzing polymers. Procedures speeding up the dissolution of small molecules often cannot be used and may even degrade the macromolecules. This is particularly true for exposure to ultrasonification.
In general macromolecules need time to dissolve and the dissolution time increases with molar mass. Preparing a sample solution for a GPC/SEC analysis therefore often needs from a few hours, to overnight, or up to several days.
In order to avoid selective or incomplete dissolution, both the molar mass and the polydispersity should be taken into account when trying to dissolve a sample.
Summary
- Even the simplest homopolymers exhibit a molar mass distribution and are mixtures of different molar masses.
- The polydispersity index is a measure of the width of the molar mass distribution. PDI is 1 for uniform monodisperse substances; it is larger than 1 for the vast majority of all macromolecules. In praxis, the PDI can be very large - up to values of 100 and above.
- The PDI needs to be taken into account when selecting the upper molar mass separation range of GPC/SEC columns and the most appropriate light scattering technique.
- The PDI is also important in sample preparation to allow for enough dissolution time.
References
- D. Held, The Column9(22), 21–25 (2013).
- D. Held and P. Kilz, The Column5(4), 28–32 (2009).
Daniela Held studied polymer chemistry in Mainz, Germany, and works in the PSS software and instrument department. She is also responsible for education and customer training.
Wolfgang Radke studied polymer chemistry in Mainz, Germany, and Amherst, Massachusetts, USA, and is head of the PSS application development department. He is also responsible for instrument evaluation and for customized trainings.
E-mail: DHeld@pss-polymer.com
Website:www.pss-polymer.com

Determining the Effects of ‘Quantitative Marinating’ on Crayfish Meat with HS-GC-IMS
April 30th 2025A novel method called quantitative marinating (QM) was developed to reduce industrial waste during the processing of crayfish meat, with the taste, flavor, and aroma of crayfish meat processed by various techniques investigated. Headspace-gas chromatography-ion mobility spectrometry (HS-GC-IMS) was used to determine volatile compounds of meat examined.
Accelerating Monoclonal Antibody Quality Control: The Role of LC–MS in Upstream Bioprocessing
This study highlights the promising potential of LC–MS as a powerful tool for mAb quality control within the context of upstream processing.

.png&w=3840&q=75)

.png&w=3840&q=75)


.png&w=3840&q=75)


.png&w=3840&q=75)


