Tips & Tricks GPC/SEC: The Art of Analyzing High Molar Mass Samples
GPC/SEC can be performed for samples that range from a few hundred to several million daltons in molar mass. It can often require more skill to analyze high molar mass samples in the molar mass range of several million dalton. This article explains more.
Gel permeation/size-exclusion chromatography (GPC/SEC) can be performed for samples that range from a few hundred to several million daltons in molar mass. Analysis of low molar mass samples is relatively straightforward; however, it requires more skill to analyze high molar mass samples in the molar mass range of several million dalton.
The analysis of macromolecules requires patience, especially when analyzing high molar mass samples. The dissolution time required by macromolecules is significant and can take up to several weeks in a worst case scenario. Dissolution time is dependent on a number of parameters such as sample and solvent, molar mass, polydispersity, chain chemistry, crystallinity, composition, and stereochemistry. As a rule of thumb, the higher the molar masses and narrower the distributions the more time that is required.

(PHOTO CREDIT: RYAN MCVAY/GETTY IMAGES)
It is not easy to speed up the polymer dissolution process. The use of ultrasonic devices is not recommended because it is likely to result in degradation of the sample, and for ultrahigh molar mass samples even the use of a magnetic stir bar might result in chain scission. Therefore, the only option is to wait until the sample is dissolved into single isolated chains. Stabilized solvent should be used if the dissolution process takes several days or weeks. Keeping the dissolution container in a dark environment is also often recommended. If needed, the dissolution container can be gently swirled to homogenize the solution.
Lower concentrations of high molar mass samples should be used than otherwise recommended when analyzing low molar mass samples. High molar mass molecules need space to occupy their hydrodynamic volume without interference from other chains. Table 1 summarizes recommended sample concentrations based on molar mass, but please note that these recommendations are for samples with narrow molar mass distributions. For samples with a high polydispersity (broad molar mass distribution) higher concentrations are possible.

Table 1: Recommended sample concentrations with respect to sample molar mass.
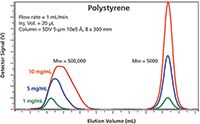
The effect of sample concentration on elution volume increases with molar mass. Figure 1 shows the elution volume and peak shape for reference materials with molar masses of 5000 Da and 500,000 Da. There is a very small change seen for the low molar mass sample, compared to a significant change in the elution volume and the peak shape of the high molar mass reference standard. The change in elution volume is especially problematic when the GPC/SEC system is calibrated with narrow distributed molar mass standards where the peak position of a sample will be compared to that of a calibration standard. The change in peak shape (indicating the lack of separation) affects all kinds of calibrations, even those with on-line viscometers, light scattering detectors, or triple detection systems.

Figure 1: Overlay of chromatograms of two polystyrene reference materials for three different concentrations. While there is only a minor effect for the 5000 Da sample, the elution volume and even the peak shape of the 500,000 Da sample is highly affected.
Filtering sample solutions through a membrane filter is usually recommended for solutions containing gels or particles, but care must be taken for high molar mass samples. It is advisable to adjust the pore size of the filter to avoid sample degradation, and if at all possible, filtration of high molar mass sample solutions should be avoided completely.
Chromatographic Conditions
The following rules apply for all samples that are to be analyzed with GPC/SEC:
- The separation of higher molar masses requires separation columns with larger pores.
- Larger particle sizes are generally used for higher molecular weights to avoid shear degradation of the samples.
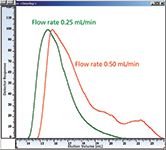
For samples that are several million Dalton in molar mass, additional experimental aspects need to be considered. The most important step is to adapt the flow rate of the system, because polymers show significant peak broadening or unexpected peak shapes when run at too high flow rates as a result of their extremely low diffusion coefficients. Reducing the flow rate to 0.25 mL/min or even less will result in more realistic peak shapes for high molar mass samples. Another factor to be considered is shear-induced stretching of the long polymer chains. Figure 2 shows an overlay of a high molar mass sample measured at 0.5 mL/min and at 0.25 mL/min. The curve for 0.50 mL/min is shifted to artificially high elution volumes, and again the peak shape changes.

Figure 2: Overlay of chromatograms for a high molar mass sample of 3.8 million Da obtained at 0.5 mL/min flow rate (red trace) and 0.25 mL/min flow rate (green trace). Reducing the flow rate to 0.1 mL/min can further improve the results.
An on-line light scattering detector is a good tool to identify unsuitable chromatographic conditions. These detectors are often required to overcome the lack of ultrahigh molar mass calibration standards, and so many setups already include such a device.
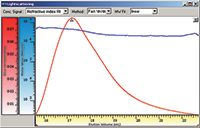
Figure 3 shows the multi-angle light scattering results for the high molar mass sample at a flow rate of 0.5 mL/min. The measured molar mass stays nearly constant for a wide elution volume range. This is the result of inefficient separation because unsuitable chromatographic conditions have been applied.

Figure 3: Slice concentration (measured using an RI) and on-line determined molar mass (MALLS) for a run with a too high flow rate (0.5 mL/min).
Other practical considerations to make when analyzing high molar masses are detection limit and sample viscosity. The S/N ratio for concentration detectors may be too low, because low concentrations are applied. However, instead of increasing the sample concentration, it is better to increase the injection volume for the injection because this will also increase the overall injected mass and therefore improve the signals. Please note that this is not recommended for lower molar masses. In those cases it is better to increase the concentration and to inject a small volume.
If the sample viscosity is high because of the presence of high molar masses, a reduction of the draw-speed of the autosampler is recommended. This will increase the reproducibility of the injections.
Good Practices for the Analysis of High Molar Masses
- Be patient and give enough time for dissolution.
- Use low concentrations and, if required, increase the injection volume.
- If possible, avoid sample filtration. If this is not possible use adequate filter pore sizes.
- Use low flow rates (0.25–0.1 mL/min) and reduce the autosampler draw-speed.
- Use columns with a large particle size and large pores. In the case of suspicious shoulders in the chromatogram check the exclusion limit of the columns.
Daniela Held studied polymer chemistry in Mainz, Germany, and works in the PSS software and instrument department. She is also responsible for education and customer training.
E-mail: Dheld@pss-polymer.com
Website: www.pss-polymer.com
This article is from The Column. The full issue can be found here:http://images2.advanstar.com/PixelMags/lctc/digitaledition/June05-2014-uk.html

New Method Explored for the Detection of CECs in Crops Irrigated with Contaminated Water
April 30th 2025This new study presents a validated QuEChERS–LC-MS/MS method for detecting eight persistent, mobile, and toxic substances in escarole, tomatoes, and tomato leaves irrigated with contaminated water.

.png&w=3840&q=75)

.png&w=3840&q=75)


.png&w=3840&q=75)


.png&w=3840&q=75)


