Principles of Detection and Characterization of Branching in Synthetic and Natural Polymers by MALS
This article provides insight into the basic principles of the MALS technique, and how it can be applied to the detection and characterization of branching in polymers.
Branching is an important structural parameter of many synthetic and natural polymers. It can influence the mechanical and thermodynamic properties of polymers, and also affect the viscosity and rheological behaviour of polymer solutions and melts. Quantitative data about branching topology is therefore vital to understanding polymerization processes and the development of novel polymer-based materials with enhanced properties. Multi-angle light scattering (MALS) is one analytical technique that can be performed to identify branching in macromolecules. This article provides insight into the basic principles of this technique, and how it can be applied to the detection and characterization of branching.
Branching is widely recognized as relevant to synthetic polymers, but has more recently become relevant to natural polymers. For example, hyaluronic acid, an important biopolymer with numerous medical and pharmaceutical applications, was believed to have a linear structure until multi-angle light scattering (MALS) analysis proved otherwise.1

(PHOTO CREDIT: NAOKO SUGUTA/GETTY IMAGES)
Full characterization of branching requires the coupling of a separation device to separate molecules of varying size over a period of time; and an analytical detector to determine molecular properties such as molar mass, size, or branching ratio. This coupling allows the detector to characterize each size fraction individually to obtain a complete and accurate distribution.
The most common method of separating polymers in solution is gel permeation or size-exclusion chromatography (GPC/SEC). SEC–MALS is a well-established technique for the absolute characterization of typical polymers; however, large and highly branched polymers can exhibit abnormal conformation plots in SEC.5 An alternative method is asymmetrical flow field-flow fractionation (AF4) coupled with MALS. AF4 does not require the diffusion of molecules in and out of a porous solid phase, and is therefore not subject to the "anchoring" mechanism that leads to abnormal elution behaviour. AF4–MALS is therefore ideal for the separation of large and highly branched macromolecules. MALS provides the required quantitative information about branching topology.
The Theory Behind Branching
The development of quantitative branching analysis began in 1949 when Zimm and Stockmayer2 introduced the theoretically derived "branching ratio" (g):

R2 is the mean square radius of branched and linear macromolecules having the same molar mass (M). R and M are both determined independently of MALS. A differential refractive index (dRI) detector is used for measuring concentration. The branching ratio (g) is directly related to the number of branch units in randomly branched polymers or to the number of arms in star-branched polymers.2 In general, g ≤ 1 where the equality sign stands for linear polymers. Lower values of g tend to correspond to higher degrees of branching. For example: g ≈ 0.1–0.2 indicates a highly branched structure.
Ten years after the definition of g by Zimm and Stockmayer, Zimm and Kilb3 introduced an alternative branching ratio based on intrinsic viscosity:

where [η] is the intrinsic viscosity of branched and linear polymer molecules having the same molar mass. [η] and M are determined using a MALS, dRI, and a differential viscometry (dVI) detector for intrinsic viscosity. The relationship between g' and g is described via the so-called "draining parameter" (e):

The parameter e is expected to vary in the range of 0.5–1.5, but a typical value is e ≈ 0.7.
MALS can measure molar masses from below 1 kDa up to ~1 GDa, but is limited to determining root mean square (RMS) radii above ~10 nm (corresponding to a molar mass of ˜≈ 105 g/mol for typical polymers). Alternatively, either intrinsic viscosity or SEC elution volume can be used as a size parameter. The former is used in equation 2, whereas the latter appears in the approach of Yu and Rollings: 4

M is the molar mass of linear and branched molecules eluting at the same elution volume, V, and a is the exponent of the Mark-Houwink equation for a linear polymer. M is determined by MALS + dRI. In summary, the branching ratio may be obtained by performing the following methods:
- Radius method: Calculate g from the conformation plot (log–log plot of R versus M) using equation 1, MALS, and dRI detectors.
- Viscosity method: Calculate g' from the Mark-Houwink plot (log–log plot of [η] versus M) using equation 2, MALS, dRI, and dVI.
- Mass method: Calculate g from the plot of molar mass versus elution volume using equation 4, MALS, and dRI, plus measurement of a linear counterpart under the same SEC conditions as those used for branched sample
The radius method is the simplest to implement, but for polymers smaller than ~10 nm in radius, the viscosity or mass method is required.
Case Studies
Polyester based on lactic acid (PLA) is a biocompatible and biodegradable polymer that can be used as a drug delivery material. Its ability to swell, degrade, and release an active compound can be controlled by the degree of branching. The release of an active compound can be controlled by altering the degree of branching to alter the rate of swelling and degradation of the polymer.
Method: The data presented in this study were obtained with a DAWN HELEOS MALS photometer, a ViscoStar on-line viscometer, an Optilab T-rEX refractive index detector, and an Eclipse A4F system, and processed with Astra 6 software, all from Wyatt Technology. SEC was performed with an Agilent 1100 HPLC instrument (Agilent Technologies). Tetrahydrofuran was the solvent for both the SEC and AF4 analysis.

Figure 1: Analysis of linear (blue) and branched (red) poly(lactic acid). (a): Mark-Houwink plots, exhibiting slopes of 0.56 and 0.31 for linear and branched molecules, respectively. (b): Molar mass versus elution volume overlaid with RI chromatograms.
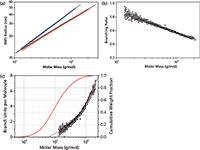
The characterization of branching for small PLA molecules is depicted in Figure 1, which compares Mark-Houwink plots and plots of molar mass versus elution volume of linear and branched molecules. Both indicate the presence of branched molecules and may be used to calculate g by means of equations 2–4. Figure 2 shows conformation plots of linear and branched polystyrene. Branching is shown by the measured slopes of 0.59 and 0.48. These can be compared with the two limiting theoretical values: 0.58 for linear polymers in thermodynamically good solvents, and 0.33 for compact spheres that can be considered "infinitely branched".

Figure 2: (a): Conformation plots of linear (blue) and branched (red) polystyrene. (b): The corresponding plot of branching ratio versus molar mass. (c): The number of branch units per molecule plotted versus molar mass. The plot of branch units per molecule versus molar mass is overlaid with the cumulative molar mass distribution (red), and the 3rd order fit to experimental data points (magenta). The slopes of the conformation plots of linear and branched polymer are 0.59 and 0.48, respectively.
The conformation data transform to plots of molar mass dependency of the branching ratio, and the number of branch units per molecule, shown in Figure 2. Overlaying the branching units plot with the cumulative distribution of molar mass facilitates quantitative evaluation of branching. Figure 2 shows that ˜≈ 28% of molecules with molar masses below ≈˜ 60,000 g/mol do not contain branch units. Notably, SEC–MALS is capable of detecting just a single branch until in polymer chains.
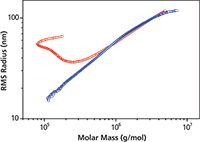
The SEC–MALS radius method may fail for some large, highly branched polymers because of limitations of the SEC separation mechanism, where the branches are temporarily "anchored" in the pores of SEC column packing.5 These polymers then elute abnormally at a retention time that corresponds to a much smaller hydrodynamic volume than actually presented by the molecule.5 As a result, fractions at large elution volumes become highly polydisperse containing both very small and very large branched species. MALS measures the weight-average molar mass (Mw) but the z-average RMS radius (R z). As long as elution fractions are reasonably monodisperse, the weightings of (R z and Mw are nearly identical, but with increased polydispersity they diverge. The combination of polydisperse, abnormal SEC elution with disparate weightings of R and M by MALS results in upswings on the conformation plots at the low end of the molar mass axis (horizontal) and consequently incorrect values of g.5
For such polymers, AF4 has proven to provide better results.6
A comparison of conformation plots obtained by SEC–MALS and AF4–MALS for cellulose tricarbanilate is depicted in Figure 3. The separation by AF4 is not affected by the anchoring of branched molecules and the upswing is completely eliminated.

Figure 3: Conformation plots of cellulose tricarbanilate, a branched polymer exhibiting "anchoring", determined by SECâMALS (red) and AF4âMALS (blue).
Conclusion
The demand for an absolute technique that can provide robust and reliable polymer characterization has led to recognition of the powerful capabilities of MALS. This study shows that the most direct and fundamentally correct technique for characterizing branching in polymers is the MALS-based radius method, though it is limited to molecules with RMS radii > 10 nm. Smaller branched polymers can be characterized by adding a differential viscometer to a SEC–MALS system for Mark-Houwink plots, or MALS-based determination of the relation between the molar mass and elution volume. When separation is adversely impacted by the anchoring of branched macromolecules in the pores of SEC column packing, AF4–MALS offers great separation and yields correct conformation plots and branching ratios. AF4–MALS is suitable for all types of polymers.
References
1. S. Podzimek, M. Hermannova, H. Bilerova, Z. Bezakova, and V. Velebny, J. Appl. Polymer Sci. 116, 3013 (2010).
2. B.H. Zimm and W.H. Stockmayer, J. Chem. Phys. 17, 1301 (1949).
3. B.H. Zimm and R.W. Kilb, J. Polym. Sci. 37,19 (1959).
4. L.P. Yu and J.E. Rollings, J. Appl. Polym. Sci. 33, 1909 (1987).
5. S. Podzimek, T. Vlcek, and C. Johann, J. Appl. Polym. Sci. 81, 1588 (2001).
6. S. Podzimek: Light Scattering, Size Exclusion Chromatography and Asymmetric Flow Field Flow Fractionation, Wiley, 2011. DOI: [978-0470386170].
Stepan Podzimek heads the Department of Analytical and Physical Chemistry at SYNPO, a Czech R&D company conducting contract research in synthetic polymers and related materials. He also holds a professorial position at the Institute of Chemistry and Technology of Macromolecular Materials at the University of Pardubice, Czech Republic, and is a scientific consultant for Wyatt Technology Corporation.
E-mail: stepan.podzimek@synpo.cz
Website: www.synpo.cz
This article is from The Column. The full issue can be found here:http://images2.advanstar.com/PixelMags/lctc/digitaledition/June05-2014-uk.html

Determining the Effects of ‘Quantitative Marinating’ on Crayfish Meat with HS-GC-IMS
April 30th 2025A novel method called quantitative marinating (QM) was developed to reduce industrial waste during the processing of crayfish meat, with the taste, flavor, and aroma of crayfish meat processed by various techniques investigated. Headspace-gas chromatography-ion mobility spectrometry (HS-GC-IMS) was used to determine volatile compounds of meat examined.
University of Tasmania Researchers Explore Haloacetic Acid Determiniation in Water with capLC–MS
April 29th 2025Haloacetic acid detection has become important when analyzing drinking and swimming pool water. University of Tasmania researchers have begun applying capillary liquid chromatography as a means of detecting these substances.
Using GC-MS to Measure Improvement Efforts to TNT-Contaminated Soil
April 29th 2025Researchers developing a plant microbial consortium that can repair in-situ high concentration TNT (1434 mg/kg) contaminated soil, as well as overcome the limitations of previous studies that only focused on simulated pollution, used untargeted metabolone gas chromatography-mass spectrometry (GC-MS) to measure their success.

.png&w=3840&q=75)

.png&w=3840&q=75)


.png&w=3840&q=75)


.png&w=3840&q=75)


