A Theoretical and Practical Approach to Manage High Peak Capacity and Low Dilution in On-line Comprehensive Reversed-Phase LC × Reversed-Phase LC: A Comparison with 1D-Reversed-Phase LC
On-line comprehensive two-dimensional liquid chromatography (on-line LC×LC) provides much higher separation power (higher peak capacity) than one-dimensional liquid chromatography (1D-LC). However, it is also often thought that a larger peak capacity should be obtained at the expense of a higher dilution (lower peak intensity). From a theoretical approach, it is demonstrated that both demands can go hand-in-hand in on-line reversed-phase LC×reversed-phase LC (higher peak capacity and higher peak intensity). Examples involving “sub-hour” separations of a tryptic digest show how this approach can be applied in practice.
On-line comprehensive two-dimensional liquid chromatography (on-line LC×LC) provides much higher separation power (higher peak capacity) than one-dimensional liquid chromatography (1D-LC). However, it is also often thought that a larger peak capacity should be obtained at the expense of a higher dilution (lower peak intensity). From a theoretical approach, it is demonstrated that both demands can go hand-in-hand in on-line reversed-phase LC×reversed-phase LC (higher peak capacity and higher peak intensity). Examples involving “sub-hour” separations of a tryptic digest show how this approach can be applied in practice.
As a result of its huge separation power within relatively short analysis times, comprehensive two-dimensional liquid chromatography (LC×LC) has been used in a wide variety of applications over the past ten years. The large number of recent books and reviews dealing with 2D-LC applications is an indication of the attractiveness of this separation technique (1–4). The final goal of LC×LC is to obtain the highest possible separation power (high peak capacity) with the highest possible peak intensity (low dilution), within the shortest possible analysis time. Among these three conflicting goals, the separation power (peak capacity) and the analysis time (the gradient time of the first dimension) are usually considered as the critical quality descriptors, while the dilution is most often disregarded. For the separation of peptides or, more generally, for the separation of ionizable compounds, the use of reversed-phase LC in both dimensions allows impressive peak capacities by simply changing the pH between both dimensions to be achieved (5). For given analysis times, recent studies have compared the peak capacities obtained in 1D-reversed-phase LC against reversed-phase LC×reversed-phase LC. For peptides, it was found that reversed-phase LC×reversed-phase LC outperforms 1D-reversed-phase LC above a total analysis time of 5 min (6). More recently, a peak capacity of 10 000 was achieved in four hours using an active modulation approach (7). Compared to conventional one-dimensional liquid chromatography (1D-LC), LC×LC is usually thought to provide limited performance in terms of sensitivity as a result of solute dilution during the separation process. However, a comprehensive and fair comparison of dilution between these two separation techniques has never been investigated so far. In this article, the concept of dilution in gradient elution is revisited to provide efficient tools to compare in a reliable manner the dilution factors between 1D-reversed-phase LC and reversed-phase LC×reversed-phase LC. The validity of the proposed method is assessed through the separations of peptides in 1D-reversed-phase LC and in reversed-phase LC×reversed-phase LC.
Theoretical Approach
In gradient elution, the effective peak capacity, neff, can be estimated by:
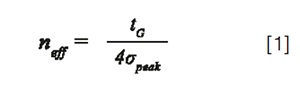
Where tG is the gradient time and σpeak, the average peak standard deviation in time units, resulting from band broadening into the entire separation system (instrument and column).
In 1D-LC, the sample dilution depends on both the injection volume and the peak width. Assuming a Gaussian peak shape, the dilution factor, DF, is given by the following relationship:

Where σcol is the column peak standard deviation in volume units, and Vi, the injected volume. β corrects for additional band broadening due to extra-column dispersion (β = σcol/σpeak). It may vary from 0 to 1 depending on the importance of extra-column dispersion. Ideally, β should be higher than 0.7 (β² > 0.5) otherwise the loss in plates becomes too significant (>50%) and, furthermore, the assumption of a Gaussian peak shape becomes unacceptable (6). According to equation 1, β represents the fraction of remaining peak capacity. It is given by:

With x², the ratio of the peak variance, resulting from extra-column dispersion, to the peak variance, resulting from column dispersion (σ2col):

σ2ext is the additional extra-column variance due to band broadening in the capillary tubes and in the detector cell, δ2 is a correction factor which depends on the injection process (12 for an ideal injection plug and close to 4 in practice) (8). CF is the peak injection compression factor: CF > 1 if the injection plug is narrowed by on-column focusing (injection solvent weaker than the mobile phase), CF < 1 if the injection plug is broadened when travelling across the column (injection solvent stronger than the mobile phase), and CF = 1 if the injection solvent corresponds to the mobile phase. In gradient elution, the considered mobile phase is the solvent which accompanies solute elution. Assuming that the injection process is the main cause of extra-column dispersion, σ2ext can be considered as close to 0 and then the combination of equations 3 and 4 leads to:

For a given injection compression factor, equation 5 permits the calculation of the injected volume able to keep a given β value (ideally > 0.7 as mentioned previously). For example, in the situation where the injection solvent corresponds to the elution composition of the first eluted solute, that is, CF = 1 for this one), the volume that can be injected while keeping 90% or more of the peak capacity for all peaks (exactly 90% for the first eluted one) should be close to the column standard deviation (Vi = σcol).
If the injection volume is selected from equation 5, the dilution factor can then be expressed as:

According to equation 6, the dilution factor should be 2.9 for the least retained compound in the above example (assuming δ = 2). More generally, if the injected volume is selected as a multiple (λ) of the column standard deviation in such a way that β remains very close to 1 (x close to 0), then the dilution factor is close to √2πλ for all peaks in any gradient conditions (equation 2). In most reported studies dealing with the comparison of performance between different separation techniques, the injection volume is either fixed (9) or adapted to the column dead volume (6), but never adapted to the gradient conditions and hence to the column standard deviation. However, this latter approach, based on a proper preliminary selection of λ, is much more attractive because, in this case, dilution and, therefore, peak intensity becomes independent of gradient conditions, that is, flow-rate, column geometry, gradient time, column plate number. Of course, that requires a reliable prediction of the column standard deviation, which is given in gradient elution by:

Where V0 is the column dead volume which can be calculated from both the column dimensions and the total column porosity. Ncol is the column plate number which can be estimated from the column length, the particle diameter, Knox curve coefficients and predicted diffusion coefficients (10), ke is the retention factor at the time the solute is eluted, and G is the peak compression factor (11), taking into account band compression, especially in the case of very steep gradients. For the rest of this study, G will be assumed to be close to 1 in every gradient conditions.
For linear solvent strength (LSS) gradients (12) such as linear gradients in reversed-phase liquid chromatography (RPLC) and for large retention factors at initial composition, ke can be expressed as:

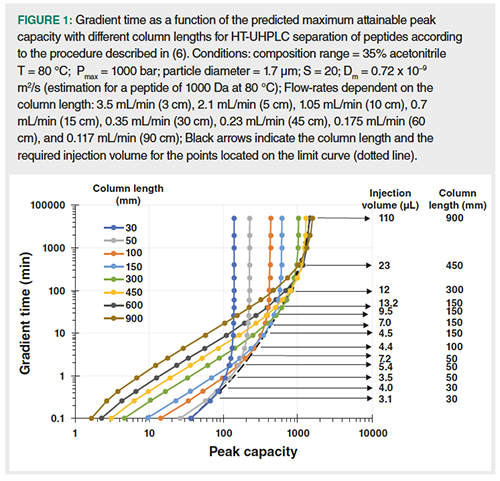
Where s is the normalized gradient slope (s =âC x t0/tG, with âC the composition range and t0, the column dead time) and S, the slope of the relationship between the logarithm of the retention factor and the eluent composition. It should be noted that the calculation of σcol makes it also possible to predict the peak capacity in any gradient conditions according to equation 1. Figure 1 shows the calculated kinetic curves for different column lengths. Each curve represents the gradient time as a function of the predicted maximum attainable peak capacity. These curves were calculated for peptides (assuming a β value close to 1) according to the procedure described in reference 6. For a given particle diameter and a given column temperature, each column length, that is, each curve, is related to the highest possible flow-rate considering the maximum allowable pressure (here 1000 bar), thereby leading to the highest column plate number that can be achieved with the resulting column dead time (13–15). It is widely accepted that reducing the particle size and increasing column temperature allows an increase in the column plate number per time unit (16). The curves in Figure 1 were therefore predicted under high-temperature-ultra-high performance liquid chromatography (HT-UHPLC) conditions (sub-2-µm particles, here 1.7 µm were used at a temperature of 80 °C which is the highest column temperature that can be applied to current silica-based columns for a long term period). The limit curve (dotted line in Figure 1) gives the maximum attainable peak capacity for a given gradient time, for example, 530 in 30 min, or the shortest gradient time for a given peak capacity, for example, 3 days for 1500. It is important to insist on the fact that the limit curve to the best existing sets of conditions in 1D-LC, with packed columns, for the separation of peptides. In such HT-UHPLC conditions, the peak capacity seems to tend towards a limit of about 2000. Each circle data point located on the limit curve corresponds to a set of conditions including column length, flow-rate, gradient time, and also the calculated to provide similar peak intensities in all gradient conditions. The arrows in Figure 1 indicate the column lengths and the injection volumes for a λ value of 1. The required injection volume increases with the gradient time for a given column length.
In addition to be more attractive due to its ability to standardize the dilution in 1D-LC, the proposed approach is, in our opinion, the only way to provide a relevant comparison in term of dilution between 1D-LC and on-line LC×LC. This is of prime importance in the light of the smooth gradients usually applied in the first dimension (1D) which lead to large peaks and hence high dilution when the injected volume is not properly adapted. Injection volumes in 1D calculated in a similar way than as in 1D-LC (same λ value) should lead to similar peak intensities. The dilution factor in LC×LC is usually considered as the product of the dilution factors in each dimension (DF = 1DF× 2DF). Because 1DF should be close to any dilution factor in 1D-LC (provided that λ is kept identical), the comparison of the dilution between 1D-LC and on-line LC×LC thus becomes only dependent on 2DF.
Equations 1, 2, 3 and 4 can be applied in 2D as well. As discussed above, 2Vi/2σcol can be increased and hence 2DF decreased provided that the CF-injection compression factor is high enough to ensure that 2β > 0.7. The injection compression factor is related to two solute retention factors: ks, obtained with the injection solvent as mobile phase, and ke, obtained with the mobile phase at elution. CF is usually well approximated by the following relationship (10,17,18):
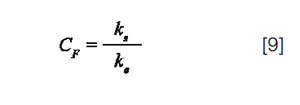
In the particular case of on-line reversed-phase LC×reversed-phase LC, with ke values expected to be similar in both dimensions (ks = 1ke), The injection compression factor in 2D can be predicted according to (10):
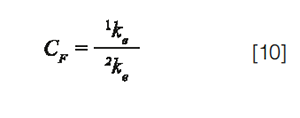
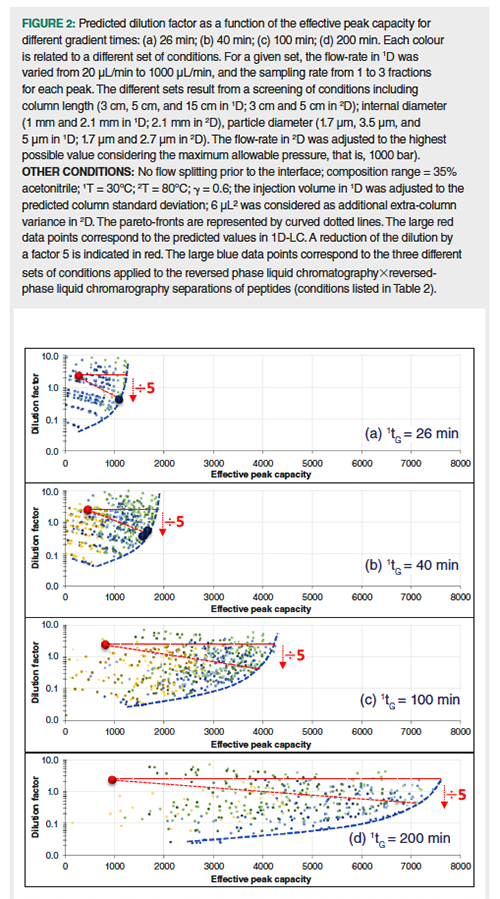
An optimization procedure has been developed for on-line LC×LC separations, based on predictive calculations tools (10). As was shown, very steep gradient in 2D (low 2ke) along with smooth gradient in 1D (high 1ke) were able to provide low dilution in 2D due to the resulting high CF values. The reported procedure allowed to plot the dilution factor as a function of the effective peak capacity for different sets of LC×LC conditions (pareto plots), considering a given gradient time in the first dimension (given analysis time). Figure 2 shows the obtained pareto plots, calculated for four different gradient times (26 min, 40 min, 100 min, and 200 min for a composition range of 35%; all other conditions are given in the figure caption). Each colour is related to a set of conditions (column length, column diameter, and particle size in both dimensions). Each symbol is associated to both a flow-rate value in 1D and a sampling rate value. UHPLC instrumentation usually yields low values for σ2ext (typically < 10 µL²). However, unlike in 1D and in 1D-LC, its contribution to the total peak variance in 2D may be quite significant (equation 4) and was therefore taken into account in our calculations, that is, 6 µL²). As in Figure 1, a λ value of 1 was used for the calculation of injection volumes in 1D, leading to 1DF = 2.5 in all studied conditions. Note that the entire fraction, collected at the outlet of 1D, was injected in 2D (no flow splitting), even when the column diameter was the same in both dimensions, that is, 2.1 mm. The large red data points circles correspond to the best calculated peak capacities in 1D-LC (limit curve in Figure 1). For each gradient time, the pareto-front (blue dotted curve) represents the performance limit in reversed-phase LC×reversed-phase LC with respect to the target objectives, that is, maximizing the peak capacity while minimizing the dilution factor. The large blue circles data points correspond to the three different sets of conditions that were applied to the reversed-phase LC×reversed-phase LC separations of peptides (Table 3) as discussed below. These calculations give rise to some important comments:
- The maximum expected peak capacities are 1250, 1850, 4200, and 7600 in 26 min, 40 min, 100 min, and 200 min, respectively. Interestingly, the dilution factors at the maximum peak capacity are very close to the one predicted in 1D-LC, that is 2.5 (horizontal dotted line). It is important to underline that if post-first-dimension flow splitting was taken into account, pareto optimum curves would be shifted towards even more impressive peak capacities but also higher dilution.
- The dilution factors in LC×LC can be decreased by a factor 5 without sacrificing too much of the peak capacity as highlighted by the red dotted lines.
- The dilution factors can be further decreased while keeping fairly good peak capacities. For example, a decrease in the dilution factor by a factor of 25 only leads to a decrease of 40% (26 min), 39% (40 min), 31% (100 min), and 28% (200 min) of the peak capacity.
- Among the various conditions evaluated, those involving a short column in 1D (typically 5 cm) and a very short column packed with sub-2-µm particles in 2D (typically 3 cm and 1.7 µm) were always located onto or close to the pareto curve. This is surprising for long analysis times, for example, 200 min, for which longer columns in 1D are usually recommended.
- It is noteworthy that dilution factors are not higher when using a 1-mm column diameter, rather than a 2.1-mm column diameter in 1D. This is confirmed experimentally in the next section.
Methods and Materials
Chemicals: Acetonitrile (LC–MS grade) was purchased from Sigma-Aldrich (Steinheim, Germany). An Elga Purelab Classic UV purification system from Veolia water STI (Décines-Charpieu, France) was used for water purification and deionization. Formic acid (LC/MS grade), ammonium acetate, and ammonium bicarbonate (both analytical reagent grade) were obtained from Fisher Scientific (Illkirch, France). DL-1,4-dithiothreitol (DTT, 99%) and iodoacetamide (98%) were obtained from Acros Organics (Geel, Belgium). Trypsin, human serum albumin (HSA), bovine serum albumine (BSA), β-casein, myoglobin, lysozyme, and cytochrom C were all obtained from Sigma-Aldrich (Steinheim, Germany). Influenza hemaglutinin (HA), leucine encephalin, bombesin, [arg8]-Vasopressin, [ile]-Angiotensin, bradykinin fragment 1-5, substance P, and bradykinin were obtained from Merck (Molsheim, France). The protein digest sample was obtained by tryptic digestion of six proteins (HSA, BSA, β-casein, myoglobin, lysozyme and cytochrome C) following a protocol described elsewhere (10,19). The ratio enzyme to substrate was 1/70, resulting in a complex sample containing 196 peptides with an average concentration of 120 mg/L.
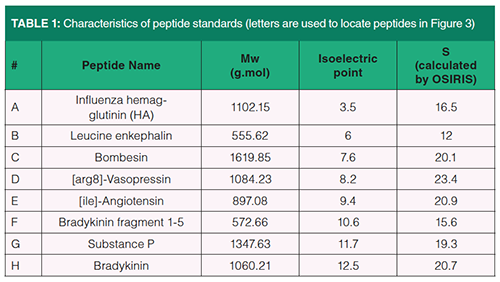
The standard sample was obtained by diluting eight peptides in pure water at a concentration of 32 mg/L. Their characteristics are listed in Table 1.
Both samples were filtered on a 0.22-µm PVDF (polyvinylidene) membrane before injection.
Instrumentation: 2D-LC experiments were performed on a 1290 Infinity series 2D-LC system from Agilent Technologies (Waldbronn, Germany). The system includes: two high-pressure binary solvent delivery pumps, an autosampler with a flow-through needle injector, two thermostated column compartments with low-dispersion preheaters, and two diode-array detectors (DAD) with 0.6 µL flow-cells. The interface connecting the two dimensions was a 2-position/4-port duo valve, equipped with two identical 80-µL loops. The loops were emptied in back-flush mode to minimize band dispersion. A pressure release kit was placed between 1D outlet and the interface inlet to minimize the pressure downstream coming from the valve switching. The measured dwell volumes and extra-column volumes were respectively 140 µL and 22 µL in 1D, and 45 µL and 8.5 µL in 2D (loop volumes excluded). For 1D-LC experiments, only the first dimension of this system was used. In both cases, the system was hyphenated to a quadrupole-time-of-flight (QTOF) high resolution mass spectrometer (model G6560B) from Agilent Technologies, equipped with a JetStream electrospray ionization (ESI) source. As a result of the very high flow rates operated in 2D, the effluent coming from 2D was split (1:2) before entering the source. Instrument controlling was performed with OpenLab CDS Chemstration software (Agilent) for the 2D-LC-UV system, and MassHunter software (Agilent) for the mass spectrometer. UV data were acquired at 210 nm with an acquisition rate of 40 Hz in 1D-LC, 20 Hz in 1D, and 80 Hz in 2D. High resolution mass spectrometry (HRMS) data were acquired in positive ion mode from 100 to 3200 Da, with an acquisition rate of 20 spectra/s. The operational parameters for the QTOF instrument were the following: drying gas temperature (300 °C), drying gas flow (11 L/min), nebulizer gas pressure (40 psi), sheath gas temperature (350 °C), sheath gas flow rate (11 L/min), capillary voltage (3500 V), nozzle voltage (300 V), fragmentor voltage (150 V), Oct 1 RV voltage (750 V), respectively. HRMS data were processed with MassHunter qualitative analysis software (Agilent).
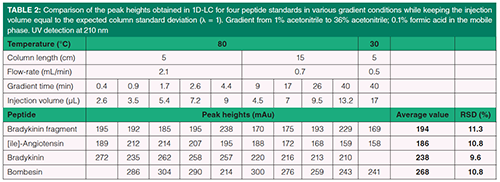
In 1D-reversed-phase LC, the separations were performed on two 1.7 µm Acquity CSH C18 columns (Waters). The column dimensions were either 50 mm × 2.1 mm, or 150 mm × 2.1 mm. The mobile phase was composed of water with 0.1% formic acid as solvent A, and acetonitrile with 0.1% formic acid as solvent B (pH = 2.7). The gradient elution was performed from 1% B to 35% B with different gradient times. The gradient time was followed by a quick return to initial eluent composition (1t0) and a short column equilibration time (5t0).The several sets of conditions that were used are given in Table 2.
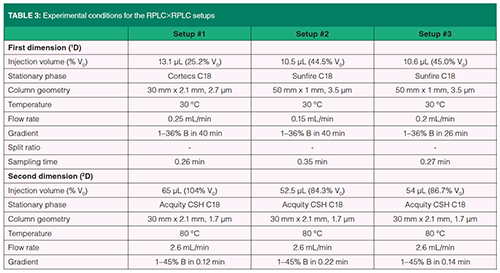
Experimental conditions for the three LC×LC set-ups are given in Table 3.
1D-LC–UV and 2D-LC–UV data were processed using Excel and an in-house script written under MATLAB 7.7. The S values for the eight peptides (listed in Table 2) were determined from a HPLC modelling software (OSIRIS 4.2, Euradif, Grenoble, France) from two gradient data (10 min and 30 min).
Experimental validation
The objective of this practical approach was to assess to what extent experimental results are consistent with the calculations above.
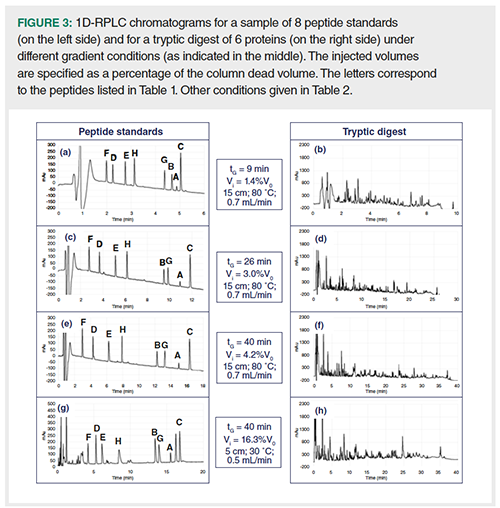
A series of ten gradient runs was carried out in 1D-LC with conditions close to those given in Figure 1 (located onto the limit curve). Ten different sets of gradient conditions (listed in Table 2) were applied to a sample of eight peptide standards and to a tryptic digest of 6 proteins. UV detection was used to compare the peak heights while HRMS detection was used to identify the different peaks. Figure 3 shows the UV-chromatograms obtained with the two samples with four different sets of conditions. As expected, the peak intensities seem to be very similar for a given sample regardless of the gradient conditions. Table 2 lists, for four peptide standards, the measured peak heights obtained with the ten sets of conditions. As highlighted by RSD values, that is, around 10%, the change in gradient conditions has very little impact on peak heights, thereby demonstrating that injection volumes were properly determined from the predicted peak width. Furthermore, good peak shapes could be obtained for both samples, even for the least retained peptides, suggesting that our preliminary assumption (β values close to 1 for all peaks with λ = Vi/σcol = 1) was correct. Particular attention should be paid to the gradient conditions on the right side of Table 2 (see also Figures 3[g] and 3[h]). These conditions are very close to those usually applied to a first dimension in on-line reversed-phase LC×reversed-phase LC. They include a short column, that is 5 cm, a long gradient time, that is 40 min, a column temperature of 30 °C, and a flow-rate well below the highest possible one, that is, 0.5 mL/min versus 1.2 mL/min. Such conditions imply very large peak widths (high ke values) and hence large injection volumes (17 µL, that is about 16% V0). Despite this, peak intensities remain very similar to those obtained in optimum 1D-LC conditions. Our first assumption was that, for any gradient conditions in 1D-reversed-phase LC, it should be possible to keep similar peak heights by injecting the appropriate calculated volume. This assumption seems to be validated by this experimental study.
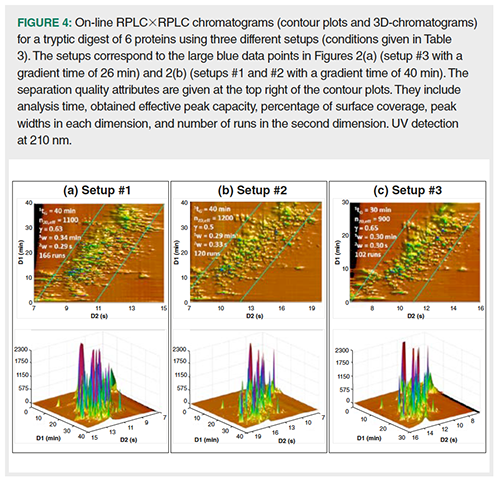
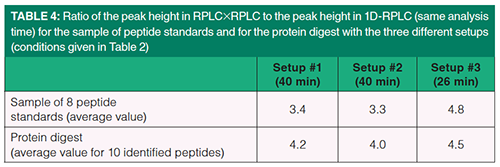
Our second assumption was that the dilution in on-line reversed-phase LC ×reversed-phase LC should be greatly reduced compared to 1D-reversed-phase LC. This is demonstrated in Figure 4, showing on-line reversed-phase LC×reversed-phase LC chromatograms for the tryptic digest of six proteins. Three different setups were selected with conditions listed in Table 3. The predicted performance of these setups can be seen in Figures 2(a) (setup #3), and 2(b) (setups #1 and #2). In Figure 4, the contour plots (top figure) show the retention space while the 3D-chromatograms (bottom figure) reveal the peak intensities. The separation quality attributes are given in Figure 4 at top left of the contour plots. They include analysis time, obtained effective peak capacity, percentage of surface coverage, peak widths in each dimension, and number of runs in the second dimension. As can be seen, the obtained effective peak capacities are very close to (slightly lower than) those predicted in Figure 2. They were found to be 2.5 times (in 26 min) and 3.5 times (in 40 min) higher than in 1D-reversed-phase LC (Figures 3(d) and 3(f) respectively). More important is the increase in peak intensity (reported in Table 4) for both studied samples. Peak intensities were multiplied by an average factor of 3.3 to 4.5 depending on the setup. Such increase is in very good agreement with the predictions shown in Figure 2 (a predicted factor of 5). It can also be noted that setups #1 and #2 which differ from the column diameter in 1D (that is, 2.1 mm and 1 mm respectively), lead to quite similar peak capacities (no additional band broadening with 2.1 mm) and quite similar peak intensities (no additional dilution with 1 mm). The number of runs in 2D could be the final quality attribute (120 with 1 mm versus 166 with 2.1 mm) to define the best set of conditions.
Conclusion
From both a theoretical approach and an experimental study on peptides, it has been shown that similar dilution factors and hence similar peak heights can be obtained in any 1D-reversed-phase LC gradient conditions, by injecting the appropriate volume, based on a multiple of the column standard deviation.
This approach, applied to the first dimension of on-line reversed-phase LC×reversed-phase LC, allows an unbiased comparison between the dilution factors obtained in 1D-reversed-phase LC and those in on-line reversed-phase LC×reversed-phase LC. As a result of an important focusing effect in the second dimension (high CF values), very large volumes can be injected, thereby significantly reducing the dilution factor in the second dimension and hence the dilution factor in reversed-phase LC×reversed-phase LC, even when the column diameter is smaller in the first dimension, for example, 1 mm versus 2.1 mm. According to our calculations, the dilution factor might be reduced by a factor of up to 25 in on-line reversed-phase LC×reversed-phase LC while keeping an impressive peak capacity compared to 1D-reversed-phase LC. This seems to be especially attractive for long analysis times (> one hour).
For sub-hour separations of a protein digest, our experimental results were in perfect agreement with the predicted ones. For an analysis time of 40 min, the peak intensities could be increased by a factor close to 5 in reversed-phase LC×reversed-phase LC while the peak capacity was increased by a factor of 3 compared to the optimum 1D-reversed-phase LC separation.
References
- S. Chapel, F. Rouvière, M. Sarrut, and S. Heinisch, Two-Dimensional Liquid Chromatography Coupled to High-Resolution Mass Spectrometry for the Analysis of ADCsin Antibody-Drug Conjugates: Methods and Protocols (ed. Tumey, L. N.), 163–185 (Springer US, New York, NY, 2020). doi:10.1007/978-1-4939-9929-3_11
- M. Sarrut, G. Crétier, and S. Heinisch, TrAC Trends in Analytical Chemistry63, 104–112 (2014).
- B.W.J. Pirok, D.R. Stoll, and P.J. Schoenmakers, Anal. Chem.91(1), 240–263 (2019).
- D.R. Stoll and P.W. Carr, Anal. Chem.89(1) 519–531 (2017).
- A. D’Attoma, C. Grivel, and S. Heinisch, J. Chromatogr. A.1262, 148–159 (2012).
- M. Sarrut, F. Rouvière, and S. Heinisch, J. Chromatogr. A.1498, 183–195 (2017).
- D.R. Stoll et al., J. Chromatogr. B.1134–1135, 121832 (2019).
- J.C. Sternberg, in: J.C. Giddings, R.A. Keller (Eds.), Advances in Chromatography, vol. 2, Dekker, New York, 1966, p. 205
- G. Vivó-Truyols, S.J. van der Wal, and P.J. Schoenmakers, Anal. Chem.82(20), 8525–8536 (2010).
- M. Sarrut, A. D’Attoma, and S. Heinisch, J. Chromatogr. A.1421, 48–59 (2015).
- L.R. Snyder and D.L. Saunders, J. Chromatogr. Sci.7(4), 195–208 (1969).
- L.R. Snyder, J.W. Dolan, and J.R. Gant, J. Chromatogr. A.165(1), 3–30 (1979).
- H. Poppe, J. Chromatogr. A.778(1), 3–21 (1997).
- J.C. Giddings, Anal. Chem.37(1), 60–63 (1965).
- G. Desmet, D. Clicq, and P. Gzil, Anal. Chem.77(13), 4058–4070 (2005).
- S. Heinisch and J.L. Rocca, J. Chromatogr. A. 1216(4), 642–658 (2009).
- S.R. Groskreutz and S.G. Weber, J. Chromatogr. A.1409, 116–124 (2015).
- M. Martin, M. Mishra, A. De Wit, C. Grivel, and S. Heinisch, in: 28th International Symposium on Chromatography ISC, Valencia, 2010.
- S. Chapel, F. Rouvière, and S. Heinisch, J. Chromatogr. A. 460753 (2019). doi:10.1016/j.chroma.2019.460753
Sabine Heinisch is a research team leader at ISA (Institute of Analytical Science), Université de Lyon, France. She is interested in the fundamentals and applications of liquid chromatography. Her primary research topic is on the development of on-line LC×LC-HRMS for the separation of pharmaceuticals, peptides or therapeutic proteins. Her research interest also covers the development of LC×SFC for chiral compounds or biomass byproducts. She has published more than 70 referred articles, five book chapters, and has given more than 150 oral presentations.
Soraya Chapel obtained her M.Sc. degree in 2017 from the University of Toulouse, France. She now is a Ph.D. student under the supervision of Sabine Heinisch at the Université de Lyon. Her research focuses on the optimization of on-line LC×LC for the characterization of biomolecules, such as peptides, monoclonal antibodies, and antibody-drug conjugates. She received the Best Oral Communication AFSEP Award at the SEP 2019 conference in Paris, France, and was among the 10 finalists for the Csaba Horváth Young Scientist Award at HPLC 2019 in Milan, Italy.
Florent Rouvière is a technician at the Institute of Analytical Science (Lyon, France) in the team led by Sabine Heinisch.

New Study Reviews Chromatography Methods for Flavonoid Analysis
April 21st 2025Flavonoids are widely used metabolites that carry out various functions in different industries, such as food and cosmetics. Detecting, separating, and quantifying them in fruit species can be a complicated process.
Extracting Estrogenic Hormones Using Rotating Disk and Modified Clays
April 14th 2025University of Caldas and University of Chile researchers extracted estrogenic hormones from wastewater samples using rotating disk sorption extraction. After extraction, the concentrated analytes were measured using liquid chromatography coupled with photodiode array detection (HPLC-PDA).

.png&w=3840&q=75)

.png&w=3840&q=75)


.png&w=3840&q=75)


.png&w=3840&q=75)


