Successful Gas Chromatography Using Fused-Silica Capillary Columns
Capillary gas chromatography (GC) is a well-established separation technique. Rick Parmely reviews some of the capillary column basics by investigating a standard test mixture and observing some of the chromatographic effects that can affect peak response, peak shape and column bleed. He provides guidelines for obtaining the best performance from a capillary column. He discusses peak tailing, column overload, ghost peaks and column bleed and speculates on "when to give up." He concludes with a set of fundamental steps to be used in achieving better GC analyses.
Fused-silica capillary columns are used routinely in a wide variety of gas chromatography (GC) applications ranging from environmental analysis to food testing to pharmaceutical product quality assurance. What is a fused-silica capillary column? What problems can develop with a fused-silica column that might affect data quality and analytical results? How can I address and correct problems when they do occur, and as importantly, when should I give up the fight? Finally, what fundamental steps will lead to better analysis when using this technology? These questions will be addressed in this article.
A fused-silica capillary column is a narrow bore, open tube coated–bonded on the inside with a polymer stationary phase and on the outside with a polyimide polymer to add strength and flexibility. Compare this to a 4 in. sewer drain pipe in your basement. The rigid white plastic outside is like the polyimide-coated fused silica, while the ubiquitous inside layer of slime can be related to the polymer stationary phase coating applied by the column manufacturer. For the most part, the inside space is wide open, both in your sewer pipe and in a capillary column. A fascinating article by Steve Griffin, founder of InnovaQuartz (Phoenix, Arizona, USA) a premier manufacturer of fused-silica capillaries, details the history, manufacturing process and inherent quality issues of fused-silica capillaries.1 In that article, Griffin notes, "Some of these problems include variations in capillary bore and outer dimensions, ovality and random brittleness, and surface activity." The last mentioned issue of surface activity could describe a wide variety of polymer coating issues. These include polymer-component activity, poor coating efficiency, polymer contamination and others.
Column Efficiency
In the book, Modern Practice of Gas Chromatography,2 Gene Barry notes, "An ideal gas chromatographic column is considered to have high resolving power, high speed of operation, and high capacity." How is "resolving power" assessed and why is it important? Columns that resolve well are said to be efficient, and typically, manufacturers will report a number tied to efficiency that is related to the number of resolving plates that can be theoretically measured during testing of the column. Column efficiency, in the most fundamental terms, is usually related to some measure of the column's effective plate number Neff.

As the equation indicates, efficiency can be related directly to the adjusted retention time (tR') of the peak and is inversely proportional to the square of the peak width at its base (wb). Thus, as analytes rapidly move through the column as very narrow bands, they are expressed by the detector as narrow peaks, indicating large numbers of theoretical plates and a high-efficiency column. What does this mean in practical terms? The trend these days is to perform shorter and shorter runs, meaning that peaks must become even narrower. Gains in column efficiency along with good chromatography practice support this trend.
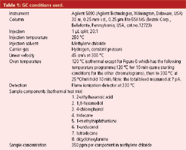
Table 1: GC conditions used.
In Figure 1, chromatographic peaks are narrow and sharp, indicating high efficiency. The experimental conditions used for this chromatogram are shown in Table 1. In subsequent figures, we will use this same test sample and chromatographic conditions to indicate potential problems that can be encountered when using capillary GC.
Efficiency is important but, in practice, chromatographers are interested in resolving their peaks of interest. So, chromatographic resolution, depicted in Equation 2, is most important or better yet, resolution per unit time — the best resolution in the shortest possible time. Table 2 not only defines the variables affecting chromatographic resolution, but also gives some hints for chromatographers on how to influence efficiency in separations.

where h is the plate height, which is related to the number of theoretical plates (N).
But there are other problems that can be discerned from the size, shape or nature of the chromatographic peak. Next, we will examine a variety of peaks and see what their relationship is to our gas chromatographic separation.
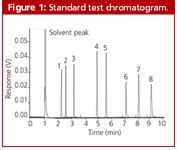
Figure 1
Peak Response
Three types of response problems are observed in GC laboratories
- higher than expected response
- no response
- lower than expected response.
A higher-than-expected response results when more sample is delivered on-column and subsequently is detected. A broad, tailing solvent peak with a flat top is the extreme but common example of this type of response; but other components in the injected mixture might also demonstrate this problem. No response usually indicates a lack of sample, the sample did not reach the detector because of a leak, total adsorption or it totally broke down into something else in the injection port or on-column. Of these response problems, low response can be the most difficult to diagnose. Low response can be caused by partial loss of sample as a result of sample preparation issues (volatiles vaporizing or semivolatiles precipitating in solution), poor injection techniques or poor injector vaporization, to name just a few causes. In short, low response can be difficult to diagnose and fix but can have huge impact on calibration and, thus, on accurate quantification.

Table 2: Variable affecting GC resolution.
Figure 2 shows an example of low response observed for our test sample. Note that all peaks are shorter, compared with the chromatogram in Figure 1. In this instance, the chromatographer inadvertently injected less sample than desired because of poor attention to the amount of solution present in the autosampler vial. He simply did not inject the desired amount.
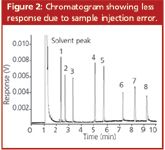
Figure 2
Peak Shape
At times in GC, perfect Gaussian shapes are not obtained. What causes these peak distortions, and more importantly, what can be done about them? Let us examine three scenarios that might lead to poor peak shapes and see what can be done to make improvements.
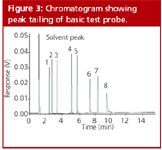
Figure 3
Tailing peaks: Tailing peaks generally indicate interaction of a sample component with something along the sample pathway (an active surface), or alternately, tailing peaks might indicate a turbulent flow in some portion of the flow stream as the sample moves from the injector to the detector. Interactive sites, or activity, in the sample pathway could be in the injection port, in the form of a septum particle or a poorly deactivated inlet liner. Problems in the injection port are sometimes a cause of tailing peaks (as well as other problems), but other sites in the sample pathway — transfer lines, valves and so forth — also can be interactive. The practical suggestion is to ensure that the sample pathway is as inert as possible. Proper physical installation of the column is also critical. A poor column cut followed by poor installation in either the injector or detector can be disastrous.
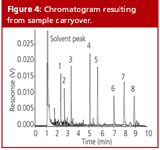
Figure 4
If you are using gas sampling systems or dual column configurations, special care must be taken to minimize dead volumes that can cause nonlaminar flow in the sample stream. Otherwise, peak tailing can result. Late-eluted compounds also might tail when column activity is present because of poor phase coverage, poor initial deactivation of the fused silica surface or simply incompatibility with the stationary phase. The example shown in Figure 3 is the basic compound dicyclohexylamine, which is the last of the late-eluted probes and tails severely because of a liner activity problem. In this instance, septum coring has deposited reactive septum particles inside the inlet liner.

Table 3: The top ten habits of successful gas chromatographers.6
Ghost peaks: Have you ever returned to your shopping trolley in the supermarket aisle and found an extra item in it? Similarly, extra material can show up at the detector from a variety of sources. Like the extra can of soup in your shopping trolley, we need to backtrack to find out where it came from and how to eliminate it. Ask yourself the following questions:
- Check your sample preparation procedures. Have these procedures eliminated all possible side contaminations from the matrix?
- What about the injection made by the syringe? Is the sample vial, rinse solvent or syringe itself contaminated?
- What about previous chromatographic runs? Were you careful not to inject too much sample that potentially could backflash into split vent and gas supply lines? Remember, the inlet liner has a limited internal volume (fixed by the geometry), and when exceeded by a vaporized sample, material can spill into other parts of the chromatographic system. Materials condensed into these lines will eventually make it back to your column and into later chromatograms.
Figure 4 shows an example of the observation of ghost peaks. A large volume injection of hydrocarbons was run before analysing our test mixture. Carryover was observed in the form of extra peaks just above the baseline noise in the chromatogram. Rigorous cleaning of all injection port parts, including the connecting gas lines, might be necessary to address this problem.
Fronting peaks (column overload): Fronting peaks can generally be attributed to column overload; that is, putting more material on-column than the column, amount of stationary phase, or thermal conditions will allow. The peak shape is "shark-finned" with a gradual rise from baseline to a sharp peak maximum and rapid drop-off to baseline. In Figure 5, the first peak provides an extreme example of this "shark-fin" shape, while the remaining peaks show similar but somewhat reduced behaviour. What causes overloading and how can it be eliminated? It is generally believed that the normal stationary–mobile phase equilibrium shifts towards higher concentrations on the stationary phase.3 Thus, at the detector, small amounts of nonretained solute are detected first and gradually the retained portions "catch up" to develop into a "normal" chromatogram as seen in Figure 5. How can overloading be corrected? The problem lies in the equilibrium within the column. Preventing overload is accomplished by thickening the phase, increasing the column internal diameter, lowering the injected amount of the overloaded component(s), or increasing the column temperature or a combination of these factors. Any of these practical steps can be taken to correct the problem.
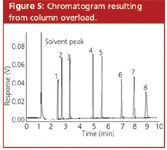
Figure 5
Column Bleed
Much has been written previously about stationary phase bleed or "column bleed".4,5 In most situations, measurable "bleed" signal at the detector is simply column phase material that has broken loose and is being detected as any sample component might be. A typical column bleed profile is depicted in Figure 6.
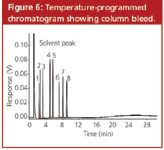
Figure 6
How can we address the problem of column bleed? Recognize first that all columns bleed to some degree and you are on your way to understanding the problem. Bleed is comparable having the outermost layers of your skin slough away as your cells naturally age and die. Aging occurs at different rates in people; some, because of living in intense sunshine, might be said to "accelerate" the aging process. When a properly bonded column is manufactured and tested, this loss of stationary phase is minimal. However, with time and heavy use the amount of stationary phase that sloughs out of the column increases, and an increasing bleed signal (baseline) is observed. What can be done about it? For a typical analysis conducted at temperatures below the column's maximum operating temperature, the amount of bleed might be barely above baseline and not interfere with your analysis. However, if high-temperature analysis is performed with very dilute samples where high sensitivity is needed, a high baseline rise might be a factor in accurate detection and quantification. At this point, bleed could be addressed by further column conditioning, usually accompanied by clipping one-half metre of heavily used column from the inlet end of the column. In this way, any nonvolatile residue retained at the inlet of the column, which could contribute to the bleed signal, will also be removed. Final conditioning should be done only after leak checking with an electronic leak detector and conditioning at 20 °C above the maximum analysis temperature, or at the column's maximum operating temperature, whichever is lower. Leaks in the GC flow stream can also allow oxygen into the carrier gas which is known to cause stationary phase degradation causing column bleed.4
Dead and Gone!
"When should I give up?" you might ask. That depends how effective you have been when attempting to correct the previously mentioned column efficiency, peak shape, or column bleed issues. Any one of these challenges could "sink your smooth sailing chromatography boat" because any of these, if not successfully met, could lead to inaccurate and unacceptable results for your laboratory or your customer.
There is an upside. Think of the education you and your staff have acquired while trying to identify and troubleshoot these problems. As you troubleshoot problems, isolate the potential causes, and then fix the problem, you have gained immeasurable skill in the science and practice of chromatography. Additionally, the training you have received has equipped you to accept the next challenge, to fix the next problem, bound to occur sometime down the line.
Conclusions
Finally, what essential things have been learned from these experiences? First, do not assume GC gases from the cylinder or central gas supply are as pure as is required for high-sensitivity capillary GC. Use moisture, oxygen and hydrocarbon traps to effectively and economically remove contaminants from carrier, make-up, fuel and oxidizer gas streams. Evaluate these traps often and replace as needed. Second, become fanatical regarding system leaks. An electronic leak detector is the best tool a gas chromatographer can have in the laboratory but make sure you use it correctly and effectively. Use it prestigiously in all installations and after all maintenance procedures. And, third, remember that it is usually not a unique list of samples or an aggressive solvent system that destroys a column. Rather, fused-silica capillary column longevity also stems from proper installation and maintenance resulting from following simple but effective installation procedures provided by column and instrument manufacturers. See John Hinshaw's "The Top Ten Habits of Successful Gas Chromatographers," which provides an excellent summary of such procedures.6 Table 3 is a listing of these 10 points.
Acknowledgments
The author would like to thank Jim Lambiase and John Lidgett for their help in editing and data collection for this article.
References
1. Steven Griffith, LCGC, 20(10), 928–938 (2002).
2. R.L. Grob and E.F. Barry, Modern Practice of Gas Chromatography, 4th ed. (Wiley-Interscience, New York, USA, 2004).
3. W. Jennings, E. Mittlefehldt and P. Stremple, Analytical Gas Chromatography, 2nd ed. (Academic Press, San Diego, California, USA, 1997).
4. E.J. Guthrie and J.J. Harland, LCGC, 13(6), 446–455 (1995).
5. N. Mosesman, Column Bleed and System Contamination, Restek Advantage, Spring 2001, p. 8.
6. J.V. Hinshaw, LCGC, 15(2), 114–122 (1997).
Rick Parmely is the director of technical training at Restek Corp., Bellefonte, Pennsylvania, USA. He travels domestically and internationally presenting seminars to teach and train Restek customers the fundamentals of gas chromatography. He has also taught college level chemistry.
"Column Watch" editor Ronald E. Majors is Business Development Manager, Consumables and Accessories Business Unit, Agilent Technologies, Wilmington, Delaware, USA and is a member of the Editorial Advisory Board of LCGC Europe. Direct correspondence about this column to LCGC Europe, Advanstar House, Park West, Sealand Road, Chester CH1 4RN, UK, e-mail: dhills@advanstar.com
New Study Reviews Chromatography Methods for Flavonoid Analysis
April 21st 2025Flavonoids are widely used metabolites that carry out various functions in different industries, such as food and cosmetics. Detecting, separating, and quantifying them in fruit species can be a complicated process.
University of Rouen-Normandy Scientists Explore Eco-Friendly Sampling Approach for GC-HRMS
April 17th 2025Root exudates—substances secreted by living plant roots—are challenging to sample, as they are typically extracted using artificial devices and can vary widely in both quantity and composition across plant species.


