Single Calibrant Quantification with HPLC — Fact or Fantasy?
LCGC Europe
This article assesses the extent to which some familiar HPLC detectors can provide reliable quantitative analytical measurements when no suitable primary reference standard exists. The advantages and limitations of two candidate detector schemes are discussed ? evaporative light-scattering detection (ELSD) and chemiluminescent nitrogen detection (CLND). It was found that when the ERETIC (Electronic REference To access In-vivo Concentrations) method in proton NMR was used as a "gold standard" reference procedure the ability of CLND to provide reliable single calibrant quantification is superior to ELSD. Furthermore, ELSD showed bias towards underestimation of chromatographically-resolved impurities, resulting in an overestimation of analyte purity.
Wherever analytical chemistry is performed, qualitative and quantitative questions are asked: "What is this material?", "What are the impurities?", "How much is present?", "How pure is it?" etc. In the pharmaceutical industry, for example, a formidable arsenal of spectroscopic tools is available to confirm identity. During drug development high-quality samples of candidate drugs and potential impurities become available for use as reference standards for accurate quantification. But what happens at the time of initial drug discovery?
When a compound is made for the first time, by definition no reference is available and unknown levels of non-chromophoric impurities (such as water, solvents, vacuum grease, silica, salts, catalysts etc.) may be present. Additionally, there may be synthetic impurities with unknown structures, chromophores and extinction coefficients. In these circumstances it is difficult to provide accurate and precise quantitative information to establish high quality, Structure–Activity Relationships for feedback into synthesis design.
In principle, each New Chemical Entity (NCE) could be carefully purified and dried to constant weight but this is impractical when combinatorial chemistry annually produces hundreds of thousands of NCEs in sub-milligram amounts in microtitre plate (MTP) format. Instead, chromatographic clean-up is commonplace, and so what is required is a "universally quantitative" detection procedure for analytical and small-scale preparative HPLC to enable accurate quantification of crude and purified samples.
What might be the characteristics of such an idealized detector? The area response A obtained within the working range of a chromatographic detector can normally be related to the analyte mass M by an empirical relationship of the form

where "a" is the response factor and "b" is the coefficient of regression of the response curve. A detector can, therefore, be said to be universally quantitative only if each compound exhibits the same value for "a" and another universal value for "b". Although no detector possesses this idealized response profile, many (e.g., ultraviolet (UV), mass spectrometry (MS), chemiluminescent nitrogen detection (CLND) have "b"=1.00 and thus exhibit the familiar linear response, albeit frequently with huge differences in response factors. Element-specific detectors that "count atoms" promise consistent response but have atom-dependent application ranges.
NMR and CLND have excellent potential as "universal" quantitative HPLC detectors insofar as linear response is proportional to levels of common elements H and N. Indeed, since its first use with HPLC in 1992,1 CLND has been further developed2 and its use3,4 in combinatorial chemistry has been reviewed.5 Quantification by "proton counting" with NMR is another attractive option. The electronic reference to access in-vivo concentrations (ERETIC) method in NMR was introduced in 1997 by Akoka et al.6 as a way of determining absolute concentrations. An artificial radio frequency reference (ERETIC) signal produced with rigorously controlled parameters is added to the observed NMR sample spectrum. This eliminates handling and contamination issues associated with internal standards, allowing quantification of protons with respect to the ERETIC signal.
For detectors where "b" is non-unity (e.g., ELSD), response may be linearized by taking logs:

Introduced in 1966 by Ford and Kennard,7 ELSD is an excellent quantitative detector when calibrated in an analyte-specific manner. It has been extensively used to quantify libraries, where its response may be more uniform than that of UV. Kibbey showed that careful choice of standards could limit errors to 10–20% for limited sample sets.8 However, larger errors occurred where standards were less representative,9 and reduced ELSD response may be obtained from low-molecular-weight compounds.10,11 Library compounds have a range of response coefficients reflecting the chemical diversity present, giving rise to quantitative errors whichever compound is chosen as calibrant. We will show how such errors may be propagated.
Yurek et al.3 demonstrated that with sets of limited diversity it is possible to obtain reasonable agreement between the performances of CLND and ELSD. Similarly, both techniques were used to quantify compounds possessing poor UV chromophores.4 Our experiments are an attempt to answer the following questions: What variability in response parameters can we expect from ELSD and CLND? What are the implications for single calibrant quantitative work? What detection strategy should we employ when quantification must be performed without a suitable reference standard?
Theory
Consider compounds 1 and 2 in a binary mixture, when Equation 2 may be restated as


In an ideal situation the two compounds exhibit the same values for "a'' and for "b". Equation 5 becomes

"Area Percent" (setting A2+A1=100) is commonly used to characterize purity. But we define M2+M1=100, when Equation 8 shows that areas returned by ELSD vary as a function of "b":


This is illustrated in Figure 1, which shows that impurity underestimation increases with "b". Note that for "linear" detectors such as UV, CLND and MS, b=1.0 and for ELSD in the idealized case of pure Mie scattering b=1.33.12 An impurity present at 10% m/m would appear to be present at only 5% in ELSD, even in ideal circumstances. This suppression effect produces greater relative error as the true amount of impurity diminishes; impurities present at 1% m/m will only contribute 0.2% of total area. Compounds, therefore, appear to be of inflated purity if assessed by un-calibrated Area% HPLC–ELSD. The situation is exacerbated when unknown levels of unidentified impurities are present. ELSD nebulization produces a variety of particle morphologies and scattering mechanisms, so in general a1 a2 and b1 b2. Variations amongst the values of "a" and "b" can be significant, even for closely related compounds. Fang et al. obtained calibration curves from six compounds from within a library, finding log a values between 2.02 and 2.18.9 This apparently small difference represents a 45% difference in response factor "a".

Figure 1
In the general situation where a1 a2 and b1 b2, Equation (5) has no unique solution for M1 and M2 for any given set of values for A1, A2, a1, a2, b1 and b2. Unlike "linear" detectors where b1 = b2 = 1.00, the area ratio A2/A1 in ELSD depends not only on the ratio M2/M1 but also upon the absolute values of M2 and M1. Consequently ELSD area ratios are predicted to change with injection volume.
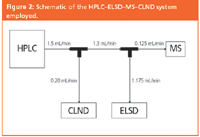
Figure 2
Experimental
Flow injection analysis (FIA) and HPLC were performed at 40 °C. Antek Model 8060-C CLNDs and Polymer Labs Models 1000 and 2100 ELSDs were used.
Acidified (0.05% formic acid) mixtures of water and methanol (CLND) or MeCN (ELSD) were used as matrix solvent (FIA) or mobile phase (HPLC). A short length of 0.005" i.d. PEEK tubing replaced the HPLC column for FIA. Detectors under test were serially connected to the DAD exit. Calibration solutions were accurately prepared for each compound in suitable detector-transparent solvents. ELSD calibration curves were established for each compound at each of 11 different FIA solvent conditions (%MeCN=0, 10, 20, ......, 100).
"Blind" quantification comparisons were performed for 20 compounds of high purity. Each was prepared accurately in DMSO-d6 at two randomly selected concentrations in the range 1–20 mM. Solutions were randomly coded and divided into two aliquots for independent quantification by NMR and HPLC–ELSD–MS–CLND (Figure 2; the MS used for sample identification was a Micromass LCZ). A 20×2.0 mm 3 μm Luna C18 cartridge was eluted with 0 to 100% methanol gradients (5.0 min). 0.1% formic acid was present. 5-fluorocytosine (5-FC) was calibrant for ELSD and CLND. Aliquots of 5 mM calibration standards of 5-FC in DMSO-d6 were injected at approx 0.93 minute intervals (autosampler cycle time) throughout a gradient, repeating at 10, 15, 20, 25 and 30 mM.
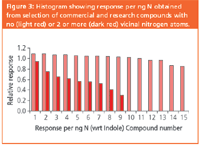
Figure 3
Proton NMR spectra were acquired at 14.1 Tesla with a 30° observation pulse on one channel and the ERETIC signal (set at -1 ppm) on the second channel. Pulse repetition rate was 5.7 secs and 64 transients/sample were acquired to build up signal/noise. The resultant free induction decay was automatically Fourier transformed with 1 Hz exponential line broadening apodisation, phased, baseline corrected and all detected signals integrated relative to the constant ERETIC signal which had been calibrated with standards of accurately known concentrations. The reference ERETIC integral was set to the calibrated value and solute concentrations were obtained by integrating identified proton signal(s).
Regression analysis used Microsoft Excel 2002 and residuals analysis and Bartlett tests used Minitab Release 13.20 (Minitab Inc., Pennsylvania, USA).
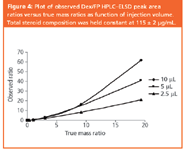
Figure 4
Results and Discussion
FIA–CLND gave constant response per unit mass of N over a wide linear range for various samples unless adjacent nitrogen atoms were present (Figure 3). Response was largely independent of methanol concentration and flow-rate in the range 0.1–0.3 mL/min.
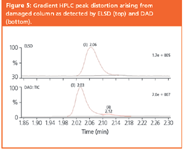
Figure 5
Before considering FIA–ESD response factors, the suppressive effects predicted by ELSD theory are illustrated. We prepared accurately known mixtures of the steroids fluticasone propionate (FP) and dexamethasone (Dex), which have similar chromophores and ELSD response coefficients. HPLC analysis (Figure 4) confirms underestimation of the minor component by ELSD and that this error is a function of the amount injected, exactly as predicted by theory. The errors are not trivial: a 90:10 (m/m) FP/Dex mix showed only about 2% Dex on an uncorrected Area% basis, while uncorrected UV ratios were generally within 25% of the true mass ratios. The danger of using uncorrected Area% with ELSD is also seen in Figure 5 where the lower trace shows an apparent UV impurity that is barely visible by ELSD. However, this "peak" is not an impurity, but a distortion caused by an imperfection at the column inlet. The relative size of the minor "peak" is clearly suppressed in ELSD.

Figure 6
The ELSD response coefficients of several compounds were studied by FIA. Included were a number of steroids of similar structure and molecular weight that were expected to have similar response functions. Figure 6 illustrates the set of 11 Dex calibration curves. Response increases with increasing organic percentage due to an increase of log "a" with acetonitrile concentration (Figure 7) which is to some extent offset by a corresponding decrease in "b" (data not shown). This behaviour contrasts with that seen with methanol/water mixes with HPLC–CLND–ELSD, where opposite trends occurred (Figure 8). Figure 7 emphasises the diversity of response factors displayed by different compounds. Given the severity of errors arising when relative areas are used to analyse similar compounds such as FP and Dex, this diversity will limit the use of ELSD for single calibrant work.
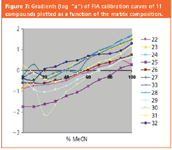
Figure 7
In order to assess the effect of these observations upon our working practices, we performed an exercise in which we used both HPLC–ELSD and HPLC–CLND in "blind" quantification comparisons to quantify coded samples of known concentrations. 5-FC13 was chosen as the primary reference standard for this exercise because it contains nitrogen, is reasonably involatile, and is essentially non-retained in RP-HPLC. It can, therefore, be detected throughout the gradient by both CLND and ELSD (to which DMSO is transparent). It elutes at regular intervals when a repeating cycle of injections is made throughout a linear RP-gradient (Figure 9). Note band dispersion in the CLND and changes in CLND and ELSD response observed post-split. The UV response of 5-FC remains essentially constant. Flow was split post-UV to CLND and ELSD, causing changes in response because of changes in split ratio during gradient delivery.

Figure 8
These changes are a function of tubing dimensions.14 Additionally, as known from the FIA experiments, the response of the ELSD varied with eluant composition. The experimental design enabled correction for both split and composition-induced variability by empirical description of the dependency of response factors on elapsed elution time. For example, Figure 8 shows that the value of log (response coefficient "a") of ELSD calibration curves (y) was linearly related to 5-FC elution times (x) by the equation y = – 0.2394x + 0.2466. Similarly a relationship was established between values of the intercept "b" of the same calibration curves and elution time. These relationships enabled calculation of ELSD response coefficients "a" and "b" at any desired elution time. In turn these were used to convert analyte peak area into amounts expressed as 5-FC. This represents amounts of analytes calculated on the common basis of possession of the same response coefficients as the single calibrant 5-FC would have at the retention time of the analyte. Similar corrections were made for CLND.
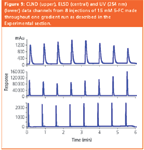
Figure 9
The same samples were independently quantified by ERETIC NMR (Figure 10). Only after calculation and decoding were the results compared. For each detector, true concentrations were linearly regressed against observed concentrations (Figure 11). Strong correlations were observed between true and observed data with NMR and CLND (r2 of 0.97 in both instances). ELSD results, however, were poorly correlated with NMR (r2 = 0.62). A histogram of the absolute error (difference between the true and observed concentrations) is shown adjacent to each linear regression model in Figure 11. The NMR and CLND histograms are similar — errors are normally distributed around target concentrations with ± 2mM at 95% CL. The distribution of ELSD errors is much more variable ( ± 6mM at 95% CL), less accurate (mean absolute error = –3.4 mM) and skewed towards underestimation. A three-group Bartlett test for equal variance determined the variance of ELSD data to be higher than that of NMR and CLND with a certainty of > 99%. Further statistical analysis indicated that ELSD residuals (i.e., underestimations) were associated with molecules of decreased size and increased volatility. This is to be expected, as ELSD is normally used for "involatile" compounds. Even so, the mean absolute error of compounds with boiling points > 490 °C remained poor at -2.8 mM.
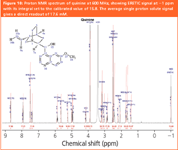
Figure 10
In another exercise, 479 samples representing widely varying structural types were identified and quantified by HPLC–CLND–MS and NMR. The synthetic analytes used were "real life" samples and not of uniform high purity. Some analytes had adjacent nitrogens and reduced CLND response was expected. Thus the degree of correlation (r2 = 0.69) between the two methods is reasonable. A final study determined 117 samples of low chemical diversity (all nominally 10 mM in DMSO in MTP format) in "blind" fashion by HPLC–ELSD and HPLC–CLND–MS, and results compared (Figure 12) with those obtained by the NMR reference method. CLND clearly outperforms ELSD.

Figure 11
These findings are consistent with those of recent work introducing calibration with 5-FC. Mathews et al. used single-calibrant ELSD, obtaining reasonable estimates of known analyte concentrations.13 However, several significant differences (> 20%) occur with smaller, more volatile analytes and the variability of ELSD response was noted. The data reported here suggests that CLND response is much less dependent on analyte physicochemical properties such as volatility, confirming its viability for HPLC quantification. We believe it to be a better choice of detector than ELSD for single-calibrant work with most nitrogen-containing analytes.
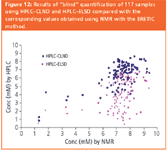
Figure 12
We now use HPLC–CLND–MS with minimal downtime in high-throughput environments to support synthetic and screening programmes.15 However, it is not an ideal tool for widespread use, being significantly more complex, expensive and resource-dependant than traditional detectors. Nussbaum et al. have shown that CLND may be used to determine relative UV response factors.16 We now use it as a standard calibrant technique against which subsequent UV quantifications can be compared. CLND-based calibration of UV detectors is an attractive possibility for HPLC quantification.
Conclusion
We have confirmed theoretical predictions that uncorrected relative area measurements in ELSD will underestimate minor components as a direct consequence of the non-linear nature of response. Accurate quantitative work with ELSD, even on a relative area basis, requires analyte-specific calibration. In contrast, CLND is a good candidate for single-calibrant quantification of nitrogenous analytes that do not contain adjacent nitrogen atoms.
HPLC–ELSD proved significantly less able than HPLC–CLND to provide reliable quantitative data in single-calibrant protocols. Despite rigorous correction for matrix effects and the logarithmic nature of ELSD response, accurate results were not obtained. Response factors are too diverse for this to be feasible. High accuracy and precision was obtained with the ERETIC method in NMR and with HPLC-CLND, validating the use of the latter in high-throughput research applications.
No detection scheme permits truly universal quantitative detection; development of novel detection strategies should be encouraged.
Acknowledgements
We thank Richard Upton for providing Figure 5.
Dr Steve Lane is director of analytical sciences UK at GSK. He obtained his PhD under professor Dai Games at the University of Swansea.
Bob Boughtflower obtained his PhD from Edinburgh University, where he worked on CEC with professor John Knox. Bob is currently analytical and chiral technologies section leader.
Ian Mutton has a chemistry degree from Bristol University and is an investigator within analytical sciences at GSK.
Clare Paterson graduated from Manchester University in 1995 and went on to do a Glaxo sponsored PhD at the Metropolitan University. Clare has worked for GSK for 7 years as research scientist in the analytical and chiral technologies group.
Duncan Farrant obtained a PhD in Medicinal Chemistry from the University of Hatfield. He is an NMR spectroscopist with over 21 years of experience in the pharmaceutical industry and prior to that 7 years of NMR in academia.
Nick Taylor obtained his degree in Applied Chemistry at Hatfield Polytechnic. In 1990 he moved to GSK where he has held or set-up the following positions: Mass spectrometry support service for natural products, the setting up of the QC centre for screening the sample quality of high throughput screening collection and open access LC–MS operations manager for discovery research.
Zoe Blaxill is a team leader in the European QC centre of analytical sciences at GSK. She obtained a 1st class honours degree from the University of Northumbria in 1993 and an MSc with Distinction from Birkbeck College London in 1998.
Carol Carmody obtained her chemistry degree from the National University of Ireland, Galway in 2000. She obtained her PhD from the University of Southampton in 2004. She is currently working in chemical development for GSK specializing in mass spectrometry.
Phil Borman attained a first class honours MChem in Analytical Chemistry from UMIST. He has worked for GW and GSK for over 8 years where he has become an expert in applying statistics and chemometrics within analytical and synthetic chemistry.
References
1. E.M. Fujinari and L.O. Courthaudon, J. Chromatogr. A, 592, 209–214 (1992).
2. K. Lewis, D. Phelps, and A. Sefler, Am. Chem. Rev., 3, 63–68 (2000).
3. D.A. Yurek, D.L. Branch, and M.-S. Kuo, J. Comb. Chem., 4, 138–148 (2002).
4. M.C. Allgeier, M.A. Nussbaum, and D.A. Risley, LCGC N. Am., 21, 376, 378–381 (2003).
5. M. Bronstrup, Top. Curr. Chem., 225, 283–302 (2003).
6. L. Barantin, A. Le Pape, and S. Akoka, Magnetic Res. in Medicine, 38, 179–182 (1997).
7. D.L. Ford, and W.J. Kennard, Oil Colour Chem. Assoc., 49, 299–313 (1966).
8. C.E. Kibbey, Mol. Diversity, 1, 247–258 (1996).
9. L. Fang et al., J. Comb. Chem., 2, 254–257 (2000).
10. B.H. Hsu et al., J. Chromatogr. B, 725, 103–112 (1999).
11. L. Fang, J. Pan, and B. Yan, Biotechnol. and Bioeng., 71, 162–171 (2001).
12. V.L. Cebolla et al., J. Chromatogr. Sci., 35, 141–150 (1997).
13. B.T. Mathews et al., Chromatographia, 60, 625–633 (2004).
14. D. Corens et al., J. Chromatogr ., A 1056, 67–75 (2004).
15. S. Lane et al., Anal. Chem., 77, 4354–4365 (2005).
16. M.A. Nussbaum, S.W. Baertschi, and P.J. Jansen, J. Pharm. and Biomed. Anal., 27, 983–993 (2002).
New Study Reviews Chromatography Methods for Flavonoid Analysis
April 21st 2025Flavonoids are widely used metabolites that carry out various functions in different industries, such as food and cosmetics. Detecting, separating, and quantifying them in fruit species can be a complicated process.

