Strategies to Improve Recoveries of Proteins and Peptides from Sample Containers Before LC–MS Analyses
This article describes how to prevent the loss of sample analytes by understanding the factors responsible for poor recoveries.
This article describes how to prevent the loss of sample analytes by understanding the factors responsible for poor recoveries.
Successfully quantitating proteins and peptides with liquid chromatography–mass spectrometry (LC–MS) is often more challenging than a similar task for small molecules. Their large and complex structure not only requires a different approach to LC–MS method development, but may also cause other unique problems such as nonspecific adsorption (or nonspecific binding) (1). Proteins and peptides in solution tend to stick to the surfaces they encounter, such as the LC–MS fluidic path, LC column packings, and even sample containers (2,3). Such losses do not just negatively impact the assay sensitivity, but also compromise the reproducibility, precision, and accuracy of the analysis.
Small molecules may stick to these surfaces as well, but their surface adhesion is typically driven by a single attraction mechanism and can be dealt with in a straightforward manner. For example, one can choose a polymeric container for a highly basic analyte, instead of a glass container that bears acidic silanol groups on the surface. For proteins and peptides, however, the picture is more complicated. They may form multiple interactions with exposed surfaces through various chemical attraction mechanisms. The more proteins or peptides the sample contains, the bigger the challenge is. It is therefore not trivial to find a single sample storage condition that prevents the loss of all proteins or peptides of interest.
A widely used alternative approach to avoid these losses is to add blocking agents, such as surfactants or carrier proteins (4,5), to the sample, or preconditioning the surfaces (2). Preconditioning is an extra step that often produces irreproducible results. Although highly effective in general, adding blocking agents to the sample creates more complexity in downstream LC–MS analyses by presenting extra peaks in chromatograms or MS spectra or by inducing ion suppression or enhancement. Therefore, using blocking agents is not always the best tactic unless it is absolutely necessary. This article will review the experimental parameters that affect peptide recovery the most and offer advice for maximizing recovery without using blocking agents.
Methods
Peptide solution standards in the concentration range of 20 pg/mL to 100 ng/mL were prepared in various sample matrices and stored in several commercially available sample containers prior to LC–MS analysis. To accurately determine the recovery of challenging peptides, solutions containing carrier proteins were used as recovery reference solutions: the solutions were prepared in groups, with and without 0.1% rat plasma, and the peptide recovery was calculated by comparing the peptide peak area from the solution that did not contain the blocking agent to the reference peak area. Peptides in each sample were separated using a 2.1 × 50 mm, 1.6-µm charged surface solid core C18 column (Waters) on a low dispersion LC system (Acquity I-Class System, Waters) with a water–acetonitrile linear gradient, each with 0.1% formic acid, and detected using a tandem quadrupole MS (Xevo TQ-S, Waters) in the selective reaction monitoring (SRM) mode. To understand the role of the container’s surface properties on peptide recovery, polypropylene vials and 96-well plates, QuanRecovery polypropylene vials and plates (all Waters), and commercially available plates designed for protein applications were evaluated. Other experimental conditions, such as the composition of the peptide sample and peptide concentration, were varied to clearly highlight how these experimental factors affected peptide recoveries.
Results and Discussion
Polypropylene sample containers are commonly used for various LC–MS applications because of their good chemical compatibility and a wide selection of shapes and sizes. Polypropylene 96-well plates have been particularly popular in highâthroughput applications with the availability of multichannel pipettes and robots. Another reason they are used frequently with protein or peptide samples is that they are less likely to induce analyte loss from ionic attractions than glass containers. Any analyte lost on the polypropylene containers, when it occurs, is likely a result of hydrophobic interactions.
The Influence of Materials of Construction on Peptide Recovery
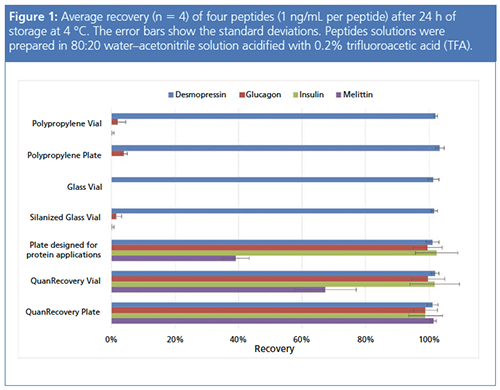
Figure 1 compares the recovery of four peptides that were prepared in a typical LC–MS diluent and stored in various sample containers. The recoveries of the peptides correlated well with their relative hydrophobicity. The least hydrophobic peptides produced the highest recovery values while the most hydrophobic peptides showed the lowest recovery values. All containers showed complete recovery of desmopressin, the least hydrophobic peptide (MW 1069, HPLC index [6] 16.8). Polypropylene containers, glass, and deactivated (silanized) glass showed little or no recovery for three hydrophobic peptides: glucagon (MW 3482, HPLC index 86), bovine insulin (MW 5734, HPLC index >120), and melittin (MW 2846, HPLC index 124.4). Of the three peptides, melittin showed the most drastic recovery difference among the tested containers. A commercially available plate for protein applications showed higher recovery than the polypropylene and glass surfaces, but with some mixed results. From the results shown, the loss of peptides in the polypropylene containers depended on their relative hydrophobicity. Next, how much recovery is influenced by the elution strength of the sample matrix was examined.
The Effect of Sample Solvent on Recovery
Figure 2(a) shows the recovery of teriparatide, another hydrophobic peptide (MW 4118, HPLC index 90.4), in sample matrices with varied acetonitrile content. In general, recoveries improved as the sample matrix contained more acetonitrile, while the minimum acetonitrile concentration that led to full recovery was not the same for different sample containers. Using a highly organic sample matrix appeared to be the easiest and most effective way to completely recover hydrophobic peptides. Teriparatide solutions prepared with 30% or more acetonitrile could be stored in any of the three containers without the risk of analyte loss. While quite effective, this approach doesn’t always work. For LC–MS, analytes in samples prepared in highly organic injection solutions may not retain well on the chromatographic column.
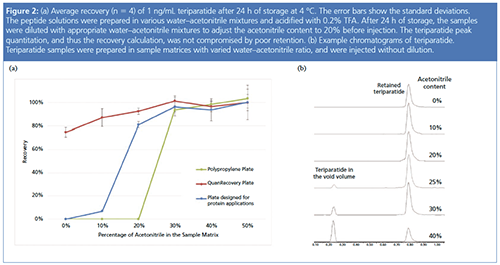
Figure 2(b) shows the disrupted retention of teriparatide as the acetonitrile concentration in the sample matrix was increased. When the acetonitrile percentage in the sample matrix was equal to or greater than 25%, teriparatide breakthrough peaks were observed in the void volume. It was thus necessary to prepare teriparatide samples with less than 25% acetonitrile to achieve good chromatography. However, limiting the concentration of acetonitrile to less than 25% with the polypropylene plate or the plate designed for protein applications causes the teriparatide to be lost on the container surface (Figure 2[a]). The same sample can be stored in a plate with a proprietary surface designed for minimizing hydrophobic nonspecific adsorption without the risk of analyte loss.
How Acidic Additives Affect Peptide Recovery
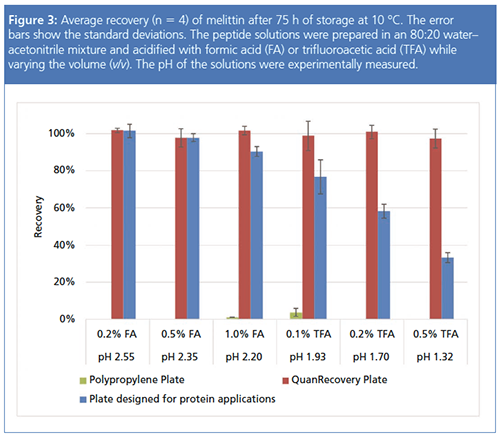
The choice of the acidic additive in the sample matrix also affects the peptide recovery. Figure 3 shows the recovery of melittin after 75 hours of storage. Using a weak acid such as formic acid at a low concentration helped increase the melittin recovery, but the increase was not as drastic as changing the acetonitrile concentration in the sample matrix. Melittin was never recovered from the polypropylene plate by changing the additive only, whereas it was completely recovered from plates with proprietary surfaces designed for minimizing hydrophobic nonspecific adsorption regardless of the additive type and concentration. When using a plate that may have an intermediate surface binding activity, it is advised to monitor the recovery using various additives in different concentrations during method development, as highlighted by the recovery changes shown in Figure 3. It should also be noted that the choice of the acidic additives has an influence on the peak shape in the downstream LC–MS analyses (7), although the effect was not as drastic as the additives in the mobile phase. Formic acid in the sample, being a volatile additive, gave a stronger MS signal, but led to poor chromatographic peak shapes compared to trifluoroacetic acid.
The Influence of Sample Volume, Amount of Time in Storage, and Peptide Concentration on Peptide Recovery
To complicate matters further, factors such as sample volume and storage time also influence the peptide recovery. In general, the smaller the sample volume and the longer the sample was stored in the container, the poorer the recovery (data not shown). In practice, however, these factors may be difficult to control. For example, the length of time a sample spends in storage is often dictated by instrument availability, the number of samples in the queue, and the LC–MS run time. On the other hand, sample volume is limited by sample availability and the sample prep protocol. Therefore, it is advised that these factors should be used only as guidelines during method development, but not as the experimental parameters to increase peptide recovery.
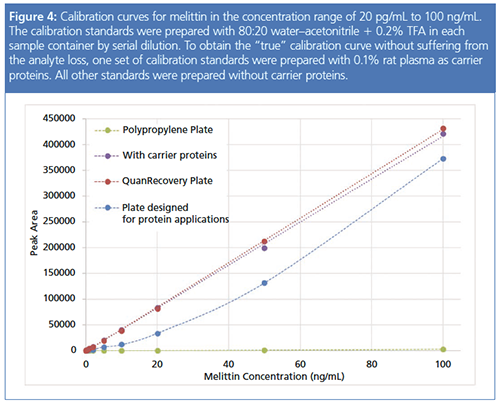
Peptide concentration is another variable that affects recovery but cannot be independently controlled. It is particularly problematic when constructing a calibration curve. Figure 4 shows the calibration curves for melittin using various sample containers. To illustrate the ideal calibration curve that was not affected by the peptide loss, one sample set was prepared with 0.1% rat plasma as carrier proteins. Peptide loss may be easily identified from the shape of the calibration curve. Linear calibration curves were obtained when no peptide loss occurred on the sample container. However, in some cases, the peptide loss was so severe that the calibration curve could not be constructed at all. Even when peptide loss was not so severe, it was impossible to construct a calibration curve: the trace formed a concave curve of which the curvature depended loosely on the severity of the peptide loss. This curve showed the nonlinear relationship between the peptide loss and the concentration and would not fit a linear model.
Conclusions
Analyte losses in sample containers is a significant problem in peptide quantitation and is often not recognized early enough. Failure to mitigate it can lead to hours of wasted time during method development, or even worse, to suboptimal methods that are limited by poor sensitivity and reproducibility. Peptide losses can be reduced by optimizing the sample matrix based on the chemical properties of the analyte of interest and the surface of the container. It was observed that the most effective way to reduce the loss of hydrophobic peptides was to change the organic solvent content of the sample. However, there were limits to this approach. When the organic solvent content was above a certain level, there was an increased risk of poor chromatography, while below a certain level there was an increased risk of low recovery. We found that the types and concentrations of the acidic additive in the sample matrix also influenced peptide recovery.
Using a container with a low surface binding property proved to be a useful complementary option. Unlike standard containers, the inert surface of low bind containers protects against peptide loss. The use of low bind containers and an LC–MS-friendly sample matrix greatly simplifies the process of selecting the optimal storage conditions without compromising peptide recovery.
References
- B. Bobaly, E. Sipko, and J. Fekete, J. Chromatogr. B Analyt. Technol. Biomed. Life Sci.1032, 3 (2016).
- K. Kristensen, J.R. Henriksen, and T.L. Andresen, PLoS One10, e0122419 (2015).
- M. Goebel-Stengel, A. Stengel, Y. Tache, and J.R. Reeve, Jr., Anal. Biochem.414, 38 (2011).
- K. Stejskal, D. Potesil, and Z. Zdrahal, J. Proteome Res.12, 3057 (2013).
- K. Maes, I. Smolders, Y. Michotte, and A. Van Eeckhaut, J. Chromatogr. A1358, 1 (2014).
- C.A. Browne, H.P.J. Bennett, and S. Solomon, Anal. Biochem.124, 201 (1982): cited HPLC index values were calculated using Waters BioLynx software.
- D.V. McCalley, J. Chromatogr. A1038, 77 (2004).
Moon Chul (Moon) Jung is Principal Scientist at Waters Corporation, Chemistry R&D. After receiving his Ph.D. in analytical chemistry from the University of Pittsburgh, Moon joined Waters to conduct various research and development projects including sample prep and handling devices, microfluidic columns, and novel separation media.
E-mail:moon_chul_jung@waters.com
Website:www.waters.com/quanrecovery

Investigating 3D-Printable Stationary Phases in Liquid Chromatography
May 7th 20253D printing technology has potential in chromatography, but a major challenge is developing materials with both high porosity and robust mechanical properties. Recently, scientists compared the separation performances of eight different 3D printable stationary phases.
Detecting Hyper-Fast Chromatographic Peaks Using Ion Mobility Spectrometry
May 6th 2025Ion mobility spectrometers can detect trace compounds quickly, though they can face various issues with detecting certain peaks. University of Hannover scientists created a new system for resolving hyper-fast gas chromatography (GC) peaks.
University of Oklahoma and UC Davis Researchers Probe Lipidomic Profiles with RP-LC–HRMS/MS
May 6th 2025A joint study between the University of Oklahoma Health Sciences Center (Oklahoma City, Oklahoma) and the UC Davis West Coast Metabolomics Center (Davis, California) identified differentially regulated lipids in type 2 diabetes (T2D) and obesity through the application of reversed-phase liquid chromatography-accurate mass tandem mass spectrometry (RP-LC-accurate MS/MS).

.png&w=3840&q=75)

.png&w=3840&q=75)


.png&w=3840&q=75)


.png&w=3840&q=75)


