Statistics for Analysts Who Hate Statistics, Part VIII: Decision Trees
LCGC North America
Decision trees offer great visuals to observe complex data sets and to classify data according to simple decision rules.
Decision trees, or classification trees, offer a simple visual representation to understand and interpret your data, or to build automated predictive models. The figure obtained has a tree-like shape, where each end branch contains one group (of samples, methods, or any objects to classify). Nodes usually represent data or simple "if-then-else" decision rules to classify one object into one group. The predicted variable (belonging to one class) may be defined by qualitative (categorical data) or quantitative (numerical data) attributes. Ideally, the tree should represent all data with the smallest number of nodes, but a data set containing high variability would necessitate many nodes. Decision trees are, again, an example of supervised methods, but with one significant advantage over other methods from previous chapters: little data preparation is required (usually no normalization is necessary).
Here are a few simple examples to understand the features of this straightforward method.
Decision Tree Example: Vacation Destination Choice
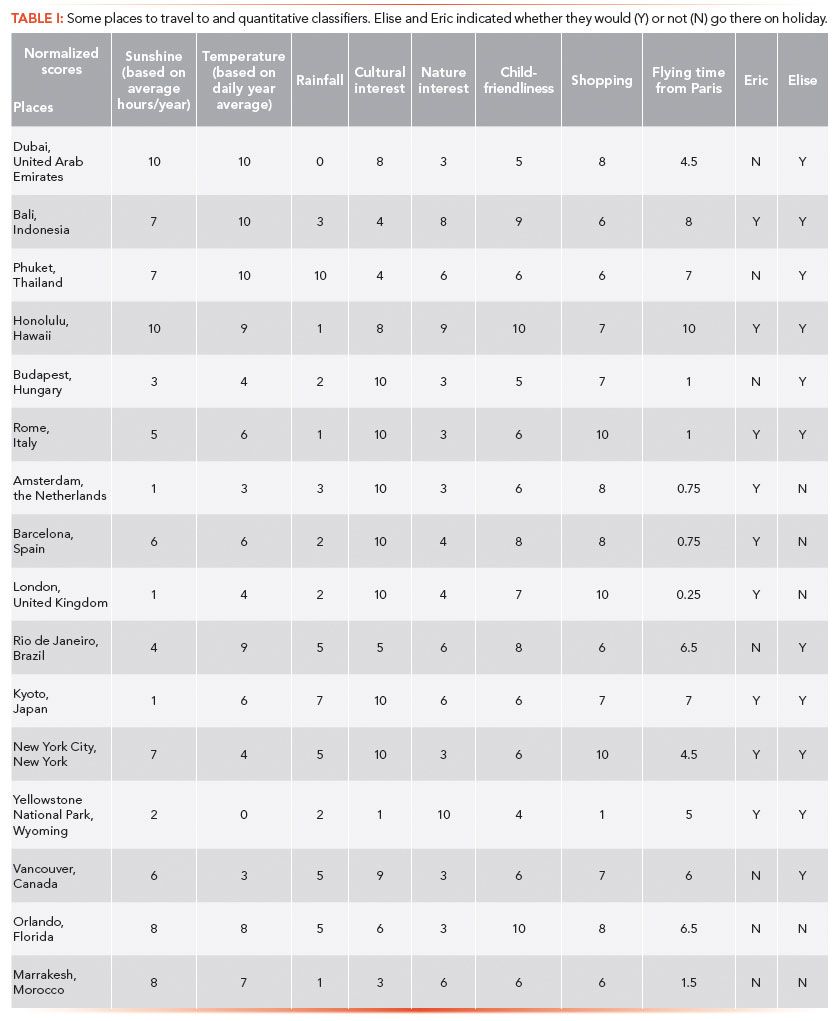
Imagine you are a Parisian planning your next vacation, and would like to go on a trip abroad. Destinations may be classified according to a number of criteria: for example, climate, cultural interest (museums and places of interest), possibility for outdoor activities, and traveling distance. To illustrate this example, we have selected some places where one may want to go on holiday, and have defined their characteristic features (Table I). Each criterion has scores from 0 to 10, based on climatic conditions (amount of sunshine, average ambient temperature, rainfall), places to visit, nature interest, child-friendliness, shopping opportunities, and travel distance from Paris, France. "Interest" criteria were defined according to rankings proposed by travel agency websites.

Then I asked two colleagues (called "candidates") if they would quite spontaneously want to go to one place or another. Using their "yes" or "no" answers as a qualitative dependent variable and the criteria selected as quantitative classifiers, decision trees were calculated. To some, the decision trees were too complicated and difficult to interpret (a typical case of overfitting where the data cannot be grouped into a small number of classes). One possible case of failure was that the decision criteria selected did not reflect the reasons why the candidate preferred to go to a certain destination. In other words, the variables chosen were not discriminating, they could not explain the candidate's choices. Another reason why the decision tree sometimes failed to procure adequate results is there were times when the candidate wanted to go everywhere. For example, those who really love to travel and want to discover the whole world gave too few negative answers. Thus, no negative criteria appeared to contribute to their decision process. A balanced dataset is necessary to obtain a meaningful decision tree.
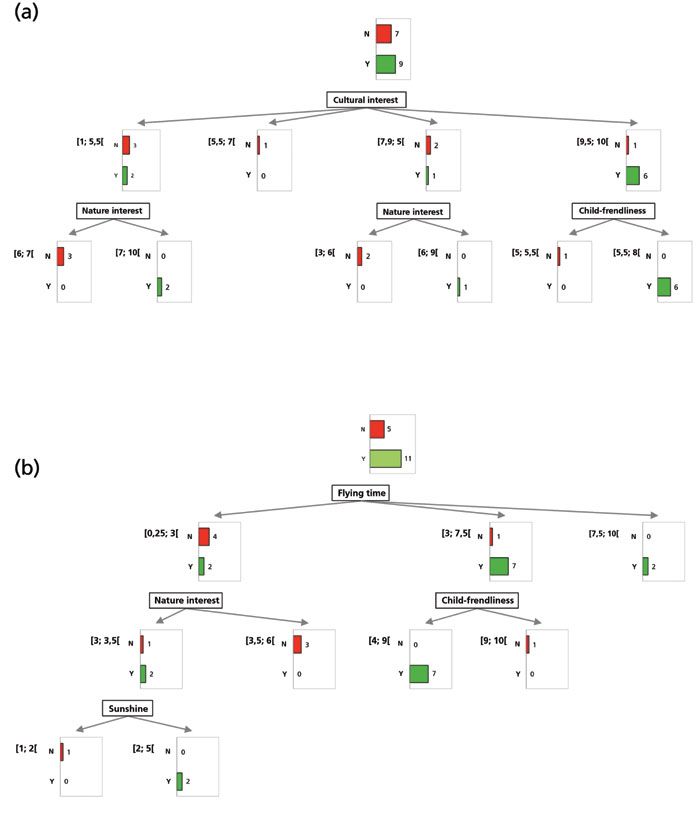
To some, however, the decision criteria were quite good, and procured easy-to-read decision trees. Two of them are presented in Figure 1. Eric's decision tree (Figure 1a) is quite straightforward; clearly, cultural interest is a strong decision criterion, as it appears as the first node, with most "yes" answers in the group of destinations with high cultural interest (scores in the range 9.5–10.0, on the right of the figure). For destinations with less cultural interest (on the left of the figure), he may still be interested, if there is a nature interest (second node at the bottom left and bottom middle).

Figure 1: Decision trees for travel destinations as (a) Eric and (b) Elise.
Elise had much different decision criteria (Figure 1b). First, she likes to travel to long-distance destinations, as the first node is "flying time", with most "yes" answers in the long distance groups (middle and right of the figure) and most "no" answers in the short distance group (left of the figure). When the distance is not long (left of the figure), she may still be interested in sunny places (bottom left), but cares little for nature or child-friendliness (middle nodes).
Decision Tree Example: Enantioselective Mechanisms
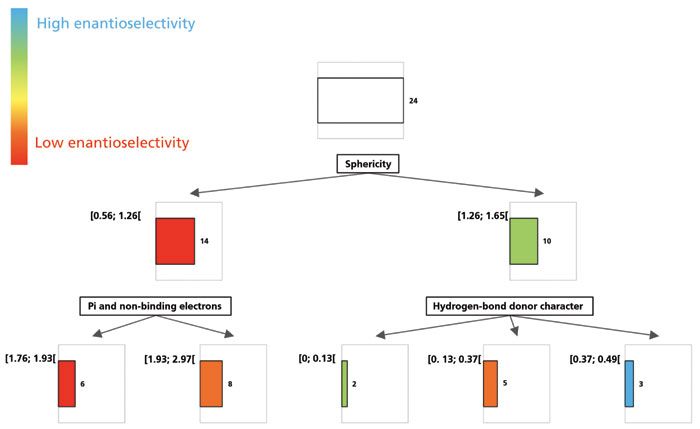
Let us now observe a similar strategy applied to chromatographic experiments, to unravel the enantioselective mechanisms contributing to successful chiral separations. Understanding the structural features that contribute to the enantiorecognition process is a difficult task. In a recent study (1), the enantioresolution of some chiral sulfoxide species on polysaccharide stationary phases were explored. Particularly good resolution on chlorinated polysaccharides was observed. It seemed that the general shape of the molecule was an indication of the resolution that could be achieved; indeed, compact or spherical shape (when the molecule was folded) yielded higher resolution values than linear shapes (when the molecule was preferentially in an extended conformation). To illustrate this example, the values of enantioselectivity measured for 24 chiral sulfoxides on one chiral stationary phase in one set of operating conditions were used as quantitative dependent variables. Molecular descriptors quantifying the structure attributes were computed and used as quantitative independent variables as classifiers for a decision tree. The result can be observed in Figure 2. The whole group of racemates is first divided according to their sphericity, with low-sphericity compounds on the left yielding low enantioselectivity (red color), and high-sphericity species on the right yielding generally higher enantioselectivity values. In the left group, higher enantioselectivity values were obtained for the analytes that possessed more pi and non-binding electrons (second node). In the right group, the capability for hydrogen bonding was a second classifier, although perhaps not as clearly discriminating. Clearly, additional data would be required to obtain a more reliable model that would be suitable for prediction, but still these observations are in accordance with the general observations on chromatographic results within this dataset.

Figure 2: Decision tree for enantiorecognition process on a given chiral stationary phase for a set of chiral sulfoxide compounds.
Another example of predictive classification trees to predict enantioseparation capability can be found in the works of Del Rio and Gasteiger (2).
Other examples of decision trees applied to the selection of orthogonal chromatographic systems (3), or to predict the sensory attributes of olive oil samples (4), may be found elsewhere. In the latter example, the decision tree was generated based on two previous multivariate analysis methods using soft independent modeling of class analogy (SIMCA), and a partial least square (PLS) regression technique, that served for both classification and quantitation purposes. This decision tree could then classify unknown olive oil samples according to their sensory attributes based on the volatile species identified with headspace–mass spectrometry.
Naturally, there is more to decision trees than is explained here. For predictive purposes, validation of the model with adequate statistics would be required. Also, constructing a multitude of decision trees is the basis of random forests methods of machine learning.
References
(1) C. West, M.-L. Konjaria, N. Shashviashvili, E. Lemasson, P. bonnet, R. Kakava, A. Volonterio, and B. Chankvetadze, J. Chromatogr. A1499, 174–182 (2017).
(2) A. Del Rio, and J. Gasteiger, J. Chromatogr. A 1185, 49–58 (2008).
(3) R. Put, E. Van Gyseghem, D. Coomans, and Y. Vander Heyden, J. Chromatogr. A 1096, 187–198 (2006).
(4) S. López-Feria, S. Cárdenas, J.A. García-Mesa, and M. Valcárcel, J. Chromatogr. A 1188, 308–313 (2008).
Caroline West is an Associate Professor of analytical chemistry at the University of Orleans. Her scientific interests lie in the fundamentals of chromatographic selectivity, both in the achiral and chiral modes, mainly in SFC but also in HPLC. In 2015, she received the LCGC award for "Emerging Leader in Chromatography". Direct correspondence to caroline.west@univ-orleans.fr.

Understanding FDA Recommendations for N-Nitrosamine Impurity Levels
April 17th 2025We spoke with Josh Hoerner, general manager of Purisys, which specializes in a small volume custom synthesis and specialized controlled substance manufacturing, to gain his perspective on FDA’s recommendations for acceptable intake limits for N-nitrosamine impurities.


