MALDI Guided SpatialOMx® Uncovers Proteomic Profiles in Tumor Subpopulations of Breast Cancer
The timsTOF fleX system bridges a current gap by providing MALDI Imaging and in-depth proteomics analysis in just one instrument. The instrument offers all benefits of a timsTOF Pro for time-efficient and sensitive proteomics, combined with a high-resolution MALDI source and stage. Using PASEF technology, it is possible to retrieve high protein ID rates with small sample amounts. Here we present the new SpatialOMx® workflow to identify distinct proteomic profiles for different tumor subpopulations in breast cancer as an example for this powerful approach.
Since tissue and disease are correlated, SpatialOMx provides the unique opportunity to combine regiospecific information from MALDI Imaging with deep proteomic coverage for biomarker discovery and molecular characterization. MALDI imaging has the advantage of providing spatial and molecular information that can be used to detect Region of Interests (ROIs) in tissue sections. As a discovery tool, MALDI Imaging lacks the possibility of in-depth molecular characterization of classical LC–MS/MS-based OMICs methods. Classical OMICs strategies, however, do not retain the spatial information.
Here we present SpatialOMx for microproteomic characterization of tumor subpopulations in breast cancer. In this efficient workflow, unsupervised segmentation of MALDI imaging data with SCiLS Lab is used to define ROIs. Image processing strategies provide boundary information of segments of tumor subpopulations for laser capture microdissection (LMD). Protein extraction and tryptic digestion of small microdissected material is followed by proteomic analysis on the timsTOF fleX using PASEF (Parallel Accumulation Serial Fragmentation). Analysis of proteomics data provides a comprehensive mechanistic understanding of cell type specific biological processes in situ to complement the workflow.
Methods
MALDI Imaging Analysis, Staining, and Clustering
Fresh breast cancer tissue was collected by the Tissue Biobank of the University of Liège, frozen in liquid nitrogen, and stored at -80 °C. The standardized protocol was approved by the Ethics Committee of the University Hospital Center of Liège. Informed consent was obtained from the participant included in this study.
Fresh and frozen breast tumor sections were cut at 12 μm thickness and mounted on PEN (polyethylene naphthalate) membrane slides (Leica Microsystems). These slides are compatible with MALDI imaging and with LMD. After drying, the slides were coated with norharmane matrix (7 mg/mL in CHCl3:MeOH, 2:1, v:v) using a TM-sprayer (HTX Technologies) for lipid analyses. 12 matrix layers were applied with a 30 s break between each layer at a flow rate of 0.120 mL/ min, a velocity of 1200 mm/min and a nozzle temperature of 30 °C. The slides were scanned with a slide scanner (TissueScout, Bruker) to obtain a grayscale reference image with teach marks. Lipid MALDI Imaging analysis was performed on a timsTOF fleX instrument over the entire section with 50 μm spatial resolution in the mass range 300–1600 m/z.
After MALDI imaging analysis, the matrix was removed, and the section was stained with hematoxylin and eosin, scanned with a digital slide scanner for pathological evaluation, and coregistered to the MALDI imaging data using the previously applied teach marks. MALDI imaging data were imported into SCiLS Lab 2019c. Spectra from the pathological annotation of the tumor region were analyzed by unsupervised clustering using the k-means algorithm to define three tumor subpopulation regions of interest (ROIs).
Image Processing of Cluster Results and LMD
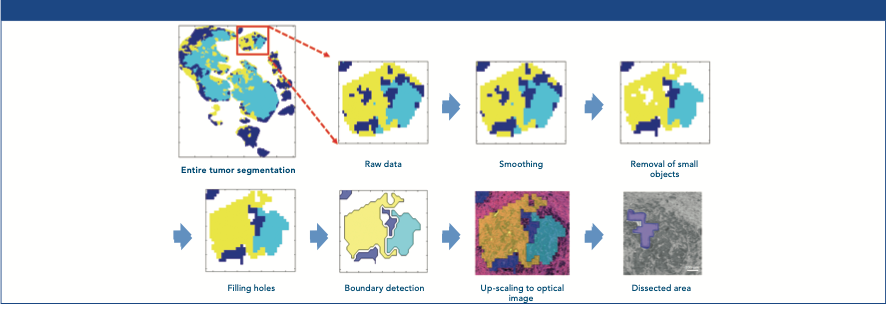
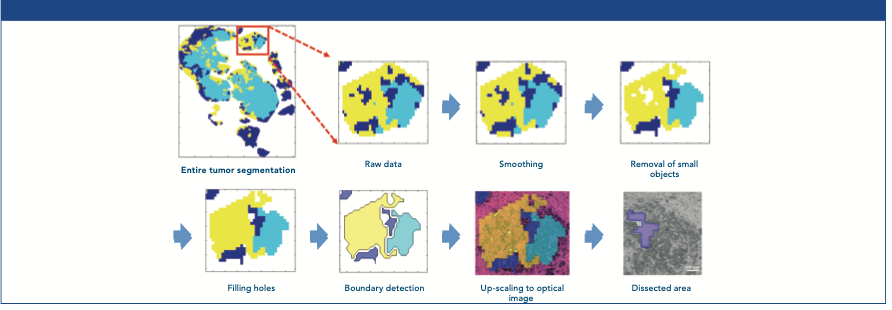
As segmentation by k-means provides fine structures that are not processable by LMD, the segmentation image data had to be smoothed. Therefore, segmentation data of the tumor subpopulation areas were imported to MatLab R2018a for smoothing, removing small objects, filling holes, and detect- ing boundaries. Hereafter, the different segmentation images were upscaled to the resolution of the optical image. This upscaled segmentation information was then transferred to a consecutive unstained and unmeasured section located on a separate PEN slide. This was achieved through the coregistration of both sections using prominent morphological features of the sample. The untouched section was also surrounded by teach marks which are visible in the LMD and can therefore function as reference points for the recalculation of the boundary coordinates to the coordinate system of the LMD. Areas containing approximately 2000 cells were dissected from each segmented tumor subpopulation with a Leica LMD7000 and directly transferred to reaction tubes for microextraction and tryptic digestion.
Sample Preparation for Proteomics
Samples for protein identification by PASEF on the timsTOF fleX were processed as described (2). Briefly, extraction solution was added, and samples were heated at 99 °C for 1 h. The pH was adjusted to 7.4, samples were reduced, alkylated, and digested overnight at 37 °C with trypsin. After digestion, samples were dried and desalted using ZipTip purification.
Proteomics Data Acquisition Using PASEF Technology on the TimsTOF fleX
Microextracted peptide samples were run on a Bruker nanoElute system using a one column setup equipped with an Aurora 25 cm × 75 μm 1.7 μm C18 column (IonOpticks, Parkville, Australia). 0.1% formic acid and 2% acetonitrile in water were used as eluent A while 0.1% formic acid in acetonitrile was used as eluent B with a 400 nL/min gradient at 50 °C oven temperature. The Bruker CaptiveSpray nano source was used as an inlet into the timsTOF fleX system using 3.0 L/min dry gas at 180 °C and 1.6 kV capillary voltage. Data were acquired in the mass range of 100–1700 m/z and the mobility range was set to 0.6–1.6 1/k0. For MS/MS fragment spectra acquisition, 10 PASEF scans at 100 ms were run, from which each contains around 12 MS/MS events resulting in a greater than 100 Hz acquisition rate.
Analysis of Proteomics Data
PEAKS X (Bioinformatics Solutions Inc, Waterloo, Canada) was used for protein identification. Database searches were carried out against a SwissProt human database using a parent mass error tolerance of 15 ppm and a fragment mass tolerance of 50 mDa. Trypsin was used as proteolytic enzyme and maximally two missed cleavages were allowed. Carbamidomethylation was set as fixed modification, acetylation at the protein N-terminus, deamination (NQ), and oxidation (M) were allowed as variable modifications. For biological process characterization of the different tumor subpopulations, the gene ontology tool PANTHER V.13.1 was used.
Results
MALDI Imaging Defines Tumor Subpopulation ROIs
Lipid imaging on the timsTOF fleX from tumor sections was used to define ROIs by segmenting intratumor heterogeneity for laser microdissection (LMD) based microproteomics. The workflow is supported by the compatibility of PEN (polyethylene naphthalate) membrane slides with MALDI Imaging on the timsTOF fleX. These slides also support histological staining and are compatible with LMD. Lipid MALDI Imaging has the advantage that the same tissue section can be used for imaging, staining and LMD based microproteomics. Moreover, discernible lipid profiles are the basis for segmenting intratumor heterogeneity.
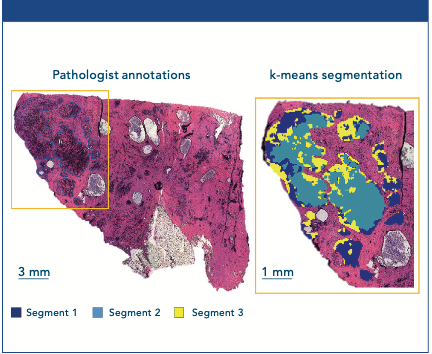
The breast tumor section was stained with hematoxylin and eosin (H&E) after MALDI Imaging data acquisition and tumor areas were annotated by a pathologist. MALDI Imaging data with 50 μm spatial resolution were imported into SCiLS Lab 2019c and the annotated tumor areas analyzed by unsupervised clustering using the SCiLS Lab segmentation algorithm. k-means segmentation highlighted three subpopulations in the annotated tumor region (Figure 1).
Figure 1: The left image shows the H&E stained section with the tumor area marked in blue by a pathologist. The right image is the tumor area zoomed in after segmentation analysis using k-means clustering, which produced three segments representing tumor subpopulations.
ROI Boundary Coordinates are the Basis for Precise LMD
Fine structure segmentation ROIs require image processing to allow viability of LMD. Currently, the segmentation image raw data contains small objects or edged segment boundaries that prevent direct usage of the coordinates for LMD. After image processing, boundaries of the tumor subpopulation areas were transferred to a coregistered optical image of a consecutive section and referenced to teach marks that were scanned together with the section (Figure 2). This allows co-registration of the MALDI Imaging segment boundaries to the LMD for precise excision of the defined areas.
Figure 2: Image processing pipeline to produce ROI boundary information as x,y-coordinates for laser capture microdissection from segmentation raw data. The workflow includes smoothing, removing of small objects, filling holes, detecting boundaries, and upscaling to the optical image.
Proteomics of Microextracted MALDI Imaging Segments by PASEF Technology Implemented in timsTOF fleX
The timsTOF fleX system supports PASEF (Parallel Accumulation Serial Fragmentation) technology for time efficient and sensitive X-omics analysis. PASEF takes advantage of the dual TIMS device which separates incoming ion packages from one scan according to their ion mobility and elutes these ions in a time focused manner. While ions from the continuous ESI process are separated and eluted in the second TIMS device, ions are accumulated in parallel in the first part of the dual TIMS cartridge allowing for a 100% duty cycle. Alternating precursor and fragment ion scans complete assignment of fragment ion spectra to their respective precursor spectra. PASEF allows for scan rates of more than 100 Hz without losing sensitivity or resolution and is the optimal system for small sample amounts and therefore for SpatialOMx.
Tryptic digests of the extracted proteins from the excised MALDI Imaging tumor subpopulation areas were run on the timsTOF fleX using 100 min gradients on a Bruker nanoElute LC. The excised ROIs consisted of approximately 2000 cells per sample. On average, about 3500 protein IDs were obtained from the three microextractions to provide a deep insight into the proteome from just 160 ng (estimated) of sample. The molecular properties of the different tumor subpopulations were characterized and represented as Venn diagrams (Figure 3).
Figure 3: Proteomics of tumor subpopulations and biological process characterization. Proteins from microdissected tissue (approx. 160 ng) were extracted, digested with trypsin and peptide extracts were run on the timsTOF fleX using PASEF. Number of protein IDs per tumor subpopulation segment (a) and biological process characterization per segment as revealed by PANTHER (b).

Interestingly, the proteomic profiles of the tumor subpopulation differed largely. The gene ontology terms “Biological regulation” and “Developmental processes” were underrepresented in subpopulations 1 and 2, respectively, while “cellular component organization” was over-represented in tumor subpopulation (3).
In summary, SpatialOMx provides guidance to specific regions of interest for microextraction and in-depth proteomics analysis to characterize regio-specific molecular changes in detail.
References
(1) F. Meier et al., J. Proteome Res. 14, 5378–5387 (2015).
(2) R. Longuespée et al., Methods 104, 154–162 (2016).
(3) Dewez F, et al., Anal. Bioanal. Chem. 411, 5647–5633 (2019).

Bruker Corporation
40 Manning Road, Billerica, MA 01821
tel. (978) 663-3660, fax (978) 667-5993
Website: www.bruker.com


.png&w=3840&q=75)

.png&w=3840&q=75)


.png&w=3840&q=75)


.png&w=3840&q=75)
