A Simple Instrumental Approach for "Supercritical" Fluid Chromatography in Drug Discovery and Its Consequences on Coupling with Mass Spectrometric and Light Scattering Detection
LCGC North America
A simple experimental setup applied in a drug discovery laboratory illustrates some anomalies and misconceptions about supercritical fluid chromatography for drug discovery.
In spite of the name supercritical fluid chromatography (SFC), SFC systems are generally operated in the subcritical state. When both the temperature and pressure are below the critical point of the CO2–modifier mixture, phase separation may occur, which is claimed to destroy the separation. We show here, however, that working below the critical temperature and pressure has no practical detrimental effect on the separation; its only detrimental effect is on detection by UV. This contribution describes a simple experimental setup applied in recent years in a drug discovery laboratory and illustrates some anomalies and misconceptions about SFC for drug discovery.
Supercritical fluid chromatography (SFC) has been around for more than 30 years and has had its share of successes and failures. Notwithstanding its many features, however, SFC has long been seen by many more as hype than as a practical separations method. There are many reasons that can explain why SFC could not deliver on the benefits promised a long time ago, and the instability in the SFC instrumentation market until 2009 undoubtedly is one of them. Fortunately, major instrument companies, including Agilent Technologies–Aurora, Waters–Thar, and JASCO, entered or re-entered the SFC market, and it is expected that instrument robustness, including installation qualification (IQ), operational qualification/performance verification (OQ/PV), and system suitability testing in SFC will soon be at the same level as for state-of-the-art gas chromatography (GC) and high performance liquid chromatography (HPLC). It is also worthwhile to mention that the complexity of the separation process in SFC has prevented many chromatographers from evaluating the technique for routine use. Small changes in settings such as temperature, pressure, and flow have an influence on the chromatographic separation. However, this flexibility makes the technique very versatile and tunable to a specific separation problem.
One of the success stories of SFC lies in the field of drug discovery. SFC has become the preferred analytical method for chiral separation because of its advantages over traditional HPLC in terms of speed, resolution, cost savings, and environmental friendliness. Moreover, scaling up analytical SFC to semipreparative and preparative dimensions is easy and an asset in drug discovery. SFC also is more and more frequently applied to achiral analysis in pharmaceutical laboratories because it offers unique selectivity that is complementary to reversed-phase and hydrophilic interaction liquid chromatography (HILIC). However, until 2009, analytical SFC instrumentation as used in drug discovery laboratories was not reliable enough to address the analytical challenges of drug development applications.
To address this problem, during the period from 2005 to 2009 we developed our own approach to SFC and presented some data (1). Following our 2010 publication and a tutorial on SFC presented at the HPLC 2011 conference in Budapest (2), we received several questions, comments, and remarks about our instrumental setup and its features. The aim of this contribution is to detail the experimental setup and its consequences for practical work; to offer chromatographers a simple solution to modify LC instrumentation to turn it into an SFC instrument; to illustrate some anomalies and misconceptions about SFC for drug discovery; and to contribute to the understanding of the mechanisms that occur, without going into fundamental considerations.
SFC for Pharmaceutical Analysis
It is well documented in the literature that supercritical fluid CO2, whatever its density, lacks solvating power for pharmaceutical compounds (3). Pure CO2 can be used to analyze only highly apolar solutes such as petroleum products. Methanol, ethanol, and acetonitrile are widely used as modifiers to improve the solvating power of the "supercritical" mobile phase. As a consequence, from the classical SFC gradient elution modes — pressure programming mode, negative temperature gradient mode, and modifier programming mode — only the latter should be applied to pharmaceutical analysis. In practical SFC, modifier concentrations at the end of a gradient analysis can be as high as 40–50%. Moreover, temperatures ranging from ambient to 40 °C are preferred to avoid thermal degradation. This means that we operate our SFC system in the subcritical state, at least when the outlet pressure is above the critical pressure! When both the temperature and pressure are below the critical point of the CO2–modifier mixture, phase separation might occur, which is claimed to destroy the separation (4). The minimum outlet pressure to avoid CO2–methanol demixing should be at least 80 bar (4). Contrary to this claim, however, we will show further that working below the critical temperature and pressure has no practical detrimental effect on the separation. Its only detrimental effect is on detection by UV! Consequently, denominations such as supercritical, subcritical, near-critical, and enhanced fluidity are highly questionable and, sensu stricto, interchangeable. We proposed using the abbreviation SFC to mean super fluid chromatography (2) but following the recommendations of Taylor (5) and of Guiochon and Tarafder (6), the term supercritical fluid chromatography can be maintained for a chromatographic separation in which CO2 is used as a mobile phase ingredient.
Concerning the stationary phase in SFC, the multimode characteristics of SFC have been discussed and illustrated in the literature (7,8). It is interesting to note that recent theoretical contributions are based on data obtained in the reversed-phase mode — that is, using pure CO2 on octadecyl silica columns (9–11). However, in drug discovery, only the normal-phase mechanism of SFC is of interest, and reversed-phase LC is preferred (and much more powerful) compared to reversed-phase SFC.
Instrument Setup
Figure 1 shows a schematic representation of the modular system we have developed for drug discovery studies. It consists of a CO2 delivery system that includes a mixer and two check valves (SFC 5000, Selerity Technologies, Salt Lake City, Utah).
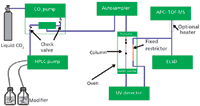
Figure 1
The pump is operated in the constant CO2 flow mode, although a negative flow gradient also can be applied. The pump can be combined with all conventional HPLC instrumentation, and the HPLC pump delivers the modifier and additives. For the applications shown in this article, an Agilent 1100 series pump and diode-array detector with high pressure cell were used (Agilent Technologies, Waldbronn, Germany). Injections were performed with an MPS-3 autosampler (Gerstel GmbH, Mülheim an der Ruhr, Germany). The column was installed in an oven equipped with a mobile-phase preheater and post-cooler (Polaratherm 9000, Selerity Technologies). A fixed restrictor, composed of 0.12-mm i.d. stainless steel tubing and 2–4 m in length (Agilent Technologies), was connected to the UV detector and redirected in the oven. All other connections for evaporative light-scattering detection (ELSD) and mass spectrometry (MS) detection were made of the same capillaries with minimal length. After the restrictor, the flow might be split using a zero-dead-volume T (VICI, Schenkon, Switzerland) for parallel MS (single quadrupole) and ELSD. This configuration is, however, less practical because for time-of-flight (TOF)-MS analysis, the ELSD and UV signals cannot be recorded because the samples have to be diluted at least 25 times to avoid overloading the ion source, resulting in poor peak shapes. A TOF-MS instrument from Agilent Technologies was used with the following settings: atmospheric-pressure chemical ionization (APCI) +, gas temperature, 350 °C; vaporizer temperature, 350 °C; drying gas, 5 L/min; nebulizer pressure, 60 psi; capillary voltage, 3000 V; corona current, 5 µA; fragmentor, 225 V; and skimmer, 60 V. A Varian 385-LC (Agilent Technologies) ELSD system was used with the following settings: nebulizer temperature 35 °C; evaporator temperature 35 °C; and nitrogen flow, 1.6 L/min.
Points of Discussion About the Experimental Setup
The most notable differences between the system described here and state-of-the-art SFC instrumentation are operation at constant CO2 flow with programmed modifier flow and the use of a fixed restrictor.
Fundamental studies performed in our laboratories have shown that there are no significant differences in terms of efficiency when we operate the system in total constant flow mode, or in constant CO2 flow and programmed modifier flow. The main reason is that van Deemter plots in SFC are relatively flat. Upon increasing the mobile-phase flow during the analysis, little effect on efficiency is noted. Controversial conclusions could be drawn from many van Deemter plots published in the literature. The shapes of the curves strongly depend on the instrumental setup, the conditions applied, and the mode of operation (normal phase or reversed phase). Typical plots of reduced plate height versus mobile-phase velocity or flow for a 25 cm × 4.6 mm, 5-µm dp silica column installed on the instrumental setup described above and operated in SFC and normal-phase LC mode are shown in Figure 2. The compound was hydrocortisone (κ > 3) and the void volume marker was acetone. The temperature for the HPLC system was 40 °C, and the mobile phase was 72:20:8 hexane–methanol–isopropanol. The temperature and mobile phase for SFC were 40 °C and 20% methanol in CO2, respectively. The outlet pressure was ~120 bar at 2 mL/min (2 m × 0.12 mm i.d. fixed restrictor) and obviously the outlet pressure (Po) changes with flow (high flow, high Po; low flow, low Po). The outlet pressure changes, however, have no detrimental effect on the shape of the curve!

Figure 2
In both cases, the reduced plate height (h) is 2, which is the theoretical optimum for this column, and the optimal velocity in SFC is approximately three times that of HPLC. The slope, even for a 5-µm particle column, is very flat and, considering that working in the h region of 2–2.5 is acceptable from a practical point of view, mobile-phase flows up to 3 mL/min can be applied easily. At relatively high modifier concentrations, which are usually mandatory in pharmaceutical analysis, the modifier seems to control the retention more than the density or volume of CO2 does. This is illustrated in Figure 3. Figure 3a shows the analysis of some pharmaceuticals in the constant CO2–programmed modifier mode and Figure 3b shows the analysis in the total constant mobile phase mode by programming the CO2 delivery in the negative mode. Both profiles are essentially the same. We also observed that UV baseline stability was better and the noise level lower when the CO2 delivery was constant.
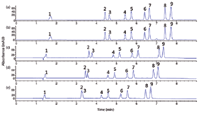
Figure 3
State-of-the-art packed-column SFC instrumentation is equipped with a back pressure regulator. The back-pressure regulator sets and controls the outlet pressure as an analytical parameter independently from the flow. In capillary column SFC, a technique rarely applied nowadays, the use of a fixed restrictor was common practice. A fixed restrictor also is used in microbore packed-column SFC in combination with flame ionization detection, as applied in American Society for Testing and Materials (ASTM) method D-5186. From a theoretical point of view, one can easily argue that for packed-column SFC, back-pressure regulators have several advantages over fixed restrictors. With back-pressure regulators, Po can be controlled properly, whereas with a fixed restrictor Po increases as a function of the modifier concentration. Moreover, it has been shown recently that the noise in UV detection decreases as a function of higher outlet pressures (12). However, chromatographic performance decreases slightly with a higher Po, which affects the resolution. In Figures 3c, 3d, and 3e, the same analyses shown in Figure 3a and 3b were performed on an Agilent 1260 Infinity Analytical SFC system at back pressures of 100, 150, and 200 bar, respectively. From a practical point of view, all chromatograms in Figure 3 — for all six sets of conditions — are of high quality. Selectivity differences are observed; for example, the resolution of peaks 2 and 3 decreases as a function of Po, whereas the resolution of peaks 8 and 9 increases as a function of Po. Of course, this observation is specific for that particular sample, but it is also typical for SFC, in which all parameters — temperature, pressure drop, flow, Po, modifier nature, and modifier concentration — affect resolution by influencing the selectivity factor (α), the retention factor (κ), and to a lesser extent, the efficiency (N).
Fixed restrictors in packed-column SFC have some practical advantages over back-pressure regulators. First of all, we have experienced over the years that a back-pressure regulator is one of the critical parts of a packed-column SFC instrument and that fluctuations in data often can been ascribed to a malfunction of the back-pressure regulator. Repeatability and reproducibility with fixed restrictors are excellent. Illustrations of the repeatability (n = 10) are shown in Figure 4 for columns packed with 5-µm (Figure 4a) and 1.8-µm (Figure 4b) particles. The latter are used for high-throughput analysis (<2 min), and the figure illustrates that the same instrumental setup can be used for different column dimensions and particle sizes.
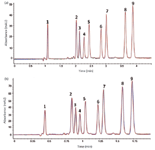
Figure 4
Moreover, hyphenating SFC to ELSD or MS is much easier using a fixed restrictor. Most theoretical and method development studies in SFC have been carried out with UV detection, but in drug discovery operations, MS and ELSD are the detection methods of choice because of their quasi-universal response. Our studies based on the use of these two detectors in SFC might offer completely new insight into the performance of pharmaceutical analysis using CO2-based mobile phases, as will be illustrated further. Figures 5a and 5b show the parallel UV and ELSD traces of the same analytes shown in Figure 3. Under the selected conditions, ELSD is approximately five times less sensitive than UV. Interesting to note is that the apparent resolution in Figure 5b is approximately 20% higher than in Figure 5a (the widths of peak 9 are 0.050 min and 0.062 min, respectively, and the resolution between peaks 8 and 9 is 3.0 and 3.6, respectively). This difference in resolution results from the fact that ELSD is a nonlinear detection method and that the resolution appears better than it really is, as described in 1984 by Guiochon and colleagues. (13).
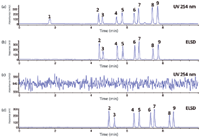
Figure 5
The combination of three detectors (UV, ELSD, and MS) for drug discovery studies is feasible, but a simple quadrupole MS system is more appropriate. Optimal data for TOF-MS are obtained by bypassing the UV and ELSD detectors and directly placing the restrictor in the atmospheric-pressure chemical ionization (APCI) source. The rationale behind this setup is that samples have to be diluted at least 25 times compared to UV and ELSD analyses to avoid overloading the ion source. The outlet tip of the restrictor can be heated to 60 °C via a Caloratherm heater (Selerity Technologies) but for pharmaceutical applications, this step is not necessary. For lipid samples containing mostly saturated triglycerides, heating is recommended to avoid condensation. A typical SFC–APCI-TOF-MS pharmaceutical analysis on a 50 mm × 4.6 mm, 1.8-µm dp Zorbax Rx-Sil column with the experimental setup described and using generic conditions was presented in 2010 (1). An illustration that the same system is applicable to nonpharmaceutical samples, such as from the chemical industry, is shown in Figure 6. Non-UV-absorbing alcohol ethoxylates are separated on a 250 mm µ 4.6 mm, 5-µm dp Zorbax Rx-Sil column using 2 mL/min CO2 and modifier consisting of 95:5 methanol–water containing 10 mM ammonium formate is programmed from 0.4 mL/min to 1.2 mL/min in 20 min. At the end of the analysis, the CO2–methanol ratio was 60:40. Some typical spectral data are included in the inset images in the figure.
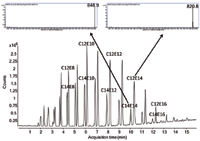
Figure 6
Phase Demixing: An Anomaly in the Fundamentals and Practice of Supercritical Fluid Chromatography
In all chromatographic forms, the mobile phase must be a single phase (GC) or the constituents must form a single phase (LC and SFC). CO2, modifiers, and additives used in SFC, subcritical fluid chromatography, or enhanced fluidity chromatography form a single phase provided the outlet pressure remains above approximately 80 bar (4). At lower outlet pressures, phase demixing occurs and it is believed that this has dramatic effects on chromatographic performance (4). Our research, however, shows that phase demixing is indeed occurring but that it has no detrimental effect at all on the chromatographic performance of separations based on mobile phases containing CO2. The phase separation takes place at the very end of the column and its degree depends on the pressure drop (flow) over the entire column (data not shown). What are the consequences of phase separation? First of all, an important fact to consider in this discussion is that pharmaceutical solutes are not at all soluble in pure CO2. This means that when phase separation occurs, the solutes are only present in the modifier part of the mobile phase and continue their partition and transport to the detector. Upon decompression, CO2 forms gaseous bubbles that no longer take part in the separation mechanism. This phenomenon is illustrated in Figures 5c and 5d. A very short connecting tube giving approximately 20 bar Po (calculated by measuring the inlet pressure with and without the tubing) was placed after the UV detector, and both the UV signal and ELSD response were recorded. When phase separation occurs, a very noisy baseline is obtained in UV, masking the recording of the eluted compounds, but the ELSD signal is intact! The longer retention times in Figure 5d compared to Figure 5b can be explained by the gradually decreasing density over the entire column of the mobile phase because of the absence of a long restrictor.
The same conclusion is valid for combining SFC with MS. Figure 7 shows the SFC–TOF-MS separation of a pharmaceutical mixture by simply using a standard LC–MS connection tube (PEEK, 50 cm × 0.12 mm i.d.), which gives approximately 25 bar back pressure. The sample concentration was diluted 25 times compared to Figure 5. Mass spectral data using SFC–APCI-TOF-MS are of utmost importance in drug discovery. Interpreting the high resolution spectra is relatively easy, and adduct formation (as compared to electrospray ionization, or ESI) is nearly absent. Moreover, the sensitivity is very high and subnanogram quantities can be recorded.
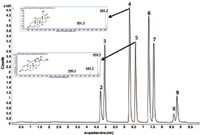
Figure 7
Chiral analysis is "the" niche application of SFC in pharmaceutical analysis, and therefore the same phenomenon is illustrated for the analysis of the racemate of guaiacol glyceryl ether carbamate on a 50 mm × 4.6 mm, 3-µm dpLUX-1 column (Phenomenex, Torrance, California). Figures 8a and 8b show the SFC–UV-MS analysis with a restrictor of 120 bar, and Figures 8c and 8d show this analysis without a restrictor. The total analysis time is 3 min, and without restriction, UV detection is impossible. For drug discovery, SFC–MS is preferred over SFC–UV because ion extraction (same response for both enantiomers) can be applied to screen out the target solute from other compounds present in the sample and because the sensitivity of MS is much higher than UV, allowing more-sensitive quantification of the enantiomer ratio or excess.
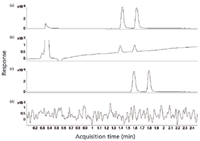
Figure 8
When the pressure drop over the column is increased by using higher flow rates, the outlet pressure can rise up to 80 bar. Figure 9 shows the high-throughput (1 min) SFC–UV–TOF-MS analysis of the mixture diluted 25 times with both UV and TOF-MS detection. UV detection is now possible because a flow rate of 4.4 mL/min has been applied.
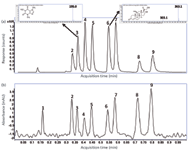
Figure 9
The same instrumental setup has been used for HILIC–SFC or HILIC–enhanced fluidity chromatography (14,15). The advantage of this method is that acetonitrile, by far the most generic solvent in conventional HILIC, can be replaced by alcohol–CO2 mixtures, translating HILIC into a green chromatographic method. We refer to several recent publications for more details (14–16).
Conclusion
CO2 is an excellent mobile-phase ingredient. Its use not only contributes to the greening of liquid-based separations but performs normal-phase type separations better, faster, and cheaper than normal-phase LC. Moreover, information obtained in drug discovery studies using SFC is complementary to that obtained using reversed-phase LC and HILIC. We have demonstrated that a simple modular instrumental setup can be built that provides data with the same robustness as HPLC. Combining SFC with TOF-MS creates a very powerful tool for drug discovery studies by combining fast scan and high sensitivity with accurate mass determinations. It is our hope that this contribution will aid in increasing the popularity of this exciting separation technique.
Alberto Pereira is a researcher in fluid-based separation techniques, Frank David is the R&D manager, Gerd Vanhoenacker is the head of the HPLC division, and Pat Sandra is the director, all at the Research Institute for Chromatography, Pres. Kennedypark 26, B-8500 Kortrijk, Belgium. Claudio Brunelli is a researcher responsible for implementation of SFC in drug development at Pfizer Global R&D, Analytical R&D, Ramsgate Road, Sandwich, Kent CT13 9NJ, UK. Pat Sandra is the corresponding author, and may be reached at pat.sandra@richrom.com.
References
1. P. Sandra, A. Pereira, M. Dunkle, C. Brunelli, and F. David, LCGC Europe 23(8), 396–405 (2010).
2. P. Sandra, "Supercritical Fluid Chromatography, Past, Present and Future," tutorial talk presented at the HPLC 2011 Symposium, Budapest, Hungary, June 19–23, 2011.
3. T. Berger, Packed-Column SFC; RSC Chromatography Monographs, (The Royal Society of Chemistry, Herts, UK, 1995).
4. T. Berger, J. High Resol. Chromatogr. 14(5), 312–316 (1991).
5. L. Taylor, Anal. Chem. 80, 4285–4294 (2008).
6. G. Guiochon and A. Tarafder, J. Chromatogr. A 1218(8), 1037–1114 (2011).
7. E. Lesellier, J. Sep. Sci. 31(8), 1238–1251 (2008).
8. C. West and E. Lesellier, J. Chromatogr. A 1191, 21–39 (2008).
9. D.P. Poe and J.J. Schroden, J. Chromatogr. A 1216, 7915–7926 (2009).
10. A. Tarafder and G. Guiochon, J. Chromatogr. A 1218(28), 4569–4575 (2011).
11. A. Tarafder and G. Guiochon, J. Chromatogr. A 1218(28), 4576–4585 (2011).
12. T. Berger and C. Berger, J. Chromatogr. A 1218, 2320–2326 (2011).
13. A. Stolyhwo, H. Colin, M. Martin, and G. Guiochon, J. Chromatogr. 288, 253–275 (1984).
14. A. Pereira, A.J. Giron, E. Admasu, and P. Sandra, J. Sep. Sci. 33, 834–837 (2010).
15. P. Sandra, K. Sandra, A. Pereira, G. Vanhoenacker, and F. David, LCGC Europe 23(5), 242–259 (2010).
16. J.W. Treadway, G.S. Philibert, and S.V. Olesik, J. Chromatogr. A 1218, 5897–5902 (2011).
Regulatory Deadlines and Supply Chain Challenges Take Center Stage in Nitrosamine Discussion
April 10th 2025During an LCGC International peer exchange, Aloka Srinivasan, Mayank Bhanti, and Amber Burch discussed the regulatory deadlines and supply chain challenges that come with nitrosamine analysis.


