A Simple and Interactive Column Classification for Reversed-Phase Liquid Chromatography: The Carotenoid Test, Part 1: Studied Properties, Probes, and Fundamentals
LCGC Europe
Cartenoid compounds can be used as probes for studying bonded stationary phases for reversed-phase liquid chromatography, such as C18, phenyl-hexyl, and cholesteryl. From one supercritical fluid chromatography (SFC) analysis that favours the chromatographic behaviours related to the stationary phase properties, bonding density, ligand type (monomeric or polymeric), and endcapping treatment, two separation factors are calculated allowing us to build a two-dimensional map. These two axes are related either to the shape selectivity or the polar surface activity (residual silanols). Each point on the map corresponds to a column. The retention factor of β-carotene, which describes the phase hydrophobicity, is indicated by the size of the point. More than 200 stationary phases were studied, including small particle sizes and superficially porous ones.
Eric Lesellier, University of Paris Saclay, Orsay, France
Cartenoid compounds can be used as probes for studying bonded stationary phases for reversed-phase liquid chromatography, such as C18, phenyl-hexyl, and cholesteryl. From one supercritical fluid chromatography (SFC) analysis that favours the chromatographic behaviours related to the stationary phase properties, bonding density, ligand type (monomeric or polymeric), and endcapping treatment, two separation factors are calculated allowing us to build a two-dimensional map. These two axes are related either to the shape selectivity or the polar surface activity (residual silanols). Each point on the map corresponds to a column. The retention factor of β-carotene, which describes the phase hydrophobicity, is indicated by the size of the point. More than 200 stationary phases were studied, including small particle sizes and superficially porous ones.
Acquiring knowledge about the properties of the bonded stationary phases used in reversed-phase liquid chromatography, mainly for C18 bonded chains, has always been a great challenge for chromatographers and manufacturers (1). The challenge can arise either for the initial choice of the suitable phase for the replacement of one stationary phase by another (1,2), or for quality-by-design method development (3,4).
In recent years, the choice of column has been partly dictated by a desired particle size or type (fully or superficially porous), to allow for very high efficiencies (plate number) (5). However, the chemical properties of the stationary phase are not correlated to particle size or type, and different C18 columns may even display significantly different retention behaviour, sometimes yielding reversal in elution orders, under identical operating conditions.
In the past, numerous attempts were made to provide chromatographic tests with the goal of achieving the evaluation of these properties (6–12). These tests did not provide any information related to the durability of the column when working with acidic or basic conditions - that is, phase ageing. Instead, the tests provide information about the retention of hydrophobic (retention factor of a nonpolar aromatic compound) or hydrophilic compounds (polar and nonpolar selectivity), the ability of compounds to penetrate the C18 chain network (steric resistance, shape selectivity), the presence of acidic and ionized groups onto the silica surface, or of metallic traces (6–14). Simple tests are based on two datasets, either retention factor (k) or separation factor (α), meaning that a two-dimensional (2D) map can be sufficient to compare the phases (9). Hydrophobicity and polar surface activity are often used as axes for these maps, and the obtained classification is usually in agreement with the data provided by the manufacturers in terms of carbon content (%), specific surface area (m2/g), and the presence of residual silanol groups or hydrophilic endcapping groups. From four to six properties (the maximum number of properties usually studied), results can be presented by radar plots (6), principal component analysis (PCA) (15–17), or ranking factor (2,13,14,18). Each of these presentations display advantages and drawbacks (1,18). Some of those drawbacks include:
- the use of radar plots is not convenient for the comparison and classification of numerous stationary phases together;
- the clusters obtained from PCA cannot always be easily related to the retention properties; and
- the ranking is only relevant from a reference column, meaning that no simultaneous comparison of all stationary phases can be done.
Moreover, the use of numerous parameters can introduce a bias in the classification, either because of their lack of relevance or because of the correlation between some of them (1,19). For instance, methylene selectivity, the separation factor between two compounds differing by a CH2 group, varies in relation to the carbon content of C18 bonded phases only up to 10% (1,6,20), which is a rather small value for modern bonded phases. The use of this factor reduces the ability of chemometric treatments to highlight column differences. Besides, the measurement of ionic interactions at two pH values, around 2 and 7, seems unnecessary because few silanols are protonated at pH 2, and it covers in part other hydrophilic interaction measurements with nonionizable compounds - for example, caffeine–phenol used in the Tanaka test to estimate hydrogen bonding (1). Finally, some of these tests required different mobileâphase compositions to measure all properties, further complicating the process.
Test Presentation
Taking into account the problem of the presentation of results, the relevance of the used data, and the mobile-phase conditions, more than 20 years ago we suggested the use of another compound family, the carotenoid pigments, with supercritical fluid chromatography (SFC) as a measurement technique, and limiting the studied parameters (properties) to three to avoid nonrelevant data (21–25).
As shown in Figure 1, three compounds are used to check the stationary-phase properties. All-trans β-carotene contains only hydrogen and carbon atoms, with two aliphatic rings at the extremities of a carbon chain with conjugated double bonds. Because this compound does not have any heteroatom, its retention factor (k) can be related to the phase hydrophobicity - that is, the ability of the compounds to be retained by dispersive interactions by the C18 bonded chains. The hydrophobic retention is related to the carbon content, which determines the bonding density by taking into account the specific surface area.
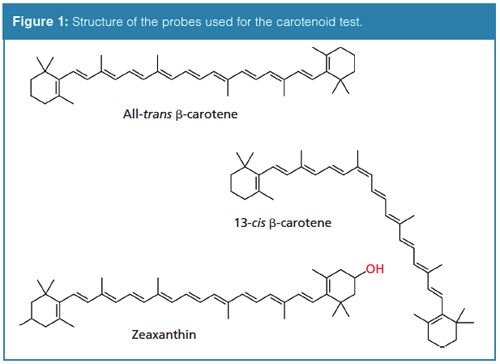
This compound is also linear and its retention can be compared to the retention of its main isomer, 13-cis-β-carotene. Because of the doubleâbond conformation, the cis isomer is bent. This structural difference between the all-trans and the 13-cis isomers can modify the interaction surface between the compounds and the C18 bonded chains. This is measured by the separation factor (α) between the two isomers (cis–trans). The obtained values can be related to the shape selectivity, also called shape recognition, which is the ability of the stationary phase to separate compounds on the basis of their structural organization, for instance, diastereoisomers.
The third compound is a xanthophyll, that is to say a carotenoid pigment with oxygen atoms. Compared to all-trans β-carotene, zeaxanthin has two more hydroxyl groups located on the rings. We can suppose that these additional groups are perfectly located to establish “polar interactions”, mainly hydrogen bonding, with all polar groups located on or near the silica surface. The separation factor (α) between the hydrocarbon and oxygenated molecules (β/zea) could be related to the polar surface activity of the stationary phase: the higher this selectivity value, the lower the polar surface activity.
The retention of these three compounds is studied for each column in SFC, with a 85:15 v/v carbon dioxide–methanol mobile phase, a temperature of 25 °C, an outlet pressure of 15 MPa, a flow rate of 3 mL/min, and a UV detection wavelength of 440 nm.
These conditions have been optimized, mainly the nature and the percentage of modifier (methanol) to ensure reliable results and large ranges in the scales of the studied parameters, with a reasonable duration time for the analysis.
The use of a supercritical fluid avoids the presence of water in the mobile phase, favouring the interactions between zeaxanthin and polar groups like residual silanol groups. Moreover, the separation of cis–trans isomers of β-carotene on C18-bonded phases is enhanced compared to liquid mobile phases. Such a separation in high performance liquid chromatography (HPLC) often requires the use of long carbon chains (C30 bonded phases). On the other hand, no C8 bonded phases can be characterized by the carotenoid test because of the lack of separation between cis and trans isomers. However, the test can be applied to phenyl-hexyl phases, which are slowly going to replace C8 phases for new method developments.
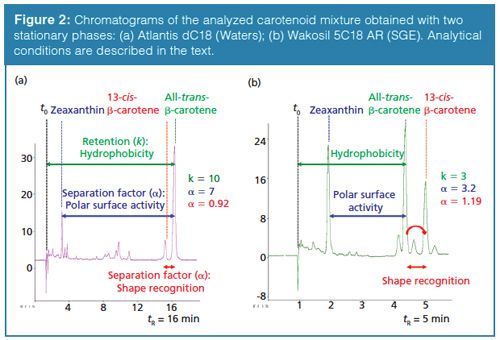
As shown in Figure 2, a single chromatogram allows the calculation of one retention factor (k) for hydrophobicity and two separation factors (α) for polar surface activity and shape recognition. One can see in Figure 2(b) that numerous other cis isomers can be separated with a short run time for the analysis, showing that SFC is rapid and can perform the separation for the studies of the stationary-phase properties.
When plotting those data on a map (Figure 3), with the 13-cis/all-trans β-carotene separation factors on the x-axis (scale from 0.85 to 1.3) and the all-trans β-carotene/zeaxanthin separation factors on the y-axis (scale from 0 to 20), one can locate each column depending on its properties related to the carotenoids chromatographic behaviour. On the map, each point represents one column, and the third property, hydrophobicity, measured by the retention factor of all-trans β-carotene, is reported by the size of the point. The map was divided into 11 groups, related to the values of the two axes, and the properties of the columns of each group will be explained in part 2 of this article series. The main idea is that columns included in one group would provide close elution order for most analytes in a sample, meaning that their chromatographic selectivity should be close. However, inside each group, depending on the size of the point, the phase hydrophobicity can be very different. For example, in group 9, phases n°63 and n°64 (or n°15 and n°177 in group 8) are close but the hydrophobicity of columns 64 and 15 are higher than that of columns 63 and 177. That means that the chromatogram would display a close retention order (separation factor) for the first and the second couple of columns, but with a longer analysis time for columns 64 and 15. This can be explained either by a different specific surface area or a different bonding density.
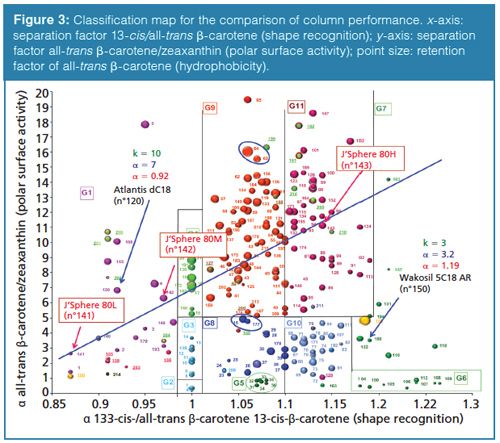
The results from the two stationary phases tested in Figure 2 indicate that they are located in two different groups, group 1 (G1) for Atlantis dC18 (n°120) (Waters), and group 7 (G7) for Wakosil 5C18 AR (n°150) (SGE), mainly because of different shape recognition, with a reversal of the retention order of the two β-carotene isomers and with shape recognition values of 0.92 and 1.19, respectively. The Atlantic dC18 column has lower polar surface activity (α = 7 versus α = 3.2) and a higher hydrophobicity (k = 10 versus k = 3).
Test Relevance
Before one can effectively use the map, the relevance of the discussed properties - that is, the measurements proposed - should be addressed.
First we studied the location of three J’Sphere 80 phases (YMC America), called L (low bonding density), M (medium bonding density), and H (high bonding density). These three stationary phases are made of the same silica (pore diameter = 80 Å), with different carbon content (9%, 14%, and 22%, respectively), and different bonding density (0.9, 1.6, and 2.9 μmol/m2, respectively), and are often used as reference materials (9,26). Because the pore diameter is the same, the three phases display an identical specific surface area (500 m2/g), and the increase in the carbon content explains the bonding density enhancement, meaning that the C18 chains become closer to each other from J’Sphere 80L to J’Sphere 80H. As shown in Figure 3, this bonding density increase leads to both an increase in the shape recognition and the polar surface activity values because the three points representing the three columns are located along a diagonal line from bottom left to top right.
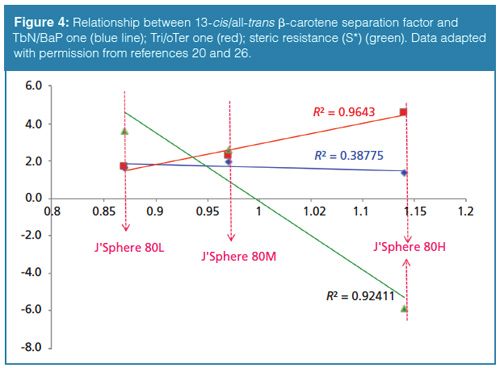
The measurement of shape recognition (along the abscissa) indicates that with very low bonding density, the bent isomer (13-cis) is more retained than the linear (allâtrans) one. Then, when increasing the bonding density, the retention of the bent isomer increases compared to the linear isomer. Because the J’Sphere phases are monomeric, meaning that one C18 chain is bonded to one silanol group, this result underlines the relationship between the bonding density and the separation factor for the two isomers of β-carotene. Figure 4 shows the relationship between the 13-cis/trans beta-carotene separation factor (x-axis), and the TbN/BaP (blue) (14–28), the Tri/o-Ter (red) (6,15,16) or the steric selectivity S* one (green)(2,13,27) (y-axis), which are other measurements of the stationary phase organization. Tetrabenzonaphthalene (TbN), benzo[a]pyrene (BaP), triphenylene (Tri), and o-terphenyl (o-Ter) are polycyclic aromatic compounds, which also have linear or bent structures, whereas the steric selectivity S* is related to the compound size. By using a linear relationship, a rather satisfactory correlation is observed between the studied values, except for TbN/BaP. However, this last point was not confirmed by using a greater number of stationary phases, including polymeric bonded phases (29). Nevertheless, these results indicate the relevance of the use of linear and bent carotenoid isomers to assess shape recognition properties.
Secondly, the increase in the separation factor between all-trans β-carotene and zeaxanthin indicate that the decreasing polar surface activity (along the ordinate axis) is because of the reducing retention of zeaxanthin (Figure 3). The two hydroxyl groups of zeaxanthin can interact with residual (free) silanol groups, or other polar groups. The increase in the carbon content - that is, the number of C18 chains bonded per surface unit - is related to a reduced amount of residual silanol groups, especially because no endcapping treatment is applied on these stationary phases.
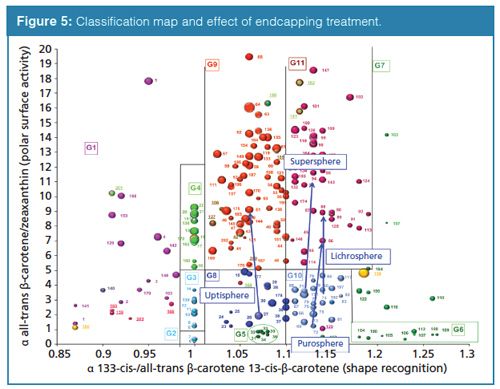
Further evidence of the relevance of the polar surface activity is provided by plotting four pairs of stationary phases, with (n°51, n°86, n°88, and n°94) or without (n°27, n°71, n°72, and n°74) endcapping treatment. This treatment is an additional bonding of small hydrophobic compounds, for instance trimethylsilane, after the bonding of C18 chains, which reduces the amount of residual silanol groups. As shown in Figure 5, the endcapping treatment leads to a significant increase in the value of the all-trans β-carotene/zeaxanthin separation factors, meaning a strong decrease of polar surface activity because of the decrease of free residual silanols. Besides, one can see that the shape recognition, which is related to the bonding density of C18 chains, does not change with the endcapping treatment, whereas hydrophobicity of the phases is also almost constant, before and after endcapping treatment.
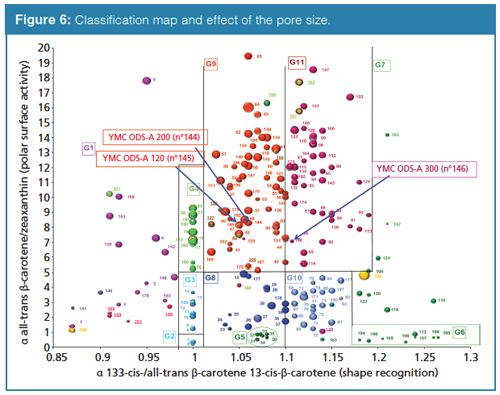
The effect of the change in the pore size (120 Å, 200 Å, and 300 Å) can also be observed with three phases bonded with an identical approach from the same manufacturer (n°144, n°145, and n°146). The increase in pore size from 120 Å to 300 Å causes decreased carbon content, from 17% to 12% and 7%. Figure 6 shows that the polar surface activity is very close for the three phases, indicating a similar proportion of residual silanol groups. Note that these phases are fully endcapped. In addition, shape recognition does not change from 120 Å to 200 Å, whereas it is strongly modified for the 300-Å phase. One can suppose that the curvature of the pore, related to the pore radius, can modify the three-dimensional (3D) organization of C18 bonded phases, inducing changes in the interaction surface of linear or bent compounds with the C18 chains. In relation to this observation, one can remark on the different location of groups 5 and 6. All phases included in these two groups are designed for polycyclic aromatic hydrocarbon (PAH) separation. They are called polymeric, meaning that after the first C18 chain is bonded onto the silica (and in the case of the use of di- or trichorosilane as bonding reactant), in the presence of traces of water, another C18 chain can be linked to the first one, finally producing a polymeric bonding (28). This type of polymerization is called vertical polymerization (28), as opposed to horizontal polymerization (30), which consists of binding the reactive silanes together to “protect” the silica surface. The main difference between these two groups is the pore size, which is around 100 Å for group 5 and 300 Å for group 6. Extensive studies of changes in shape selectivity of monomeric and polymeric phases were done by Sander and Wise with the PAH test (NIST 869a) (29). Besides, as expected, the decrease in the carbon content caused by the pore size increase reduces the phase hydrophobicity because of the lower specific surface area for larger pore phase.
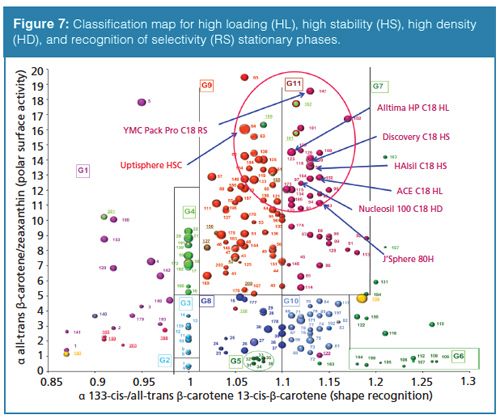
Finally, Figure 7 shows the location of numerous stationary phases known to have a high carbon content. These phases are called HL for high loading, HD for high density, RS for recognition of stereoselectivity, or HS for high stability. All of these phases are located in a close area, with a low polar surface activity (the separation factor of all-trans β-carotene/zeaxanthin is high), and a rather similar shape recognition (most of the values are higher than 1.1). This shows that all these monomeric phases display a high bonding density, which reduces the amount of residual silanol groups, and provides rather organized stationary phase with C18 chains very close to each other.
Conclusion
To summarize, the carotenoid test provides chromatographers with a simple classification map based on three main properties of the stationary phases designed for reversedâphase liquid chromatography. This classification can be done despite the use of a supercritical fluid as the mobile phase, which is supposed to enhance some behaviours because of the lack of water in the mobile phase.
Several studies using classical and known stationary phases showed the relevance of the measurements performed in relation to some chromatographic behaviours and stationary phase properties. Comparison with other tests also confirmed this point.
By using two separation factors on the two axes, the polar surface activity, which is related to the retention behaviour of compounds having different polar groups, and the shape recognition, which is involved in separations of compounds having different spatial structure (for instance diastereoisomers), one can easily compare the stationary phases. This comparison can be done with no limit to the number of columns compared, and without the need for a reference column. Moreover, the location of the point and its size, which describes the phase hydrophobicity, can easily be related to the phase properties. This approach could be an advantage to explain the choice of a phase in a quality-by-design approach.
In the second part of this series, we will describe the specificity of the 11 groups of stationary phases, and the following other uses for this map:
- the study of the change in phase properties when manufacturers provide phase evolution,
- the location of numerous phases made with superficially porous particles, or with hybrid silica (organic–inorganic), or with other ligands (phenyl-hexyl, cholesteryl), and
- the effect of the particle size on the studied phase properties, and the use of the map for phases devoted to ultrahigh-pressure liquid chromatography (UHPLC), which have sub-2-µm fully porous particles.
Finally, a presentation of a new web tool will be included. An interactive map is now available on-line as an open source, including the names of the columns that correspond to the numbers on the map (31). This tool allows users to have a look at each phase location, by using the column name, the column group, the column manufacturer, the ligand, or the particle type. Last, but not least, it allows users to compare two or more columns, or the portfolio of two manufacturers.
References
- E. Lesellier and C. West, J. Chromatogr. A1158, 329–360 (2007).
- J.W. Dolan, A. Maule, D. Bingley, L. Wrisley, C.C. Chan, M. Angor, C. Lunte, R. Kristo, J.M. Winston, B.A. Homeier, D.V. McCalley, and L.R. Snyder, J. Chromatogr. A1057, 59–74 (2004).
- R. Kormany, I. Molnar, and H.J. Rieger, J. Pharm. Biomed. Anal.80, 79–88 (2013).
- B. Debrus, D. Guillarme, and S. Rudaz, J. Pharm. Biomed. Anal.84, 215–223 (2013).
- F. Gritti, A. Cavazzini, N. Marchetti, and G. Guiochon, J. Chromatogr. A1157, 289–303 (2007).
- K. Kimata, K. Iwaguchi, S. Onishi, K. Jinno, R. Eksteen, K. Hosoya, M. Araki, and N. Tanaka, J. Chromatogr. Sci.27, 721–728 (1989).
- H. Engelhardt, M. Nikolov, M. Arangio, and M. Scherer, Chromatographia 48, 183–188 (1998).
- H. Engelhardt and M. Jungheim, Chromatographia29, 59–68 (1990).
- U.D. Neue, B.A. Alden, and T.H. Walter, J. Chromatogr. A849, 101–116 (1999).
- T. Ivanyi, Y. Vander Heyden, D. Visky, P. Baten, J. De Beer, I. Lazar, D.L. Massart, E. Roets, and J. Hoogmartens, J. Chromatogr. A954, 99–114 (2002).
- H.A. Claessens, M.A. van Straten, C.A. Cramers, M. Jezierka, and B. Buszewski, J. Chromatogr. A826, 135–156 (1998).
- L.C. Sander and S. Wise, Anal. Chem.56, 504–510 (1984).
- L.R. Snyder, J.W. Dolan, and P.W. Carr, J. Chromatogr. A1060, 77–116 (2004).
- L.C. Sander and S. Wise, J. Sep. Sci.26, 283–294 (2003).
- E. Cruz, M.R. Euerby, C.M. Johnson, and C.A. Hackett, Chromatographia44, 151–161 (1997).
- M. Euerby and P. Petersson, J. Chromatogr. A994, 13–36 (2003).
- R. Brereton and D.V. McCalley, Analyst123, 1175–1185 (1998).
- C. West, M.A. Khalikova, E. Lesellier, and K. Héberger, J. Chromatogr. A 1409, 241–250 (2011).
- L. Szepesky, J. Sep. Sci.26, 201–214 (2003).
- E. Lesellier, J. Chromatog. A 1218, 251–257 (2011).
- E. Lesellier and A. Tchapla, J. Chromatogr. A1100, 45–59 (2005).
- E. Lesellier, C. West, and A. Tchapla, J. Chromatogr. A1111, 62–70 (2006).
- E. Lesellier and C. West, J. Chromatogr. A1149, 345–357 (2007).
- C. West, L. Fougère, and E. Lesellier, J. Chromatogr. A1189, 227–244 (2008).
- E. Lesellier, J. Sep. Sci.33, 3097–3105 (2010).
- U.D. Neue, B.A. Alden, P.C. Iraneta, C.H. Phoebe, and K. Van Tran, Chromatographia54, 169–177 (2001).
- J.J Gilroy, J.W. Dolan, and L.R. Snyder, J. Chromatogr. A 1000, 757–778 (2003).
- L.C. Sander and S.A. Wise, J. Chromatogr. A656, 335–351 (1993).
- E. Lesellier and A. Tchapla, J. Chromatogr.645, 29–39 (1993).
- M.J. Wirth and H.O. Fatunmbi, Anal. Chem.64, 2783–2786 (1992).
- http://www.icoa.fr/classification_c18_columns/
Eric Lesellier has been an Associate Professor at the University of Paris Saclay (Orsay) since 1990, while carrying out his research at the Institute of Organic and Analytical Chemical (ICOA, CNRS UMR 7311), in Orléans, France. He is mainly interested in the understanding and modelling (LSER) of molecular interactions in supercritical fluid chromatography, and classification (map) systems (carotenoid test; spider diagram), of both stationary phases and solvent properties used for separation and extraction.
David S. Bell is a manager in pharmaceutical and bioanalytical research at MilliporeSigma (formerly Sigma-Aldrich/Supelco). With a B.S. degree from SUNY Plattsburgh and a Ph.D. in analytical chemistry from The Pennsylvania State University, Dave spent the first decade of his career within the pharmaceutical industry performing analytical method development using various forms of chromatography and electrophoresis. During the past 15 years, working directly in the chromatography industry, Dave has focused his efforts on the design, development, and application of stationary phases for use in HPLC and hyphenated techniques. In his current role at MilliporeSigma, his main focus has been to research, publish, and present on the topic of molecular interactions that contribute to retention and selectivity in an array of chromatographic processes.
Direct correspondence to: LCGCedit@ubm.com

Understanding FDA Recommendations for N-Nitrosamine Impurity Levels
April 17th 2025We spoke with Josh Hoerner, general manager of Purisys, which specializes in a small volume custom synthesis and specialized controlled substance manufacturing, to gain his perspective on FDA’s recommendations for acceptable intake limits for N-nitrosamine impurities.


