Sensitivity of Comprehensive Two-dimensional Gas Chromatography (GCXGC) Versus One-dimensional Gas Chromatography (1D GC)
LCGC Europe
In this article, the sensitivity of two-dimensional gas chromatography coupled to two different detectors - a time-offl ight mass spectrometer (GCXGC–TOF-MS) and a fl ame ionization detector (GC?GC–FID) - was compared to the sensitivity of conventional one-dimensional gas chromatography (GC–TOF-MS and GC–FID) by determining method detection limits (MDLs) for a series of different compounds with different polarities.
Advantages of comprehensive two-dimensional gas chromatography (GC×GC) include increased peak capacity, improved resolution, and unique selectivity compared to conventional one-dimensional gas chromatography (1D GC). Despite the maturing status of the technique, there are still some outstanding issues that spark discussion and controversy. One of them is the sensitivity enhancement in GC×GC separations compared to conventional 1D separation. In this article, the sensitivity of two-dimensional gas chromatography coupled to two different detectors — a time-of-flight mass spectrometer (GC×GC–TOF-MS) and a flame ionization detector (GC×GC–FID) — was compared to the sensitivity of conventional one-dimensional gas chromatography (GC–TOF-MS and GC–FID) by determining method detection limits (MDLs) for a series of different compounds with different polarities.
GC×GC was first introduced by Phillips in the 1990s (1), and it soon proved to be a very powerful separation technique. GC×GC provides highly structured separations with high resolving power. In spite of the many applications described in the literature, little attention has been devoted to quantitative evaluation of the technique and to quantitative comparison of these systems with the one-dimensional (1D) counterparts. The sensitivity enhancement in GC×GC separations compared to conventional 1D separations is still considered a somewhat controversial issue. In GC×GC, two columns of different properties are connected in series through a special interface (modulator). The modulator collects portions of the first dimension effluent, and injects them at regular intervals to the second dimension. Cryogenic modulators collect the effluent fractions at sub-oven temperatures and re-inject them in the form of a very narrow pulse when the temperature of the modulator is brought back up (2). In theory, this should increase the signal-to-noise ratio (S/N), because the mass flow rate of the solute into the detector is increased. This band recompression is generally considered to result in increased sensitivity. Increasing the frequency of the chemical signal entering a detector is an excellent way to enhance the S/N ratio (3). Philips and Liu used thermal desorption modulation between the outlet of the column and the inlet of the detector to enhance chromatographic sensitivity and S/N ratio (4). An increase by a factor of 10 was observed (4). Kinghorn and Marriott used a longitudinally modulated cryogenic system (LMCS) for the same purpose, that is, S/N enhancement in capillary gas chromatography. An increase of S/N ratio by a factor of 10 was also reported (5, 6). The increase in peak amplitude using GC×GC compared to a single column has been qualitatively discussed by DeGeus (7). Habram and Welsch reported a 10–27× increase in the S/N ratio through modulation (8). Lee et al. proposed a theoretical model for simple calculation of sensitivity enhancement in GC×GC over 1D separation (9). Contrary to that, a paper published in the Journal of Chromatography A in 2003 (10) claimed that there is no increase in the sensitivity of GC×GC over 1D GC and stated that "(…) addition of the second dimension does not change the system MDC (minimum detectable concentration) for any solute that is sufficiently separated in one-dimensional GC and in GC×GC and has the same retention in both cases." The authors mentioned that the detector electronic noise is the main contributor in the determination of MDC, and this noise cannot be reduced below a certain level limited by the white noise (10). In a GC system, under controlled conditions, the noise consists primarily of the sum of two slowly varying components: a steady-state standing-current offset (GC detector noise) (11) and "chemical" or "chromatographic" noise which includes temperature-induced column-bleed and solvent tail. The main goals of this study were to compare the sensitivity in GC×GC and 1D GC using the US Environmental Protection Agency (EPA)-recommended method (12) to determine the method detection limits (MDLs) for both techniques, to study the effect of noise on the sensitivity of the method, and to determine major noise contributors (electronic noise and chromatographic noise, for example).
Experimental
Instrumental Parameters: The GC×GC system consisted of an Agilent 6890 GC (Agilent Technologies) equipped with a single jet, liquid nitrogen cryogenic modulator, coupled to a Pegasus III time-of-flight mass spectrometer (TOF-MS) and a flame ionization detector (FID) (LECO Corp.) (13). The column set consisted of a 30 m × 0.25 mm, 1.00 µm df VF-1MS (Varian) as a primary column coupled to a 1.5 m × 0.25 mm, 0.25 µm df SolGel-Wax phase second dimension column (SGE). Modulation periods of 2 s, 4 s, 6 s, and 8 s were used with the cryogenic trap cooled to –196 °C using liquid nitrogen. The separation was performed using the following temperature programme: Initial temperature 50 °C, kept for 0.2 min, and ramped at 4 °C/min to 150 °C (mixture 1); initial temperature 40 °C, kept for 0.2 min, ramped at 30 °C/min to 240 °C, and then ramped at 4 °C/min to 280 °C and held for 3 min (mixture 2). The injector was operated at 280 °C and 1 µL injections were performed in pulsed splitless mode, with a splitless time of 1 min. Helium was used as the carrier gas at a constant flow of 1.4 mL/min for TOF-MS and 1.6 mL/min for the FID. The MS transfer line was maintained at 250 °C. Ions in the mass range 35–400 amu were acquired at a rate of 100 spectra/s. The ion source temperature was 225 °C and the detector voltage was set to -1800 V. Flame ionization detection was performed at 350 °C, with data collected at 100 Hz. Three different types of inlet ferrules were used: 100% graphite ferrules (with mixture 1); vespel–graphite and SilTite ferrules (with mixture 2).
Chemicals and Stock Solutions: Two mixtures were used for this study. Mixture 1 consisted of n-nonane (n-C9), n-decane (n-C10), n-dodecane (n-C12), and 3-octanol dissolved in n-hexane (freshly distilled before use). Mixture 2 was composed of n-eicosane (n-C20), n-docosane (n-C22), n-tetracosane (n-C24), and pyrene in CS2. Hexane and all the standards were obtained from Sigma–Aldrich. CS2 was obtained from Fisher Scientific. Helium (99.999% purity) was delivered by Praxair.
Stock solutions of n-C9, n-C10, n-C12, and 3-octanol were prepared in n-hexane at a concentration of 1 mg/mL; n-C20, n-C22, n-C24, and pyrene were prepared in CS2 at the same concentration. The concentrations used with TOF-MS and FID (Table 1) were prepared by dilution of the appropriate volumes into n-hexane and CS2.

Table 1: Sample concentrations used in method detection limit (MDL) determination.
Method Detection Limit Calculations: The EPA approach as defined in the U.S. EPA Electronic Code of Federal Regulations (12) was used for the calculation of MDLs. The EPA method detection limit approach utilizes a single-concentration design estimator. The first step is to determine an estimate of the detection limit (EDL). An EDL is defined as a concentration value which maintains an instrument S/N ratio in the range of 2.5–5. The EDL is then used to choose the concentration at which standards should be prepared. The EPA recommends using a concentration that is between 1 and 5× the EDL. Eight aliquots of the sample concentration (Table 1) were prepared and the standard deviations for the peak heights of replicate measurements were calculated. The MDL was calculated as follows:

Where MDL is the method detection limit, tn-1, 1-∞ = 0.99 is the student's t-value appropriate for a 99% confidence level and a standard deviation estimate with n-1 degrees of freedom, and S is the standard deviation of the replicate analyses. In this study, the MDLs were estimated using the tallest second-dimension peak for a given analyte, because at or close to the MDL only this peak would be visible in most cases.
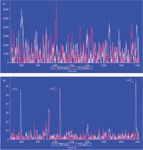
Figure 1: (a) Total ion current (TIC) of n-C9, n-C10, and n-C12 (5 pg/µL, red, and 80 pg/µL, white) using 1D GCâTOF-MS separation. (b) m/z = 71 extracted ion chromatogram of n-C9, n-C10, and n-C12 (5 pg/µL, red, and 80 pg/µL, white) using 1D GCâTOF-MS.
Results and Discussion
Choice of Method: To make an "absolute" comparison of the MDLs in 1D GC and GC×GC, both separations should be performed under carefully optimized conditions. This would potentially require the use of different column geometries, temperature programming rates, and data acquisition rates, for example. However, from the authors' experience, most potential users would like to use GC×GC as a simple "plug-in" that they add to a system without changing the method they have developed and validated. On top of that, conditions that are optimal with respect to sensitivity (for example, the optimal temperature programming rate) quite often cannot be used in the analysis of real samples, for instance because of insufficient selectivity. Consequently, we decided to perform the comparison under similar conditions for both methods, the only difference being the absence of modulation and the second dimension column in 1D separations. We believe that such a comparison is valuable, because it is applicable to most practical scenarios.

Figure 2: GCÃGCâTOF-MS separation of 5 pg/µL n-C9 peak from the solvent tail (4 s modulation, m/z = 71).
The primary reason the EPA procedure was used rather than the simplistic (but popular) conventional approach based on the magnitude of the S/N ratio is that the latter largely ignores the variability of the response close to the MDL, in effect leading to overly optimistic results. This is particularly important in GC×GC, where the MDL estimation is based on the individual second dimension chromatogram ("slice") with the highest intensity of the response (peak height). This peak height in GC×GC is affected not only by the random factors that also affect 1D separations, but also by random variations in the modulation phase (a case in point: Different slices sometimes had to be used for the same analyte if the modulation was close to perfectly out-of-phase). Thus, even though the S/N ratio in any single analysis might suggest lower MDL, the increased variability of the height of the most intense peak in GC×GC (compared to the height variability of a single, well defined peak in 1D separations) makes the actual MDL comparably higher.

Table 2: MDL values of 1D GCâTOF-MS, 1D GCâFID, GCÃGCâTOF-MS, and GCÃGCâFID using 100% graphite inlet ferrules.
Another problem with the conventional approach might be over-reliance on software-reported S/N values. From the authors' experience, some popular software packages used in GC×GC report S/N values that can be as much as an order of magnitude higher than the actual values determined from the chromatogram, leading to artificially low MDL values. The EPA procedure, on the other hand, is based on multiple measurements, and therefore it accounts for the increased variability of the response close to the MDL. If an analyte is detected according to the EPA procedure, there is a 99% probability that it is actually present in the sample (on the flip side, if it is not detected, there is still a 50% chance that it is present there). Consequently, we believe that the EPA procedure should be used whenever a method is characterized in terms of MDL.

Figure 3: GCÃGCâFID separation of 5 pg/µL n-C9 peak from the solvent tail (6 s modulation).
"Chemical" or "Chromatographic" Noise: The "chemical" or "chromatographic" noise in GC may result from a number of sources, such as the solvent tail and the column bleed. In this study, the solvent tail was created by using 100% graphite ferrules for the inlet. These ferrules are porous, and therefore they sorb the solvent during injection and release it during the GC run, causing solvent tailing (graphite acts as a "chemical sponge" causing a near-continuous release of the solvent during the run). Mixture 2 was composed of high boiling-point analytes that eluted with the column bleed at the end of the run. Vespel–graphite and SilTite inlet ferrules were used with mixture 2. To compare the sensitivity between 1D GC and GC×GC, the two mixtures were analysed using both approaches and applying the EPA-recommended method to calculate the MDLs. The limits of detection for TOF-MS were calculated using unique masses for each analyte to enhance the sensitivity. For n-C9, n-C10, and n-C12 the m/z was 71; 83 was selected for 3-octanol, 57 for n-C20, n-C22, and n-C24, and 202 for pyrene.
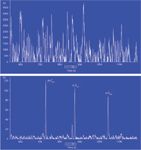
Figure 4: (a) Total ion current (TIC) of 100 pg/µL n-C20, n-C22, and n-C24; (b) m/z = 57 extracted ion chromatogram of 100 pg/µL n-C20, n-C22, and n-C24 using 1D GC.
Figure 1(a) shows the 1D GC total ion current (TIC) traces of 5 pg/µL and 80 pg/µL of n-C9, n-C10, and n-C12. Even using the extracted ion chromatogram at m/z = 71, the analytes were not detected at 5 pg/µL concentration levels within the high background noise levels of the solvent tail (Figure 1[b]). However, in GC×GC the analytes were detected at the 5 pg/µL concentration levels. The main reason was that the analytes were separated from the high background noise. This is illustrated in Figure 2, where the small n-C9 peak was separated from the solvent tail. The MDL values obtained in the experiments are shown in Table 2. The same scenario was then applied to the FID, which is a non-selective detector. Consequently, the selectivity and sensitivity enhancement through the use of extracted ions with MS was lost, making good chromatographic separation particularly important. This is illustrated in Figure 3, where the small peak of n-C9 was well separated from the solvent tail and could be detected at 5 pg/µL.

Table 3: MDL values of 1D GCâTOF-MS and GCÃGCâTOF-MS using vespelâgraphite and silTite inlet ferrules.
The second type of chromatographic noise is the temperature-induced column bleed. Figure 4(a) demonstrates the TIC trace of 100 pg/µL of n-C20, n-C22, and n-C24 using 1D GC. No distinct peaks of the analytes could be observed in this high background noise. One of the main advantages of TOF-MS is its selectivity. Therefore, by selecting the unique masses of the analytes, their peaks could be detected (Figure 4[b]). Despite the selectivity of the MS, MDLs of 1D GC were still higher than those of GC×GC (Table 3) because of a lack of band compression in the former technique.

Figure 5: GCÃGCâFID separation of n-C20, n-C22, and n -C24 from column bleed (6 s modulation).
A selective detector is an advantage in chromatography; however, not all laboratories can afford TOF-MS. In such cases, sensitivity is highly affected by the chromatographic separation efficiency. The analyte peaks of n-C20, n-C22 and n-C24 could be efficiently separated from the column bleed using GC×GC and detected using FID with much lower MDLs than in 1D GC (Figure 5 and Table 4). The effect of chromatographic separation can be clearly shown and explained in the separation of pyrene in mixture 2 from the column bleed. In Figure 6, the pyrene peak was wrapped around when a 2 s modulation period was used in GC×GC and coeluted with the column bleed. The selectivity of the TOF-MS could solve this problem by quantitation at m/z = 202, the unique mass of pyrene. The MDL was calculated and it was still much better than in 1D GC (Table 3). However, with the FID, the pyrene peak could not be separated from the noise (Figure 7). Therefore, MDLs of pyrene at 2 s and 4 s modulation could not be calculated. The only solution to this problem is the chromatographic separation of the pyrene peak from the column bleed, which can be achieved with GC×GC, but not with 1D GC. This is illustrated in Figure 8, where the pyrene peak was completely separated from the column bleed by increasing the modulation period to 6 s and could be detected with low MDLs (Table 4).

Figure 6: GCÃGCâTOF-MS separation of 15 pg/µL pyrene (PYN), 2 s modulation (m/z = 202).
The results shown in Tables 2, 3, and 4 show that MDLs increased somewhat with the increase in the number of modulations per peak (that is, the highest MDLs were obtained with 2 s modulation periods and the lowest MDLs with 8 s modulation periods). The results show that a 6- to 18-fold (for GC×GC–FID) and 6- to 13-fold (for GC×GC–TOF-MS) increase in sensitivity could be achieved when the first dimension peak was modulated into one or two second dimension peaks (8 s modulation). When the peaks were modulated three to four times (as in 2 s modulation), sensitivity improvements of 5- to 14-fold (for FID) and 5- to 9-fold (for TOF-MS) were achieved. These findings could be considered unexpected by some, as the differences in MDLs between 2 s and 8 s modulation periods were in fact small and not at all proportional to the differences in analyte mass delivered to the detector in a single second dimension peak. Common sense seems to dictate that a second dimension peak obtained at 8 s modulation period should be ~4 times taller than a peak obtained at 2 s modulation with virtually unchanged noise, hence the S/N ratio should be ~4 times higher. Consequently, one expects a 4-fold decrease in the MDL when looking at the S/N ratio only. However, this view is somewhat simplistic. As explained above, the MDL of any analytical method is determined not only by the value of the S/N ratio in a single experiment, but also by how reproducible it is in repeat experiments. This often ignored factor actually explains the findings of this study. With long modulation periods, a first dimension peak is sampled into only a few second dimension peaks. Small changes in modulation phase lead to significant variations in the heights of those peaks (and, consequently, large standard deviations of peak heights). On the other hand, with more frequent modulation, these variations become much less pronounced, and the standard deviations of peak heights decrease. Thus, while in general the S/N ratios were proportional to the length of the modulation period, the increased standard deviations of peak heights at longer modulation periods erased most of the gains in MDLs. Nevertheless, MDLs in GC×GC were still very good and significantly better than those in 1D GC.
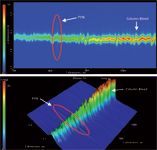
Figure 7: (a) Contour plot of GCÃGCâFID separation of 300 pg/µL pyrene (PYN), 4 s modulation; (b) Surface plot of GCÃGCâFID separation of 300 pg/µL pyrene (PYN), 4 s modulation.
The results for 3-octanol and pyrene indicated that sensitivity enhancement strongly depended on the second dimension retention time of the analyte. The increased retention times of both 3-octanol and pyrene, which eluted close to the end of the run, resulted in broader first dimension peaks that were sampled into more second dimension peaks, and thus in lower sensitivity gains compared to earlier eluting analytes.
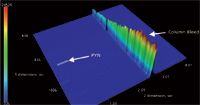
Figure 8: GCÃGCâFID separation of 15 pg/µL pyrene (PYN), 6 s modulation.
As has been mentioned by Blumberg (10), the noise in a GC system is composed of several types, such as detector and chemical noise. Detector noise is limited by the white noise, (14) therefore, it cannot be reduced below a certain limit. However, in reality it is the chemical noise that is the major contributor to the overall noise in any GC system. When the magnitude of the analyte peak becomes comparable to that of the background noise, the analyte peaks of interest begin to merge with the noise and can no longer be distinguished unless they can be chromatographically separated from that noise. Therefore, the practical limit in sensitivity is usually imposed by the chemical or chromatographic noise rather than the inherent sensitivity of the detector. The ability of GC×GC to separate the analytes from themselves and from the chromatographic noise is of utmost importance with complex mixtures. 1D GC MDL is directly influenced by any closely eluting interfering compounds or noise, and, in this case, GC×GC MDL enhancement becomes greater.

Table 4: MDL values of 1D GCâFID and GCÃGCâFID using vespelâgraphite and SilTite inlet ferrules.
Conclusions
The sensitivity of GC×GC was compared to that of 1D GC. Using an 8 s modulation period, GC×GC offered approximately an order of magnitude (on average) improvement in MDL. Electronic noise cannot be reduced below a certain limit, and is therefore a limiting factor for theoretical sensitivity improvements. However, this is not the case when chromatographic or chemical noise is the main contributor to overall noise. In such cases chromatographic separation strongly affects the MDL. The ability of GC×GC to produce peak isolation with true baseline is of significant importance with complex mixtures. MDL in 1D GC is directly affected by any closely eluting interferences (for example, other analytes, column bleed, and solvent tail). Since GC×GC offers a much better chance of separating the interferences, it can significantly enhance the MDLs. The gains, however, are not as great as would be expected from the theoretical S/N increase because of band compression by the modulator as a result of the increased variability of the individual peak heights in GC×GC caused by random shifts in the modulation phase. As a result, the MDL values for significantly different modulation periods change only slightly.
Acknowledgements
The authors thank the Natural Sciences and Engineering Research Council of Canada (NSERC) for the funding of this research.
Tadeusz Górecki is a professor at the Department of Chemistry, University of Waterloo (Ontario, Canada). He obtained his M.Sc. Engineer (1981) and PhD (1986) degrees from the Gdansk University of Technology, Poland, and his Professor of Chemical Sciences degree (2009) from the President of the Republic of Poland. Professor Górecki's scientific interests include comprehensive two-dimensional gas chromatography (GC×GC), passive sampling, enhanced extraction techniques, environmental analysis, field analysis, pyrolysis GC–MS, and HPLC. He is the author and co-author of 22 book chapters, over 140 peer-reviewed papers, nearly 240 conference contributions (including 41 invited lectures), and six patents.
Ahmed Mostafa received his PhD in Analytical Chemistry in 2012 from The University of Waterloo, Ontario, Canada. He was awarded his M.Sc. degree in Pharmaceutical Sciences in 2005 and his B.Sc. degree in Analytical Chemistry in 2000 from the Faculty of Pharmacy, Suez Canal University, Egypt. He is currently a visiting researcher in the Department of Chemistry at the University of Waterloo. His research interests include chromatographic techniques including HPLC, GC–MS, and GC×GC and their applications in the study of complex matrices, in addition to chemometrics and its application in pharmaceutical analysis. He is an author and co-author of over 40 papers, book chapters, and conference presentations.
References
(1) Z. Liu and J.B. Phillips, J. Chromatogr. Sci. 29(6), 227 (1991).
(2) A. Mostafa, M. Edwards, and T. Górecki, J. Chromatogr. A 1255, 38 (2012).
(3) W.J. Taraszewski, D.T. Haworth, and B.D. Pollard, Anal. Chim. Acta 157, 73 (1984).
(4) Z. Liu and J.B. Phillips, J. Microcolumn Sep. 6(3), 229 (1994).
(5) R.M. Kinghorn and P.J. Marriott, J. High Resolut. Chromatogr. 21(1), 32 (1998).
(6) P.J. Marriott and R.M. Kinghorn, J. Chromatogr. A 866(2), 203 (2000).
(7) H. De Geus, J. De Boer, J.B. Phillips, E.B. Ledford Jr., and U.A.T. Brinkman, J. High Resolut. Chromatogr. 21(7), 411 (1998).
(8) M. Habram and T. Welsch, J. High Resolut. Chromatogr. 22(6), 335 (1999).
(9) A.L. Lee, K.D. Bartle, and A.C. Lewis, Anal. Chem. 73(6), 1330 (2001).
(10) L.M. Blumberg, J. Chromatogr. A 985(1–2), 29 (2003).
(11) S.E. Reichenbach, M. Ni, D. Zhang, and E.B. Ledford, J. Chromatogr. A 985(1–2), 47 (2003).
(12) U.S. Environmental Protection Agency, Part 136, Appendix B, Revision 1.11, at http://www.gpo.gov/fdsys/pkg/CFR-2012-title40-vol24/pdf/CFR-2012-title40-vol24-part136-appB.pdf/, accessed 10 July 2013.
(13) J. Harynuk and T. Górecki, J. Chromatogr. A 1019, 53 (2003).
(14) A. Papoulis, Probability, Random Variables, and Stochastic Processes (McGraw-Hill, New York, USA, 1965).

New Study Reviews Chromatography Methods for Flavonoid Analysis
April 21st 2025Flavonoids are widely used metabolites that carry out various functions in different industries, such as food and cosmetics. Detecting, separating, and quantifying them in fruit species can be a complicated process.
University of Rouen-Normandy Scientists Explore Eco-Friendly Sampling Approach for GC-HRMS
April 17th 2025Root exudates—substances secreted by living plant roots—are challenging to sample, as they are typically extracted using artificial devices and can vary widely in both quantity and composition across plant species.
Sorbonne Researchers Develop Miniaturized GC Detector for VOC Analysis
April 16th 2025A team of scientists from the Paris university developed and optimized MAVERIC, a miniaturized and autonomous gas chromatography (GC) system coupled to a nano-gravimetric detector (NGD) based on a NEMS (nano-electromechanical-system) resonator.
Miniaturized GC–MS Method for BVOC Analysis of Spanish Trees
April 16th 2025University of Valladolid scientists used a miniaturized method for analyzing biogenic volatile organic compounds (BVOCs) emitted by tree species, using headspace solid-phase microextraction coupled with gas chromatography and quadrupole time-of-flight mass spectrometry (HS-SPME-GC–QTOF-MS) has been developed.


