Selectivity in Reversed-Phase Liquid Chromatography: 20 Years of the Hydrophobic Subtraction Model
LCGC North America
The hydrophobic subtraction model has been very successful. Nevertheless, the accompanying public database, which has parameters for 750 commercially available columns, is an underutilized column characterization tool. Here is some guidance on how to use both the model and the free database.
How can I use the hydrophobic subtraction model of reversed-phase selectivity to help me in method development? A recent Pittcon symposium discussed the history and practical use of the model, as well as insights into recent research that may enable expanded use of the model in the future.
For the 2020 edition of the Pittsburgh Conference (Pittcon) held in early March in Chicago, Professor Joe Foley of Drexel University organized a symposium entitled “To Selectivity and Beyond: Celebrating 18 Years of the Hydrophobic Subtraction Model.” It has been roughly 20 years since Lloyd Snyder, John Dolan, Peter Carr, and coworkers began work on what has become known as the hydrophobic subtraction (HS) model of selectivity for reversed-phase liquid chromatography columns. In my view, this model, and the accompanying public database of parameters for 750 commercially available columns, has been remarkably successful, and this Pittcon symposium aimed to both discuss the impact of the model on contemporary method development, and provide some insights from recent research on the use of the model going forward. Choosing a column is an important decision, not only at the beginning of method development, but also for the analytical life cycle of a method. In this installment of “LC Troubleshooting,” I first review the basic premise and features of the HS model and the column database, and then touch on highlights of the talks presented as part of the Pittcon symposium. From my point of view, and I think the other contributors to the symposium would agree, the HS model database is a column characterization tool that is underutilized by the LC community, in spite of the fact that it is a free resource. Users can leverage the database to supplement information available from suppliers, and become more familiar with their columns. Separation performance can improve by locating and evaluating more than one column to optimize selectivity, and one can quickly locate replacement columns if problems develop. I hope that symposia like the one at Pittcon can both help other users understand how the model can benefit their work, and promote discussion about how we can improve this and other resources as we work into the future.
Basics of the Hydrophobic Subtraction Model of Reversed-Phase Selectivity
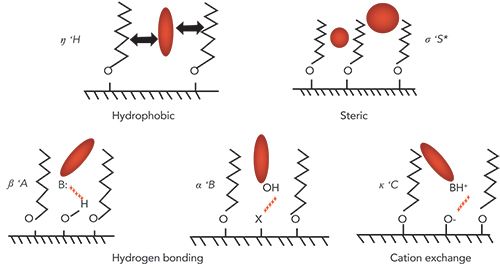
The basic principle of the HS model was first described in a journal article by Snyder and coworkers in 2002 (1). Since then, many articles have been published on the topic, but two resources are particularly noteworthy for readers interested in learning more about the model. First, in 2012, Snyder and coworkers published a book chapter in Advances in Chromatography that is still the most comprehensive discussion of the model and its application that has been published to date (2). Second, a more recent article in LCGC provides more of an overview of the model and its application that may be an easier place to start for those that are completely new to the idea (3). The model, which was originally developed using retention data from alkyl phases (such as C4, C8, and C18) bonded to high purity type B silicas, assumes that reversed-phase selectivity (defined here as the ratio of retention factors for a compound of interest, and ethylbenzene) can be described using the sum of five pairs of column and solute parameters that are related to different physicochemical interactions between solutes and the reversed-phase stationary phase. A view of the nature of each of these interactions is shown in Figure 1.
Figure 1: Conceptual illustration of the five major

The mathematical expression of the model is shown in equation 1, where the capital Roman letters H, S*, A, B, and C are column parameters, and the Greek small letters η, σ, β, α, and κ are solute parameters:

[1]
The column parameters are determined experimentally by measuring the retention times of 16 carefully chosen probe solutes in a mobile phase composed of acetonitrile and potassium phosphate buffer at pH 2.8, calculating the selectivity value for each compound (k/kEB), and regressing those selectivities against the known solute parameters for the probe compounds (2). To date, parameters for 750 commercially available columns have been determined, and are publicly available for free through two websites: 1) a site maintained by the U.S. Pharmacopoeia (https://apps.usp.org/app/USPNF/columnsDB.html); and 2) a site maintained by my research group (www.hplccolumns.org). The two primary uses of this database are finding columns that have similar selectivities (for example, for identifying a backup column during method development), and finding columns that very different selectivities (for example, for identifying a set of columns to screen during method development). These applications will be discussed in more detail in the next sections.
Overview of the Symposium
The Pittcon symposium was composed of five podium presentations:
- Prof. Dwight Stoll (Gustavus Adolphus College) reviewed the early history of the development of the HS model, its physico-chemical basis, and shared some insights from analysis of the selectivities of reversed-phase columns recently introduced to database.
- Dr. Richard Henry (independent consultant) discussed use of the column parameters database from a practical perspective, with an emphasis on tools that can leverage the database to identify equivalent columns.
- Dr. John Dolan (LC Resources) discussed recent efforts by himself, Paul Haddad, and coworkers to predict retention times in reversed-phase LC (and other modes) starting from physicochemical descriptors of solutes of interest.
- Dr. Tony Taylor (Arch Sciences Group) discussed a recent study aimed at a retrospective refinement of the HS model, and the potential for a refined model to be used for retention prediction in reversed-phase LC.
- Prof. Joe Foley (Drexel University) described recent efforts by his research group to use the HS model to demonstrate the advantages of serially coupled columns from the HS model database, and ultimately predict which pairwise combinations of columns might yield the best separations of different mixtures of real or synthetic solutes.
Use of the HS Model for Column Selection During Method Development
In the early stages of method development, it is common practice to choose a diverse set of stationary phases that can be screened to identify candidate phases that exhibit the selectivity needed to separate the analyte mixture at hand (4). In this case, the HS model database can be used to identify a set of columns with sufficient diversity to be useful in this regard. Later in method development, when a leading candidate column has been identified and the method is refined prior to validation, it is also common to try to identify other columns with very similar, even “equivalent,” selectivity such that this column can be used as a drop-in replacement in the event that the manufacturer of the primary column stops making it, or has trouble manufacturing the column reproducibly. Here again, the HS model database can be used for this purpose, by generating a short list of columns to evaluate experimentally and assess their similarity to the primary column. For both of these purposes Snyder and coworkers advocated for the use of a “similarity factor, FS,” which is a weighted distance between two columns in five-dimensional column parameter space. While this might sound complicated, calculating FS is very straightforward, as shown in equation 2, where H1 and H2 are the H parameters for the first and second columns in the comparison, and so-on.

[2]
The weighting factors χH, χS*, and so on are user-adjustable parameters in the calculation, but usually taken as 12.5, 100, 30, 143, and 83 for H, S*, A, B, and C, respectively (2). Both of the web-based tools cited above do this FS calculation for you, and facilitate sorting the database to identify columns that are similar, or different, compared to a target column you specify.
In his presentation, Henry emphasized the point that the task of identifying columns with similar selectivities has become more difficult over the past two decades, as the stationary phase offerings from manufacturers have become more diverse. The L-code system of the United States Pharmacopoeia is based on stationary phase types such as “C18” and “phenyl,” and compendial methods specify columns from a particular phase type. However, stationary phases with mixed chemistries are becoming more and more common (for example, phenyl-hexyl is a mixed chemistry phase with both aromatic and alkyl components), and increasingly we are coming to understand that the properties of the underlying silica substrate (for example, metal impurities, and specific synthetic methods) can have a significant effect on selectivity, particularly for complex solutes with many different types of functional groups. The net effect is that, when exploring the HS model database, it is possible to find that the column most similar to a target column of interest as measured by FS belongs to a different phase type. On one hand, this means that we should be somewhat open-minded when scouting for similar columns, but, on the other hand, this creates challenges when identifying columns that can be used as replacements in a regulated environment.
Recent Efforts to Predict Reversed-Phase Retention Using the HS Model
In the process of establishing the HS model 20 years ago, it was demonstrated that the model described by equation 1 could accurately reproduce the retention factors of about 90 solutes obtained for 10 different alkyl stationary phases based on high purity type B silicas with an accuracy of about 2% (1). Since the large database of column parameters already exists, it is logical to think about using the model and the database to predict retention for new analytes that are not represented in the set of solutes used to establish the model initially. However, this requires determination of the solute parameters to use the model (equation 1) for this purpose, and doing so experimentally is currently quite time- and resource-intensive. In his presentation, Dolan gave a summary of work by Paul Haddad, his group at the Australian Centre for Research on Separation Science (ACROSS), and other collaborators in recent years to predict HS model solute parameters from chemical structure that could in turn be used to predict reversed-phase retention via the HS model. Readers interested in learning more about these efforts are referred to recent articles in LCGC and other publications where the details of the work are discussed (5,6). Briefly, Haddad and coworkers explored the use of computationally derived molecular descriptors produced by programs such as VolSurf+, and different approaches to constructing local and global models, and evaluated their effects on reversed-phase retention prediction. Again, the basic premise here is that one would take the chemical structures for analytes they are trying to separate, calculate molecular descriptors based on those structures (for example, log D, polar surface area, and so forth), then calculate HS model solute parameters based on those descriptors, and finally calculate retention factors for those compounds using equation 1 and the column parameters from the HS model database. In principle, all of this could be done without doing a single laboratory experiment. Dolan reported that using molecular descriptors to calculate the η’ parameter alone (equation 1) for each solute was sufficient to make retention time predictions that were accurate to within 30 s for 70% of the 146 solutes evaluated in their study (5). Although this obviously leaves room for improvement in the future, this kind of work should capture the imagination of research groups around the globe to improve these modeling and retention prediction efforts.
Recent Additions to the Public Database of Reversed-Phase Column Parameters
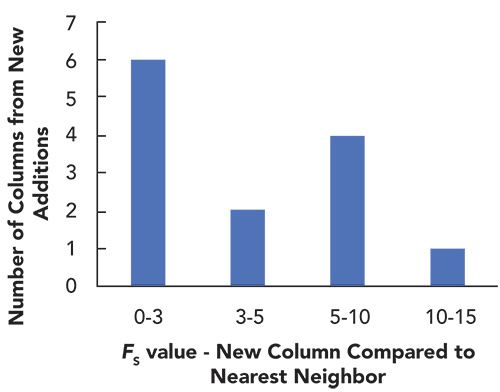
In March of this year, we added 13 new columns (from three different vendors) to the HS model database, bringing the total number of columns in the dataset to 750. Whenever we make these additions, I am always curious to know what is being added; redundancy in selectivity, or unique selectivities? I don’t know the motivations of the manufacturers of these new columns, but, of course, there is value in both types of additions. It is helpful to have the redundancy in the selectivities of column offerings to have a backup column to use, in case there is some problem with the supply of the column of first choice. On the other hand, LC users are always interested in new selectivities that might be able to solve their challenging separation problems. Figure 2 shows the FS values obtained from a comparison of each new column to its nearest neighbor (in selectivity space) in the database prior to the most recent additions. From these values, we see that 6 of the 13 new additions are equivalent to some other column already in the database (FS < 3). Of the other seven, two of them are very similar to existing phases (3 < FS < 5), and only one of them has a nearest neighbor with an FS > 10, which we might consider somewhat unique. Here again, the HS model is useful for assessing the characteristics of commercial offerings as these continue to grow. New additions to the database have grown at a remarkably consistent pace of about two to three columns per month over the last ten years!
Figure 2: Distribution of FS values from comparisons of each new column added to the HS model database and its nearest neighbor in the database prior to the new additions.

Summary
In this installment of “LC Troubleshooting,” I have reviewed the basic concept of the hydrophobic subtraction model of reversed-phase selectivity for liquid chromatography, and summarized some highlights from a recent Pittcon symposium organized to celebrate the success of the model over the last two decades. I encourage readers who are unfamiliar with the model to consider how it might benefit method development work, and I think we can all look forward to further development as research groups continue to refine the model and expand its scope of application.
Acknowledgement
I want to thank Dick Henry, Joe Foley, John Dolan, and Tony Taylor for reviewing the manuscript for this article and providing helpful feedback.
References
- N.S. Wilson, M.D. Nelson, J.W. Dolan, L.R. Snyder, R.G. Wolcott, and P.W. Carr, J. Chromatogr. A 961, 171–193 (2002). https://doi.org/10.1016/S0021-9673(02)00659-3.
- L.R. Snyder, J.W. Dolan, D.H. Marchand, and P.W. Carr, “The Hydrophobic-Subtraction Model of Reversed-Phase Column Selectivity,” in Advances in Chromatography (CRC Press, Boca Raton, Florida, 2012), pp. 297–376.
- J.W. Dolan and L.R. Snyder, LCGC North Am.34(9), 730–741 (2016).
- K.M. Biswas, B.C. Castle, B.A. Olsen, D.S. Risley, M.J. Skibic, and P.B. Wright, J. Pharm. Biomed. Anal.49, 692–701 (2009). https://doi.org/10.1016/j.jpba.2008.12.039.
- Y. Wen, M. Talebi, R.I.J. Amos, R. Szucs, J.W. Dolan, C.A. Pohl, and P.R. Haddad, J. Chromatogr. A1541, 1–11 (2018). https://doi.org/10.1016/j.chroma.2018.01.053.
- P.R. Haddad, LCGC North Am. 35(8), (2017) 499–502 (2017).

Dwight R. Stoll is the editor of “LC Troubleshooting.” Stoll is a professor and the co-chair of chemistry at Gustavus Adolphus College in St. Peter, Minnesota. His primary research focus is the development of 2D-LC for both targeted and untargeted analyses. He has authored or coauthored more than 60 peer-reviewed publications and four book chapters in separation science and more than 100 conference presentations. He is also a member of LCGC’s editorial advisory board. Direct correspondence to: LCGCedit@mmhgroup.com

Polysorbate Quantification and Degradation Analysis via LC and Charged Aerosol Detection
April 9th 2025Scientists from ThermoFisher Scientific published a review article in the Journal of Chromatography A that provided an overview of HPLC analysis using charged aerosol detection can help with polysorbate quantification.
Removing Double-Stranded RNA Impurities Using Chromatography
April 8th 2025Researchers from Agency for Science, Technology and Research in Singapore recently published a review article exploring how chromatography can be used to remove double-stranded RNA impurities during mRNA therapeutics production.


