Seeing is Believing: Detectors for HPLC
LCGC North America
The principles and attributes of today's HPLC detectors are discussed, and the advantages and disadvantages of the various detectors are compared and contrasted.
In the early days of high performance liquid chromatography (HPLC), detection for qualitative or quantitative analyses often was carried out by collecting fractions and analyzing them off-line using gravimetric or wet chemical techniques. It wasn't until the 1940s and 1950s that the first online detectors for liquid chromatography, the refractive index (RI), and conductivity detectors appeared on the scene (3, 4), and while they were certainly an improvement over off-line approaches, neither detector was particularly sensitive. The search for more sensitive universal detectors for HPLC (much like flame ionization detection [FID] for gas chromatography [GC]) over the years led researchers to adapt GC detectors for use in HPLC (5–8), but the removal of the HPLC mobile phase through evaporation originally limited any real applicability. However, in the 1960s, the first ultraviolet (UV) detector for HPLC was introduced (9), and subsequent improvements in design led to better sensitivity (10) and improvements such as variable wavelength and diode array UV detectors. While a truly universal HPLC detector with the kind of sensitivity achieved in GC–FID is still elusive, many different types of detectors have been developed since the early UV, RI, and conductivity detectors that have been very successful for a wide variety of general or specific HPLC applications.

Michael Swartz
Detectors for HPLC are designed to take advantage of some physical or chemical attribute of either the solute or mobile phase in the chromatographic process in one of four ways (2):
- A bulk property or differential measurement
- Analyte specific properties
- Mobile phase modification
- Hyphenated techniques
Bulk property detectors are the most universal detectors for HPLC as they measure properties common to all analytes by measuring differences in the mobile phase with and without the sample. One of the most common bulk property detectors is the RI detector. Given the universal nature of bulk property detectors, they respond to all analytes, placing more emphasis on the selectivity of the chromatographic column. They are, however, inherently somewhat limited in sensitivity because they are the chromatographic equivalent of determining the weight of a sailor by weighing the battleship before and after the sailor departs for shore leave.
Analyte-specific property detectors respond to a characteristic that is unique to an analyte. The UV detector is the most common example of an analyte-specific property detector, responding to analytes that absorb UV light at a particular wavelength. UV detectors are usually thought of as somewhat specific, responding only to compounds with chromophores, but at low UV wavelengths (<210 nm), where just about every organic compounds absorb, UV detectors are actually somewhat universal. Other analyte specific detectors include fluorescence, conductivity, and electrochemical.
Mobile phase modification detectors change the mobile phase postcolumn to induce a change in the properties of the analyte — for example, by creating particles suspended in a gas phase. Evaporative light scattering and corona discharge detectors fit into this category. Pre- or postcolumn derivatization of the analyte also is considered to fit into this category.
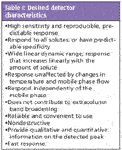
Table I: Desired detectorcharacteristics
Hyphenated techniques refer to the coupling of a separate independent analytical technology to an HPLC system. The most common is mass spectrometry (LC–MS), and technologies such as infrared spectrometry (LC–IR) and nuclear magnetic resonance (LC–NMR) also have been used. While it can be argued that MS is seeing more and more use as a routine HPLC detector, good reviews of its use as well as other hyphenated techniques are available and can be consulted for more information (11–13).
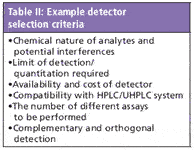
Table II: Example detector selection criteria
There are many characteristics to consider when choosing a detector, and Table I lists some of them. For additional details on many of the HPLC detectors addressed here, the reader is encouraged to consult the references in each individual section along with additional general reviews (14–16).

Table III: Common HPLC detector properties
Because no one detector has all of these characteristics, over time, a multitude of detectors have been designed, produced, and sold to answer one particular challenge or another. Ease of use, predictability, and reproducibility are all very important characteristics, however, recently, there has been an increased emphasis on the flow-cell contribution to band broadening and faster detector responses. This emphasis is due to new, low dispersion ultrahigh-pressure liquid chromatography (UHPLC) systems designed to take full advantage of sub-2-µm particle size column packings (17,18). A common rule of thumb says that for good peak integration, a minimum of 20 points should be collected across the peak. With the chromatographic efficiency of sub-2-µm particle size column packings often resulting in peaks that are less than 1-s wide, faster data rates are required to maintain good integration, sensitivity, and resolution. Narrower peaks also will require smaller volume detector flow cells to maintain peak concentration, and this lower dispersion shouldn't come at a loss of signal. Many detectors, including UV, photodiode-array (PDA), fluorescence, evaporative light scattering, and charged aerosol detectors are available commercially in both HPLC and UHPLC version depending upon the application. Some additional considerations to be made when selecting a detector are summarized in Table II. Most of the considerations in Table II are relatively straightforward; however, the use of complementary or orthogonal detectors used in combinations (series or parallel, depending upon back pressure limitations and whether or not they are destructive) should be noted as it is gaining in popularity, particularly in drug discovery or other screening-type applications. Table III lists some properties of the common HPLC detectors in use today, and a summary of some of their key attributes is presented in Table IV.
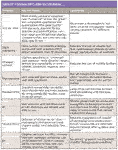
Table IV: Common HPLC detector attributes
UV–Visible Detectors
The UV–vis absorbance detector is the most common HPLC detector in use today because many compounds of interest absorb in the UV (or visible) region (from 190 to 600 nm). Sample concentration, output as absorbance, is determined by the fraction of light transmitted through the detector cell by Beer's law:

where A is absorbance, I0 is the incident light intensity, I is the intensity of the transmitted light, ε is the molar extinction coefficient of the sample, b is the pathlength of the cell in centimeters, and c is the molar sample concentration. UV absorbance occurs as a result of the transition of electrons from π→π*, n→π*, or n→σ* molecular orbitals; most aromatic compounds absorb strongly at or below 260 nm, compounds with one or more double bonds (for example. carbonyls and olefins) at ~215 nm, and aliphatic compounds at ~205 nm (19,20). Mobile phase solvent and buffer selection is also important for optimum UV sensitivity and linearity; UV cutoffs (the wavelength at which the solvent absorbs) become particularly significant at low wavelengths.
There are three different types of UV detectors: fixed-wavelength detectors that rely upon distinct wavelengths, and variable-wavelength and photodiode-array detectors that rely upon one or more wavelengths generated from a broad spectrum lamp. Fixed-wavelength detectors, the backbone of early HPLC systems, are cheap and simple, but are in limited use today. The most common fixed wavelength detectors use the 254-nm output from a low-pressure mercury lamp, the reason many variable-wavelength and photodiode-array applications today still use this wavelength out of sheer habit.
Variable wavelength detectors can be tuned to operate at the absorbance maximum of an analyte or at a wavelength that provides more selectivity. They can also be programmed to change wavelengths during a chromatographic run to compensate for response of different analytes. In a variable-wavelength detector, light from a broad-spectrum (for UV deuterium is common, tungsten for visible) lamp is directed through a slit to a diffraction grating that spreads the light out into its constituent wavelengths. The grating is then rotated to direct a single wavelength of light through a slit, through the detector cell, to a photodiode.
Photodiode-array detectors have an optical path similar to variable-wavelength detectors except the light passes through the flow cell before hitting the grating, allowing it to spread the spectrum across an array of photodiodes. Z-path or tapered detector cells designs are commonly used in most UV detectors for HPLC. Using a 100 mm × 4.6 mm column (3-µm particle size) detector cell volumes of 8–10 µL are required (for example, 1-mm diameter, 10-mm pathlength). An 8-µL flow-cell volume can lead to unacceptable extracolumn band broadening using smaller column diameters and particle sizes, however, reducing the path length to decrease extracolumn volume will decrease the signal. In addition, early PDA detectors were not as sensitive as single-wavelength UV, but the gap has been closing in recent years thanks to new detector cell technology of the type in use in some detectors today, as illustrated in Figure 1.
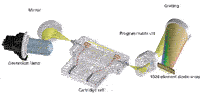
Figure 1: Schematic representation of a light guided total internal reflectance detector flow cell. (Figure courtesy of Agilent Corporation.)
This new detector cell type consists of a light-guided flow cell equivalent to an optical fiber. Light is transferred efficiently down the flow cell through a noncoated fused-silica fiber in an internal reflectance mode that maintains a long flow-cell pathlength with a low volume; extending the pathlength while maintaining low dispersion. Light-guided flow cells are particularly useful in maintaining low dispersion in UHPLC systems while providing increased sensitivity, as shown in Figure 2.
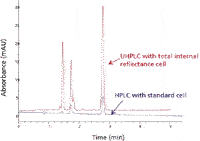
Figure 2: Detector cell sensitivity comparison. An increase in signal-to-noise ratio of over 11 was obtained using UHPLC and the total internal reflectance detector cell versus the standard HPLC cell. Column: 150 mm à 4.6 mm, 5-µm Zorbax SB C18 (Agilent Corporation); mobile phase: 20:80 waterâacetonitrile; flow rate: 1.5 mL/min; sample: 5 µL injection of anthracene (835 pg/µL); detection: PDA (251/4 nm, Ref = 450/80 nm, 2.5Hz, slit width 4 nm). (Figure courtesy of Agilent Corporation.)
PDA detectors extend the utility of UV detection by providing spectra of eluted peaks that can be used to aid in peak identification, and to monitor for coelutions, helpful during method development. They can also serve as a multiwavelength UV–vis detector. The spectra collected at the chromatographic peak apex can be used to create a library that can in turn be used to compare subsequent spectra for identification purposes, and spectra collected across the peak at each data point can be compared to evaluate peak homogeneity or purity.
Fluorescence Detectors
Fluorescence detectors measure the optical emission of light by solute molecules after they have been excited at a higher energy wavelength, and they can be very sensitive for compounds that have native fluorescence or that can be made to fluoresce through derivatization (13). Schematically, they resemble UV detectors, except that the grating is replaced by a filter or monochromator at a right angle to the incident light to simplify the optics and reduce background noise. The light source is usually a broad spectrum deuterium or xenon flash lamp. The excitation wavelength (often close to the UV λmax) is selected by a filter or monochromator between the lamp and the flow cell, always at a higher energy (lower wavelength) than the emission wavelength. Laser-induced fluorescence (LIF) detectors using lasers as the excitation source are sometimes used in micro- or capillary-LC systems in which the higher energy of the laser provides better sensitivity in the small diameter flow cells necessary to limit dispersion.

Figure 3: Example of fluorescence detection for the UHPLC analysis of a series of polycyclic aromatics. Column: 50 mm à 4.6 mm, 3-µm SUPELCOSIL LC-PAH; temperature: 40 °C; mobile phase A: water, B: acetonitrile; gradient: 50% B (0â0.5 min), 50â88% B (0.5â3.0 min), 88% B (3.0â4.2 min), 100% B (4.21â4.5 min), 50% B (4.51â5.0 min); flow rate: 3.0 mL/min; excitation/emission wavelengths switched in each interval as follows: A, 270-nm excitation wavelength, 330-nm emission wavelength; B, 250-nm excitation wavelength, 370-nm emission wavelength; C, 330-nm excitation wavelength, 430-nm emission wavelength; D, 270-nm excitation wavelength, 390-nm emission wavelength; E, 290-nm excitation wavelength, 430-nm emission wavelength; F, 370-nm excitation wavelength, 460-nm emission wavelength; G, 270-nm excitation wavelength, 330-nm emission wavelength. (Figure courtesy of Shimadzu Corporation.)
Fluorescence detectors can be as much as 100× more sensitive than a UV detector, making them particularl useful for trace analyses, or in sample-limited or low-concentration sample situations. An example application of fluorescence detection for the UHPLC analysis of a series of polycyclic aromatics is shown in Figure 3. While the dynamic range (the range over which a change in sample concentration produces a change in the detector output) of fluorescence detectors is relatively large (Table I), the linear dynamic range is often smaller for many analytes. Care should be taken to select and care for mobile phase components properly, as some buffers or solvents can cause background fluorescence, and solvents that are not properly degassed can lead to quenching, both affecting sensitivity
Electrochemical Detectors
For compounds that can be oxidized or reduced, the electrochemical (EC) detector is one of the most sensitive and selective HPLC detectors available (21,22). EC detectors require the use of electrically conductive HPLC mobile phases (buffers suffice), and when properly used and maintained are the standard bearer when it comes to response levels for the HPLC analysis of compounds such as catecholamines and neurotransmitters. EC detectors for HPLC usually contain three separate electrodes: a working, a counter (auxiliary), and a reference electrode. Common electrode materials are carbon, gold, silver, or platinum. A fixed-potential difference is applied between the working electrode and the reference electrode to drive an electrochemical reaction at the working electrode's surface. Current produced from the electrochemical reaction as compounds are oxidized or reduced at the working electrode is balanced by a current flowing in the opposite direction at the counter electrode. The EC detector response output is the amplified current resulting from the electrochemical reaction at the working electrode.
Amperometric EC detectors use disk-type thin-layer electrodes operated at a constant potential. They exhibit low conversion efficiencies due to diffusion limitations and are only capable of measuring 5–10% of an electrochemically reactive analytes; however, in spite of the low conversion efficiencies they are still quite sensitive. Amperometric EC detectors can be run in a pulsed mode (referred to as pulsed amperometric detection, or PAD), in which a cycled potential is used to clean and restore the electrode surfaces several times per second prior to measuring the signal output. PAD is the detection method of choice when sensitive carbohydrate measurements are required.
Coulametric EC detectors overcome the limited conversion efficiencies of the amperometric detectors by using a flow-through "frit"-type porous graphite working electrode. They exhibit near 100% conversion efficiencies for electrochemically reactive species. Because of the higher conversion efficiency, coulametric EC detectors are more sensitive and robust than their amperometric counterparts and still have the flexibility to operate in amperometric, pulsed-amperometric, and cyclic voltammetry modes in addition to coulametric.
Radioactivity Detectors
Radioactivity detectors (sometimes referred to as radiometric or radio-flow detectors) are used to measure radioactive analytes as they are eluted from the HPLC column. Most radioactivity detectors are based on liquid scintillation technology to detect phosphors caused by the radioactive nuclides, such as low-energy β-emitters (for example, 35S, 14C, 3H, and 32P) or stronger α-, β-, and γ-emitters (for example, 131I, 210Po, and 125Sb); tritium and 14C being the most common. A liquid scintillator can be added postcolumn (called homogeneous operation) or the flow cell can be packed with beads of a permanent, solid-state scintillator (heterogeneous operation). The radioactivity detector can be very sensitive, and is extremely useful for the detection of radiolabeled compounds in toxicological, metabolism, or degradation studies. Large flow-cell volumes typically are used in radioactivity detectors to increase analyte residence time, which increases the number of radioactive decays that can be detected. Peak tailing and broadening caused by the larger cell volume can be minimized by using larger volume columns assuming that sufficient sample is available for larger mass injections to compensate for on column dilution. The use of large cell, column, and injection volumes generally limits radiochemical detector use in UHPLC.
Conductivity Detection
The conductivity detector is a bulk property detector that measures the conductivity of the mobile phase. Conductivity detectors are the detector of choice for ion chromatography or ion-exchange separations when the analyte does not have a UV chromophore (23,24). In a conductivity detector, the resistance (or strictly the impedance) between two electrodes in the flow cell is measured. For many applications, particularly ion chromatography, in which conductive buffers are required in the mobile phase, a suppressor column is used postanalytical column (before the detector) to reduce the background conductance of the mobile phase.
Chemiluminescent Nitrogen Detector
The chemiluminescent nitrogen detector is an element specific detector in which the column effluent is nebulized with oxygen and a carrier gas of argon or helium and pyrolyzed at 1050 °C (25–27). Nitrogen containing compounds (except N2) are oxidized to nitric oxide, which is then mixed with ozone to form nitrogen dioxide in the excited state. The nitrogen dioxide decays to the ground state with the release of a photon, which is detected by a photometer. The resultant signal is directly proportional to the amount of nitrogen in the original analyte. Because of this relationship, it is possible to calibrate the response with any compound with known nitrogen content, and quantitate the nitrogen content of unknown analytes. Care must be taken in choosing nitrogen-free mobile phase components and additives (for example, no acetonitrile!).
Chiral Detectors
Many compounds, particularly drugs, exist in enantiomeric forms that can possess significantly different pharmacological properties, and chromatographic separation of enantiomers can be complimented by the use of detectors capable of responding to the different chiral forms. Chiral detectors in flow cell form essentially mimic their bench top counterparts; polarimeters, optical rotary dispersion (ORD), and circular dichroism (CD) detectors (28). Polarimeters measure the degree of rotation of polarized light as it passes through the sample. The amount of rotation is dependant upon both the concentration and molecular structure of the analyte. ORD detectors operate quite similar to polarimeters but at lower wavelengths. CD detectors measure the difference in absorption of right and left circularly polarized light as an analyte flows through the detector cell. Chromophores with absorption in the 200–420 nm range yield the best responses. CD detectors typically have proven to be the most sensitive. One additional chiral detector note: detector response can yield both positive and negative peaks relative to a normal baseline, a requirement that should be kept in mind when considering chromatography data system (CDS) software.
Refractive Index Detection
The refractive index detector is a universal bulk property detector, and is the original, oldest LC detector. RI detectors measure the difference in optical refractive index between mobile phase and the sample; no chromophore on the solute molecule is required. For this reason, RI detection has been used very successfully for the analysis of sugars, triglycerides, and organic acids. The most common RI detector design is the deflection refractometer where the light from a tungsten source lamp is directed through a pair of wedge-shaped flow cells, (reference and sample). The reference cell contains trapped or static mobile phase and the column effluent is sent through the sample cell. As the light passes through the two detector cells it is refracted differently, measured by a pair of photodiodes that convert the signal to a measurable output voltage. Modern RI detectors use thermostatted flow cells due to the susceptibility of RI measurements to temperature fluctuations. Once a chromatographic mainstay, and still used in many gel-permeation chromatography applications, RI detection is being replaced in many applications by light scattering or corona discharge detectors due to its limited sensitivity and gradient incompatibility.
Light-Scattering Detectors
Recent improvements in the ability to efficiently nebulize an HPLC column effluent has lead to increased utility of light-scattering detectors. The most popular detection method of this type is evaporative light scattering detection (ELSD). ELSD works on the principle of evaporation (nebulization) of the mobile phase followed by measurement of the light scattered by the resulting particles. The column effluent is nebulized in a stream of nitrogen or air carrier gas in a heated drift tube, and any nonvolatile particles are left suspended in the gas stream. Light scattered by the particles is detected by a photocell mounted at an angle to the incident light beam. Carrier gas flow rate and drift-tube temperature must be adjusted for whatever mobile phase is used. Detector response is related to the absolute quantity of analyte present, and while decreased sensitivity will be obtained for volatile analytes, unlike the UV detector, no chromophores are required and it has orders of magnitude more response than the RI detector. ELSD also has the advantage over RI detection in that the response is independent of the solvent, so it can be used with gradients, and is not sensitive to temperature or flow rate fluctuations. Mobile phases of course must be volatile, similar to those used for MS detection. Linearity can be limited in some applications, but is certainly quantitative over a wide enough range if properly calibrated. Recent applications of ELSD also have been extended to UHPLC.
Condensation nucleation light scattering detection (CNLSD) is another form of light scattering detection that is used in the same type of applications suited for ELSD. In CNLSD, following evaporation of the mobile phase, a saturated stream of solvent is added to the particles in the carrier gas. The particles form condensation nuclei and the solvent condenses onto the particles, increasing their size to where they are more easily detected in the light path (29). Due to the increase particle size, CNLSD can be 10–100-fold more sensitive than ELSD, with a wider linear range.
Laser light scattering detection (LLSD), also called multiangle light scattering (MALS) refer to light scattering detectors that make measurements in solution as opposed to particles suspended in a gas. LLSD systems use a laser light source and measure scattered light from the sample as it moves through the detector flow cell. The scattered light is measured at multiple (for example, 3–18) angles, and using the proper mathematical transformations, the mass of an analyte can be determined without the use of reference standards. LLSD is particularly useful in size-exclusion chromatography for the determination of the molecular weights of polymers or biological molecules.
Charged-Aerosol Detection
Corona charged aerosol detection (CAD) is a unique technology gaining in popularity in which the HPLC column eluent is first nebulized with a nitrogen (or air) carrier gas to form droplets that are then dried to remove mobile phase, producing analyte particles (30,31). The primary stream of analyte particles is met by a secondary stream of nitrogen (or air) that is positively charged as a result of having passed a high-voltage, platinum corona wire. The charge transfers diffusionally to the opposing stream of analyte particles, and is further transferred to a collector where it is measured by a highly sensitive electrometer, generating a signal in direct proportion to the quantity of analyte present.
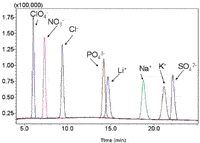
Figure 4: Simultaneous analysis of anions and cations using hydrophilic interaction liquid chromatography with CAD. Column: 150 mm à 4.6 mm, 5-µm Sequant ZIC-pHILIC (The Nest Group, Southborough, Massachusetts); temperature: 30 °C; mobile phase A: 15% 100 mM ammonium acetate (pH 4.68), 5% methanol, 20% isopropanol, 60% acetonitrile; mobile phase B: 50% 30 mM ammonium acetate (pH 4.68), 5% methanol, 20% isopropanol, 25% acetonitrile; gradient: 20â70% B over 26 min; flow rate: 0.5 mL/min; injection: 10 µL.
Because the entire process involves particles and direct measurement of charge, CAD is highly sensitive, provides a consistent response, and has a broad dynamic range, which offers advantages when analyzing compounds lacking UV chromophores, as illustrated in Figure 4. Often compared to other universal-type HPLC detection methods, like RI and ELSD, CAD has been shown to be much easier to use, and unlike RI, can accommodate gradients. In addition, CAD response is not dependent upon the chemical characteristics of the compounds of interest, but on the initial mass concentration of analyte in the droplets formed upon nebulization, providing a much more uniform response as opposed to, for example, UV, where responses can vary dramatically according to the wavelength used and the extinction coefficient.
Michael Swartz "Innovations in HPLC" Editor Michael E. Swartz is Research Director at Synomics Pharmaceutical Services, Wareham, Massachusetts, and a member of LCGC's editorial advisory board. Direct correspondence about this column to "Innovations in HPLC," at lcgcedit@lcgcmag.com.
References
(1) R.P.W. Scott, Chromatographic Detectors. Design, Function and Operation (Marcel Dekker, New York, 1996).
(2) L.R. Snyder, J.J. Kirkland, and J.W. Dolan, in Introduction to Modern Liquid Chromatography (John Wiley and Sons, New York, 2010).
(3) A. Tiselius and D. Claesson, Arkiv. Kemi Mineral. Geol. 15B(18), 1 (1942).
(4) A.J.P. Martin and S.S. Randall, Biochem. J, 49, 293 (1951).
(5) E. Haati, and T. Nikkari, Acta Chim. Scand., 2565 (1963).
(6) R.P.W. Scott and J.G. Lawrence, J. Chromatogr. Sci. 11, 65 (1970).
(7) B.G. Julin, H.W. Vandenborn, and J.J. Kirkland, J. Chromatogr. 112, 443 (1975).
(8) J.W. Dolan and J.N. Seiber, Anal. Chem. 49, 326 (1977).
(9) C.G. Horvath and S.R. Lipsky, Nature 211, 748 (1966).
(10) J.J. Kirkland, Anal. Chem. 40, 391 (1968).
(11) W.M.A. Niessen, Liquid Chromatography-Mass Spectrometry, Chromatographic Science Series Vol. 97, 3rd ed. (Taylor and Francis, London, UK, 2006).
(12) M.C. McMaster, LC-MS, A Practical Users Guide (Wiley, Hoboken New Jersey, 2005).
(13) M. Swartz, J. Liquid Chrom., in press, July 2010.
(14) D. Parriott, A Practical Guide to HPLC Detection (Academic Press, San Diego, California, 1993).
(15) R.P.W. Scott in Handbook of HPLC (Chromatographic Science Series, Vol. 78), E. Katz, R. Eksteen, P. Schoenmakers, and N. Miller, Eds. (Dekker, New York, 1998, Ch. 15).
(16) K. Blau and J.M Halket, Eds., Handbook of Derivatives for Chromatography, 2nd ed., (Wiley, New York, 1993).
(17) M.E. Swartz, J. Liquid Chromatogr. 28(8), 1253 (2005).
(18) E.S. Grumbach, J.C. Arsenault, and D.R. McCabe, Beginners Guide to UPLC (Waters Corporation, Milford, Massachusetts, 2009.
(19) L.R. Snyder, J.L. Glajch, and J.J. Kirkland, in Practical HPLC Method Development (John Wiley and Sons, New York, 1988).
(20) E.L. Johnson and R. Stevenson, in Basic Liquid Chromatography (Varian, Palo Alto, California, 1978).
(21) P.T. Kissinger and W.R. Heineman, Laboratory Techniques in Electroanalytical Chemistry (Marcel Dekker, New York, 1984).
(22) I.N. Ackworth, Coulametric Electrode Array Detectors for HPLC, Progress in HPLC-HPCE, Vol. 6 (Brill Academic, Boston, Massachusetts, 1997).
(23) J.S. Fritz and D.T. Gjerde, Ion Chromatography (Wiley, New York, 2009).
(24) J. Weiss, Handbook of Ion Chromatography (Wiley, New York, 2009).
(25) R.E. Parks and R.L. Marietta, U.S. Patent 4018562 (1975).
(26) Model 8060 nitrogen-specific HPLC detector, brochure A-8060-99-25M, Antek Instruments, Houston, Texas, 1999.
(27) K. Petritis, C. Elfakir, and M. Dreaux, LCGC Eur. 14, 389 (2000).
(28) Jasco Inc., LCGC Application Notebook, 26 (June 2003).
(29) L.B. Allen, J.A. Koropchak, and B. Szostek, Anal. Chem. 67, 659 (1995).
(30) Corona charged aerosol detector, brochure 70-6454 Rev A, ESA/Dionex, Chelmsford, MA 2004.
(31) M. Swartz, M. Emanuele, A. Awad, and D. Hartley, Supplement to LCGC North America, April 2009. See: http://chromatographyonline.findanalytichem.com/lcgc/article/articleDetail.jsp?id=592237&sk=&date=&pageID=2.

New Method Explored for the Detection of CECs in Crops Irrigated with Contaminated Water
April 30th 2025This new study presents a validated QuEChERS–LC-MS/MS method for detecting eight persistent, mobile, and toxic substances in escarole, tomatoes, and tomato leaves irrigated with contaminated water.
University of Tasmania Researchers Explore Haloacetic Acid Determiniation in Water with capLC–MS
April 29th 2025Haloacetic acid detection has become important when analyzing drinking and swimming pool water. University of Tasmania researchers have begun applying capillary liquid chromatography as a means of detecting these substances.
Prioritizing Non-Target Screening in LC–HRMS Environmental Sample Analysis
April 28th 2025When analyzing samples using liquid chromatography–high-resolution mass spectrometry, there are various ways the processes can be improved. Researchers created new methods for prioritizing these strategies.

.png&w=3840&q=75)

.png&w=3840&q=75)


.png&w=3840&q=75)


.png&w=3840&q=75)


