Scaling LC Methods Using Superficially Porous Particle Stationary Phases
LCGC North America
Because not all laboratories have UHPLC systems, reverse scaling of methods from UHPLC to HPLC is often needed, particularly in the pharmaceutical industry. The use of superficially porous particles can facilitate this process.
The use of ultrahigh-pressure liquid chromatography (UHPLC) is now commonplace among pharmaceutical laboratories. However, until depreciation cycles replace traditional high performance liquid chromatography (HPLC) systems that operate at a maximum pressure of 400 bar, the advantages of UHPLC cannot be realized worldwide. Thus, product methods developed using UHPLC capabilities cannot directly transfer these methods to receiving laboratories without qualified UHPLC availability. As scaling methods from traditional LC to UHPLC has been popular in recent years, the desire exists to address this LC limitation by potentially transferring methods back from UHPLC to available LC systems. This capability has not been shown to be effective on traditional LC columns. Today, pharmaceutical chromatographic methods often use superficially porous packed particle columns that enable UHPLC-like separation under 400 bar. Unlike traditional stationary phases, which use a range of particle sizes with associated column dimensions, superficially porous particle stationary phases often use the same particle size in differing column dimensions. As the particle size now remains the same, this study looks to see if reverse scaling of chromatographic profiles of interest to the pharmaceutical industry can be routinely achieved.
Liquid chromatography (LC) instrumentation operating at greater than 400 bar is becoming more commonplace as newer equipment is making its way into commercial laboratories. Although these ultrahigh-pressure liquid chromatography (UHPLC) systems are becoming more prevalent, the industry still relies on transferring chromatographic methods throughout the world and, as such, the issue that not all receiving laboratories routinely operate with LC systems that are compatible with UHPLC methods still needs to be addressed.
Since its inception, scaling low-pressure methods to UHPLC conditions has been prevalent. Many companies have scaling calculators available on their websites (1). Scaling of LC is becoming less of an issue as depreciation cycles replace laboratory LC systems with higher pressure capabilities. Yet, the issue of low-pressure systems still exists in pharma when using smaller contract and worldwide laboratories. With proper considerations for flow, injection, and system void volumes, methods developed on <400-bar systems are often made much more efficient using UHPLC conditions (2–4). However, the scaling is not perfect, and the UHPLC method should be revalidated before use. Although resolution may improve, the required lower injection volume may not place enough analyte on the column to detect low-level impurities. In addition, as demonstrated in our laboratory, columns may not behave identically as scaled (5). We found that scaling from UHPLC back to high performance liquid chromatography (HPLC) is not advantageous for impurity methods because of potential selectivity and performance issues. This observation makes sense; we don't road test a Formula I automobile to race with a street car.
After publication of our reverse-scaling study, columns packed with superficially porous particles (SPPs) have become prevalent for pharmaceutical applications. Columns packed with these particles are often referred to as core–shell columns. Core–shell columns have the advantage of exhibiting near-UHPLC separations but at lower pressures (6). This capability enables laboratories to shorten their separation run times and efficiencies on traditional, non-UHPLC, instrumentation. Relevant to scaling interests, core–shell columns are often packed with the same particle in differing column dimensions. Unlike in the original reverse-scaling studies, core–shell columns enable the same particle to be used in the differing column dimensions. This characteristic may allow separations to reverse scale more effectively from UHPLC to HPLC conditions and pressures. The original intent of this study was to only look at vertical scaling, but the data showed right off the bat that this approach would not work. The investigation moved to horizontal scaling as a follow-up series of experiments to further investigate core–shell column scaling. In this study, a representative separation profile using commercially available drug substances was used to investigate reverse scaling with SPP columns.
Experimental
Instrumentation
The LC data reported in this study was generated using a Thermo Fisher Scientific Ultimate 3000 system equipped with a photodiode-array detector. System volume changes are critical in method scaling. A single instrument platform was used to negate this affect. Using a single system for all column investigations allowed us to operate at both traditional and UHPLC conditions and normalize the system effects and void volume differences that we would have using different systems. Thus, this study focused solely on column differences. The LC system was controlled and the resulting data were processed using Atlas Version 9.00.0.10711 (Thermo Fisher Scientific).
LC Conditions and Samples
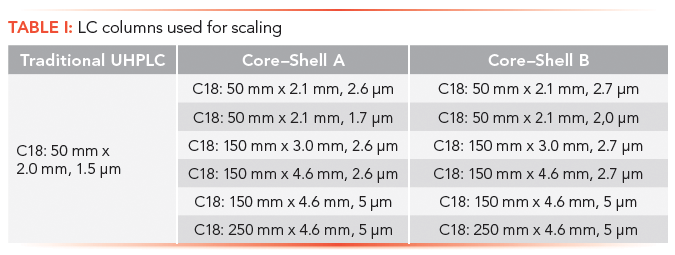
Mobile phases and LC conditions were consistent with those used in a previous study (11). A single vendor for the traditional phase UHPLC column and two separate vendors for the SPP phases were used. All target analytes and mobile phases were prepared with chemicals purchased from Sigma-Aldrich. The LC column dimensions that were used are listed in Table I.
Scaling Calculator
Scaling calculations were calculated as described in the manuscript and correlated with spreadsheets received from Grace Discovery Sciences. The use of method translation calculators was recently reviewed by Majors (8).
Results and Discussion
Scaling Calculations
Scaling calculators were created for projecting the run conditions moving from traditional HPLC column formats to UHPLC column formats. In this regard, the calculators work well in speeding up run times from traditional HPLC methods and oftentimes improving, or at least maintaining resolution, throughout the profile (2,3). Because many laboratories still use equipment limited to the traditional HPLC platform, laboratories have attempted to scale back from UHPLC to HPLC with the goal of rapid HPLC method development on the UHPLC platform and transferring the method on traditional platforms that are still being used. Webster and Elliott showed why this approach may not be a good idea (5). This issue is limited in scope as depreciation cycles equip more and more laboratories with UHPLC-compatible instruments. Scaling calculators are designed with the conversion from HPLC to UHPLC in mind. The critical parameters in scaling from UHPLC to HPLC include column length, particle size, and injection volume (5,9–11). Neue and colleagues (12) demonstrated the scaling of separations using 5-µm, 15-cm columns to 1.7-µm, 5-cm columns. Dramatic changes should be made only if the chromatographic profile and resolution of the critical pair is maintained (13).
Scaling calculations are based on standard chromatographic concepts (14). The primary equations used by the scaling calculators are
Injection volume:

where I is the injection volume for methods 1 and 2; dc is the column diameter used in methods 1 and 2; and L is the column length used for the method 1 and 2 columns.
Flow rate:

where F is the flow rate for methods 1 and 2; dc is the column diameter used in methods 1 and 2; and dp is the particle size used for the method 1 and 2 columns.
Gradient time:

where T is the gradient time for methods 1 and 2.
The calculations are designed to provide starting chromatographic conditions followed by further optimization. The critical parameter in reverse scaling is whether these conditions yield a pressure under the pressure maximum for HPLC. Most traditional HPLC platforms tolerate pressure of up to 400 bar. A UHPLC method that is to be converted to an HPLC platform must first be optimized to run at conditions that project that the new method pressure will remain under 400 bar. This often entails slowing down the optimized UHPLC method (5,14).
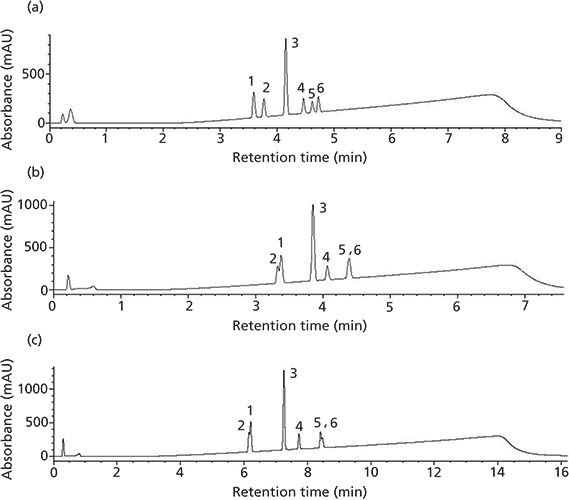
Figure 1: Study profile on traditional and superficially porous particle phases: (a) traditional UHPLC (50 mm × 2.0 mm, 1.5 µm), (b) Core–shell A (50 mm × 2.1 mm, 2.6 µm), and (c) Core–shell B (50 mm × 2.1 mm, 2.7 µm). Gradient conditions are given in Table II. Peaks: 1 = furosemide,2 = carbamazepine, 3 = naproxen, 4 = valsartan, 5 = ibuprofen, 6 = indomethacin.
Study
The goal of this study was to evaluate whether columns packed with core–shell particles reverse scale more effectively than traditional column packings. A separation based on earlier work (5) was used for actual UHPLC separation using compounds that vary in their chemical nature. In that study, the UHPLC column in a traditional particle format was used as the basis to investigate scaling back to HPLC.
Horizontal Scaling from UHPLC to Core–Shell Particles
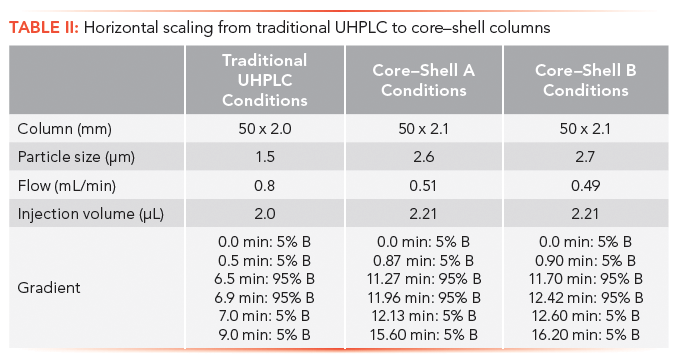
Our first attempt is looking at UHPLC to short SPP columns. In Figure 1a, the rapid resolution of varying drug substances on a traditional UHPLC phase is presented. If we cannot scale a representative profile from traditional UHPLC to core–shell UHPLC phases, going to core shell phases packed in traditional lower pressure column dimensions is not warranted. Using the horizontal scaling conditions from Table II, the resulting profile for the 2.6-µm Core–shell A phase is shown in Figure 1b. In this separation, a peak reversal for the carbamazepine and furosemide pair is seen as well as a loss in resolution. Additionally, ibuprofen is coeluted with the indomethacin peak. It is not possible to conclude that scaling yielded an equivalent profile with the Core–shell A column and conditions. Looking at the results obtained using a second core–shell column (from a different manufacturer) in Figure 1c, the resulting profile again exhibits peak reversal and loss of resolution for the carbamazepine and furosemide peak pair. In addition, a coelution of the ibuprofen and indomethacin peak pair can be seen in the profile. Again, an equivalent profile was not produced. The effect of scaling may not be the culprit here as much as the older, traditional stationary phase (type A silica) likely has more exposed silica. It should be noted that using calculators specifically from the Core–shell A and B vendors for their phases did not solve this issue. Looking into this stationary phase effect a little further, the mobile phase was changed from formic acid to trifluoroacetic acid to investigate whether the addition of an ion-pairing reagent would improve the core–shell profile. Figure 2a is the resulting profile adding 0.1% trifluoroacetic acid in place of formic acid used with the traditional phase UHPLC column. Essentially the same profile is produced. However, the profile improves for both SPP phases (Figures 2b and 2c). The ibuprofen peak resolution with the core shell particles remains unacceptable. It is likely with further optimization that the profile could be obtained on the SPP phases. Method optimization is not direct method scaling of the separation. What this data shows is not so much that scaling cannot be achieved, but in more-complex separations the differences in stationary phase chemistries still remain significant. As with all LC separations, the nature of the stationary phase and the chemistry of the analytes must be considered. The United States Pharmacopeia (USP) may traditionally allow the substitution of one C18 column for another, but this equivalence is seldom realized in industrial pharma (16).
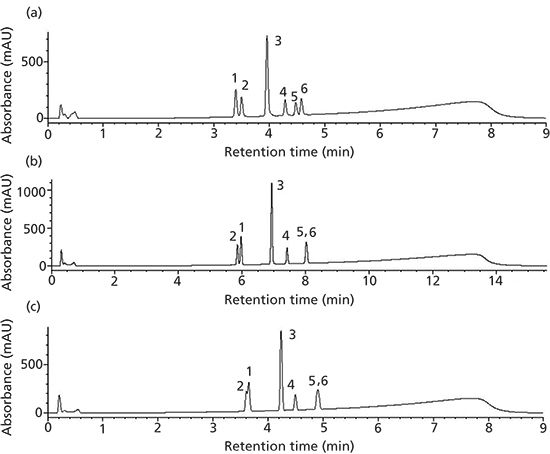
Figure 2: Study profile using trifluoroacetic acid on traditional and SPP phases: (a) Traditional UHPLC (50 mm × 2.0 mm, 1.5 µm), (b) Core–shell A (50 mm × 2.1 mm, 2.6 µm), and (c) Core–shell B (50 mm × 2.1 mm, 2.7 µm). Gradient conditions are given in Table II. Peaks: 1 = furosemide,2 = carbamazepine, 3 = naproxen, 4 = valsartan, 5 = ibuprofen, 6 = indomethacin.


Vertical Scaling with Core–Shell Particles
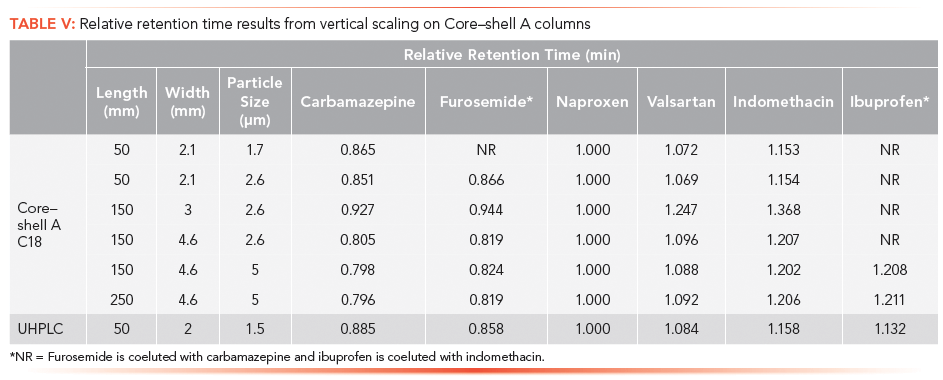
One of the advantages of superficially porous particles, according to their vendors, is that because the same particle is used in different column dimensions, scaling with these phases should be straightforward. Rather than looking at a horizontal scaling from the UHPLC short column as we did before, now we are changing the optimal core–shell conditions and scaling back to traditional HPLC column dimensions. We are going to start with the separation on the short SPP column and see how it vertically scales back to columns with dimensions compatible with lower pressure systems (Table III). Figure 3a is our initial separation for the Core–shell A phase. Ibuprofen was left in the sample matrix to see if the conditions applied will ultimately resolve this peak from the indomethacin peak. Increasing column dimensions, shown in Figures 3b–3e, effectively maintains the original profile. Interestingly, going down to the 1.7-µm particles did not enhance resolution of the original profile. The resolution data for the separations is presented in Table IV and the relative retention times (RRT) are listed in Table V. The RRTs are close, but not acceptably equivalent to say that the profiles scaled equivalently for both the 2.6- and 5-µm particles. From this data, we conclude that the scaling was a good estimate of the conditions needed for the different column geometries. However, there is still enough error in particle composition and packing differences so that direct method scaling was not achieved.
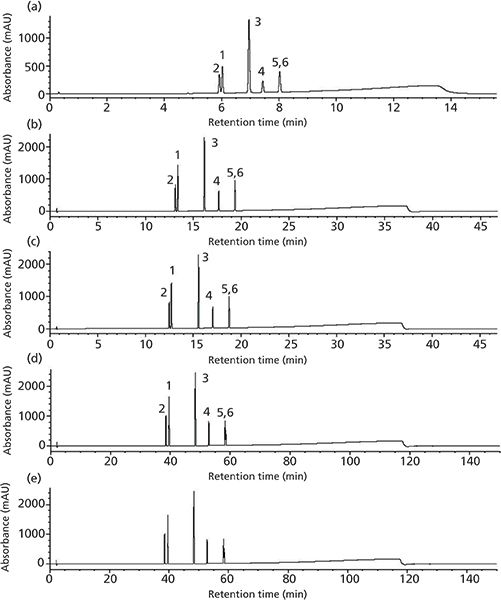
Figure 3: Vertical scaling on Core–shell A SPP phases. (a) 50 mm × 2.1, 2.6 µm, (b) 150 mm × 3.0 mm, 2.6 µm, (c) 150 mm × 4.6 mm, 2.6 µm, (d) 150 mm × 4.6, 5 µm, and (e) 250 mm × 4.6 mm, 5 µm. Gradient conditions are given in Table III. Peaks: 1 = furosemide,2 = carbamazepine, 3 = naproxen, 4 = valsartan, 5 = ibuprofen, 6 = indomethacin.


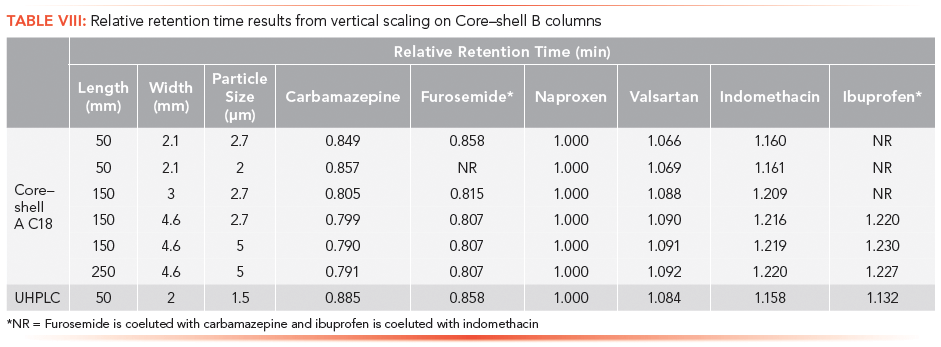
The vertical scaling study was repeated with columns from a second core–shell column manufacturer, designated as the Core–shell B phase (Table VI). Again, illustrated in Figure 4a, an initial resolution profile for this phase was established. The increasing column dimensions seen in Figures 4b–4e actually improve the profile for the carbamazepine and furosemide peak pair as well as the indomethacin and ibuprofen peak pair to a lesser extent. The resolution and RRT data for this study are presented in Tables VII and VIII. The RRT data are much improved with this series of profiles. It remains difficult to argue that the scaling profile was maintained.
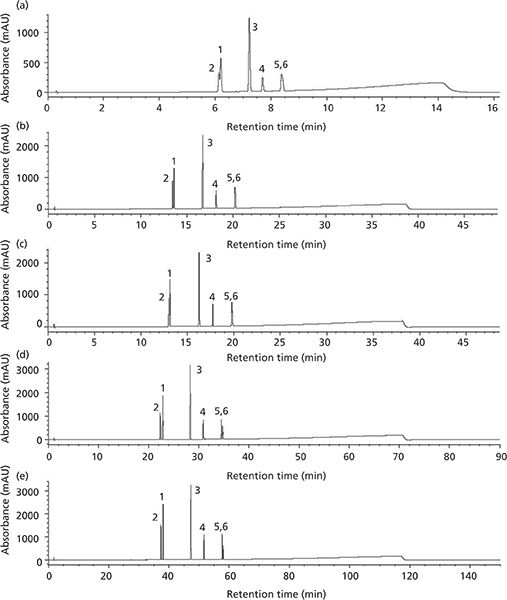
Figure 4: Vertical scaling on Core–shell B SPP phases. (a) 50 mm × 2.1, 2.7 µm, (b) 150 mm × 3.0 mm, 2.7 µm, (c) 150 mm × 4.6 mm, 2.7 µm, (d) 150 mm × 4.6, 5 µm, and (e) 250 mm × 4.6 mm, 5 µm. Gradient conditions given in Table VI. Peaks: 1 = furosemide,2 = carbamazepine, 3 = naproxen, 4 = valsartan, 5 = ibuprofen, 6 = indomethacin.
Conclusion
Column scaling in liquid chromatography is an interesting concept that may work for series of analytes with consistent chemistry. However, the real value in scaling chromatographic methods is attempting to improve challenging lower-pressure separations using UHPLC capability. In our laboratory we have not seen stationary phases scale theoretically with column dimension. Scaling has not proven to be an achievable opportunity for most complex pharmaceutical separations. It is our suggestion to improve chromatographic efficiencies using core–shell and UHPLC technologies in a standalone fashion that can be optimized using scaling principals. However, revalidation is required to establish equivalence because direct scaling is not adequate in the cases studied.
Disclosure
This project was supported by AbbVie, Inc. AbbVie, Inc. participated in the interpretation of data, writing, reviewing, and approving the publication. Gregory K. Webster is an employee of AbbVie and Matthew A. Gragg is a contractor with AbbVie, Inc.
References
(1) Sigma, http://www.sigmaaldrich.com/analytical-chromatography/hplc/method-transfer-calculator.html, Sciences Analytiques: https://epgl.unige.ch/labs/fanal/hplc_calculator:en; ACD Labs: http://www.acdlabs.com/resources/freeware/translator/.
(2) J.W. Dolan, LCGC North Am. 32(2), 98–102 (2014).
(3) J.W. Dolan, LCGC North Am. 32(3), 188–193 (2014).
(4) M. Swartz, "HPLC to UPLC Method Migration: An Overview of Key Considerations and Available Tools," presented at the Pittsburgh Conference & Exposition on Analytical Chemistry and Applied Spectroscopy (Pittcon), Chicago, Illinois, 2007.
(5) G.K. Webster and A. Elliott, Am. Pharm. Rev. 14, 32–40 (2011).
(6) V. González-Ruiz, A.I. Olives, and A. Martín, TrAC, Trends Anal. Chem. 64, 17-28 (2015).
(7) I. Baranowska and B. Kowalski, Water Air Soil Pollut. 211, 417–425 (2010).
(8) R.E. Majors, LCGC North Am. 29(6), 476–484 (2011).
(9) D. Guillarme, D.T.T Nguyen, S. Rudaz, and J.L. Veuthey, Eur. J. Pharm. Sci. 66, 475–482 (2007).
(10) D. Guillarme, D.T.T Nguyen, S. Rudaz, and J.L. Veuthey, Eur. J. Pharm. Biopharm. 68, 430–440 (2008).
(11) M.M. Dittmann, "Approaches Towards Method Compatibility Between HPLC and UHPLC Systems," Paper 1970-6, presented at the Pittsburgh Conference & Exposition on Analytical Chemistry and Applied Spectroscopy (Pittcon), Orlando, Florida, 2010.
(12) U.D. Neue, D. McCabe, V. Ramesh, V. H. Pappa, and J. DeMith, Pharmacopeial Forum 35, 1622–1626 (2009).
(13) G.K. Webster and C.L. Basel, LCGC North Am. 21(3), 286–294 (2003).
(14) G.K. Webster, T.F. Cullen, and L. Kott, Ultra-High Performance Liquid Chromatography and Its Applications, (Wiley Interscience, 2013), pp. 31–54.
Gregory Webster is a senior principal research scientist in Development Sciences at AbbVie, Inc. Dr. Webster received his PhD in analytical chemistry at Northern Illinois University in 1991. Prior to joining Abbott/AbbVie in 2007, he worked at Alpharma, Chemsyn Laboratories, Bayer Corporation, and Pfizer.
Matthew Gragg is currently a chemist working within the NCE Analytical R&D – LC group at AbbVie, Inc. He graduated with a BS in Chemistry from Truman State University in 2015.
Direct correspondence to: gregory.webster@abbvie.com

Characterizing Plant Polysaccharides Using Size-Exclusion Chromatography
April 4th 2025With green chemistry becoming more standardized, Leena Pitkänen of Aalto University analyzed how useful size-exclusion chromatography (SEC) and asymmetric flow field-flow fractionation (AF4) could be in characterizing plant polysaccharides.
Investigating the Protective Effects of Frankincense Oil on Wound Healing with GC–MS
April 2nd 2025Frankincense essential oil is known for its anti-inflammatory, antioxidant, and therapeutic properties. A recent study investigated the protective effects of the oil in an excision wound model in rats, focusing on oxidative stress reduction, inflammatory cytokine modulation, and caspase-3 regulation; chemical composition of the oil was analyzed using gas chromatography–mass spectrometry (GC–MS).

