Chromatography Fundamentals, Part I: Thermodynamics of Liquid Chromatography: The Distribution Coefficient
LCGC North America
This article, the first in a series on chromatography fundamentals, discusses the cornerstone of all chromatographic techniques-the distribution or coefficient-and its influence on liquid chromatographic separations.
This article, which is the first in a series on the fundamentals of chromatography, discusses the cornerstone of all chromatographic techniques: the distribution or equilibrium coefficient and its influence on liquid chromatographic separations. This concept is used to establish guidelines for developing thermodynamically stable methods of chromatographic analysis.
This month we launch the first installment of a series of articles on fundamental concepts of chromatography. These reviews offer insight into the underlying principles of the chromatographic process. Topics will include thermodynamics of chromatography, plate height theory and peak broadening, theory of chromatography, separation and resolution, intermolecular interactions, separation modes of liquid chromatography (LC), and physicochemical measurements using LC. Our initial focus will be on LC, after which we will segue to gas chromatography. Our first topic is the distribution coefficient, a thermodynamic parameter that governs all forms of chromatographic behavior.
Nernst's Distribution Equation
All physical and chemical changes are governed by the laws of thermodynamics, and chromatography is certainly no exception. Chromatographic separations are based on the thermodynamic distribution of solutes between two pure phases, as described by Nernst's distribution law,

where Keq is the distribution constant and ai is the activity of the ith solute-that is, the solute concentration at infinite dilution, distributed between two immiscible phases at equilibrium. The distribution constant is a thermodynamic property of solutes measured at defined temperature, pressure, and phase compositions.
As applied to chromatography, this equation becomes

where K is now the distribution, equilibrium, or partition coefficient, [Ai] is the concentration of the ith solute, and the subscripts s and m indicate stationary and mobile phases, respectively. This equation is applicable to all forms of chromatography involving any mobile phase or stationary phase.
Equation 2 differs from equation 1 because it describes a chromatographic process not necessarily at equilibrium: injected samples may not be close to infinite dilution, and chromatography is a dynamic, not a static process. As a result, K is referred to as a coefficient, not a constant. Equation 2 is the simplest form of the distribution equation; more complicated expressions can be derived that take into account solute association or complexation that may occur in one or both phases. For the separation of weak acids or bases, pH will also enter into the equation.
To obtain reproducible LC results, the distribution coefficient must remain constant throughout the separation process. If not, peak shapes may become distorted or tailed, and retention times may vary, compromising resolution and analytical data.
Nonequilibrium Effects
To ensure that chromatography is at or near thermodynamic equilibrium, the conditions described below must be met.
1. The ratio of the amount of solute in the mobile and stationary phases must be within the linear region of the isotherm.
The separation process must occur within the linear region of the isotherm-that is, a plot of solute amount in the mobile phase versus solute amount in the stationary phase. Nonlinear isotherms in LC can occur if columns are overloaded or if the stationary-phase thickness or composition is not uniform or contains active sites. Overloading can also be an issue with low surface-area packings. If the isotherm is not linear, peak distortion will occur. Please note that this criterion refers to the amount, not the concentration, of injected sample as discussed in item 3.
2. The solute diffusion rates should be maximized and linear velocity minimized to approach local equilibrium.
A further consideration is the fact that chromatography is a dynamic process in which local concentrations are continuously changing during elution. Thus, in the mobile phase, the concentration goes from zero to a maximum, and then back down to zero, as described by the peak profile. The concentration in the stationary phase is simply the mirror image. Nonequilibrium results because of the time lag that occurs between solute concentrations in the mobile phase versus the stationary phase as K tries to keep up with solute movement during elution.
This type of nonequilibrium is caused by the finite rate of solute diffusion in both phases, which leads to peak broadening. To minimize temporal nonequilibrium, solute diffusion coefficients in both phases should be maximized and solute path lengths should be minimized. Furthermore, in LC, the linear velocity of the mobile phase should be as low as possible to reduce time lag. (Essentially we want to achieve a minimum height equivalent to the theoretical plate [HETP] versus velocity plot, which will be discussed in a future article.)
3. The injected solute concentrations should approach infinite dilution.
This condition implies that all molecular interactions in solution (solute–solute, solvent–solvent, and solute–solvent) are equivalent. To meet this requirement, the injected sample should be as dilute as possible, which can be achieved using highly sensitive detectors. (An alternative, but less practical approach is to use a mobile phase that has the same solubility parameter as the solute.) As compared to item 1, this requirement refers to concentration, not sample amount. If detection limit is a problem, the injection volume can be increased, within limits, depending on the inner diameter of the column.
4. The mobile-phase and stationary-phase composition should remain constant.
In principle, this should be an easily met criterion, especially with bonded stationary phases. However, the sample itself will change phase composition. This effect can be minimized by keeping injected sample concentration low, as discussed in item 3.
Problems occur when phases become contaminated or change composition during usage, resulting in elution time excursions, as well as baseline drift. Mobile-phase contamination can occur when recycling is used to save mobile-phase cost and reduce waste. Mobile-phase composition may also be altered during vacuum degassing. Some mobile phases are hygroscopic, such as tetrahydrofuran, which may lead to retention time drifting if freshly acquired mobile phase is not used. Stationary-phase composition may be modified if injected samples contain irreversibly adsorbed material, or by slow oxidization from long-term use or storage.
5. The column temperature and pressure should remain constant throughout the separation.
Except for size-exclusion chromatography (SEC), elution behavior is extremely sensitive toward temperature changes, thus columns must be well thermostatted to maintain thermodynamic equilibrium. With most instrumentation, pressure across a high performance liquid chromatography (HPLC) column remains fairly constant, depending on the pumping system, except at the column exit. Regardless, the distribution coefficient remains relatively constant toward pressure changes because of the low compressibility of liquids. An exception may be ultrahigh-pressure LC, depending on the operating pressure and the nature of the mobile phase.
6. The separation mechanism must be well defined.
The presence of more than a single separation mechanism can lead to highly distorted or broadened peaks. The only way to correct this effect is to modify the method.
A common example of a mixed-mechanism separation is ion-exchange chromatography of ionic compounds containing hydrophobic groups; solutes may be retained by both ion-exchange and hydrophobic interactions. Another example involves SEC; adsorption, if present, may superimpose on size separation, obliterating molecular size information.
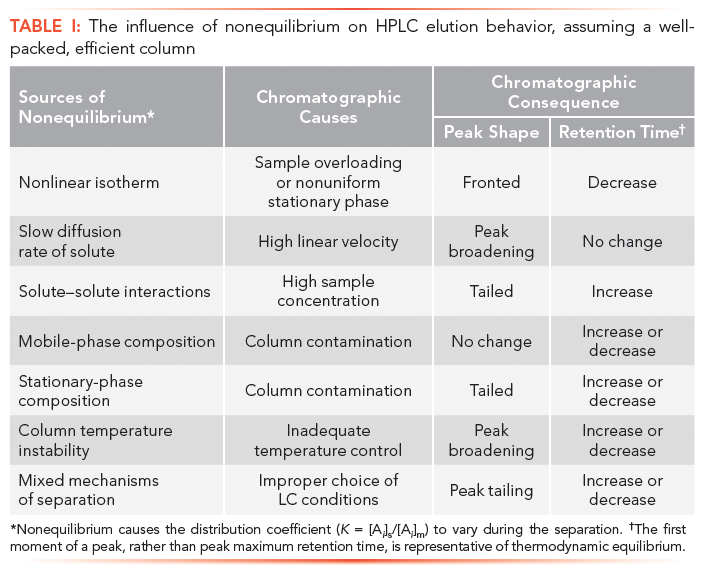
A summary of factors required to maintain thermodynamic equilibrium, as well as consequences of operating outside of an acceptable range, is given in Table I.

Table I: The influence of nonequilibrium on HPLC elution behavior, assuming a well-packed, efficient column
Conclusions
As we have seen, the distribution coefficient provides guidance for developing thermodynamically stable methods of chromatographic analysis. Deviations from ideality can result in distorted peaks and nonreproducible retention times.
In the next "Chromatography Fundamentals" installment, we will continue our discussion on thermodynamics of LC. We will show how entropy and enthalpy are related to the distribution constant, and provide insight into the forces responsible for the separation process.
Recommended References
(1) J.C. Giddings, Dynamics of Chromatography Part I Principles and Theory (Marcel Dekker, New York, New York, 1965).
(2) E. Heftmann, Chromatography, 3rd Ed. (Reinhold, New York, New York, 1975).
(3) B.L. Karger, L.R. Snyder, and C. Horvath, An Introduction to Separation Science (Wiley-Interscience, New York, New York, 1973).
Howard G. Barth is with Analytical Chemistry Consultants, Ltd., in Wilmington, Delaware. Direct correspondence to: howardbarth@gmail.com

New Method Explored for the Detection of CECs in Crops Irrigated with Contaminated Water
April 30th 2025This new study presents a validated QuEChERS–LC-MS/MS method for detecting eight persistent, mobile, and toxic substances in escarole, tomatoes, and tomato leaves irrigated with contaminated water.

.png&w=3840&q=75)

.png&w=3840&q=75)


.png&w=3840&q=75)


.png&w=3840&q=75)


