The Role of Elution Gradient Shape in the Separation of Protein Therapeutics
LCGC North America
A discussion of the role of the gradient in separation by reversed-phase and ion-exchange HPLC, with data from two products to illustrate the key points
In this article, we discuss the role of the gradient in protein separations by reversed-phase and ion-exchange high performance liquid chromatography (HPLC). To illustrate the key points, we show data from two products. Granulocyte colony stimulating factor (GCSF) is a microbial protein that is expressed in E. coli. For this molecule, reversed-phase HPLC is examined for separation of the product-related variants. The other molecule is a biosimilar monoclonal antibody product and, in this case, ion-exchange HPLC is explored as a tool for analysis of the acidic, main, and basic variant species.
The number of therapeutic protein products available for use has radically increased in recent years. They include a wide variety of molecules such as recombinant human cytokines (for example, α and β interferon), cellular growth factors (such as granulocyte-macrophage colony-stimulating factor [GM-CSF]), hormones (such as glucagon), neuromuscular antagonists (for example, botulinum toxin), blood products (such as clotting factor VIII), and monoclonal antibodies (mAbs) (1). For protein therapeutics to be effective, they must be synthesized in their biologically active forms, with proper folding and post-translational modifications (2). However, these products are known to be associated with a variety of heterogeneities because of modifications such as glycosylation, deamidation, oxidation, and disulfide bond formation, which occur as a consequence of events during protein expression, purification, and storage (3). In view of these heterogeneities, thorough characterization using multiple orthogonal techniques is necessary for receiving regulatory approval for product commercialization. Of the many tools that are used, high performance liquid chromatography (HPLC) is the primary workhorse for analysis of biopharmaceutical proteins (4,5). The significant advantages that HPLC offers include high reproducibility, high sample throughput because of autosampling capabilities, high separation resolution, easy quantitation, high precision, and high robustness (6).
HPLC can further be classified into normal-phase, reversed-phase, ion-exchange, and gel filtration (size-exclusion) chromatography. Each mode is based on a different underlying mechanism and together make HPLC a powerful tool in the analytical arsenal. Since typical HPLC applications involve separation of product from product-related variants and impurities that have very similar physicochemical properties as compared to the product, the elution strategy has a significant impact on the quality of separation. The most commonly used strategies are isocratic elution and gradient elution. The latter technique can be implemented in linear, segmented, convex, and concave shapes (7). Elution is isocratic when the eluent strength is kept constant throughout the separation. Gradient elution implies that the mobile-phase composition will be varied during sample separation as per the chosen trajectory. Linear gradients are generally preferred because they are easy to create and are relatively robust. However, nonlinear gradients offer several distinct advantages, including reduced separation time, improved sample resolution, and higher detection sensitivity (8). In this installment, we primarily focus on reversed-phase HPLC and ion-exchange HPLC.
Separation by reversed-phase HPLC is achieved because of the interactions between the hydrophobic ligands covalently attached to the adsorbent and the hydrophobic patches of the species in the feed. Loading conditions are chosen such that the product binds strongly to the adsorbent. Thereafter elution is performed by using organic solvents such as acetonitrile, ethanol, or methanol. The molecules are eluted in the order of increasing hydrophobicity. More hydrophobic species are retained strongly and hence are eluted later, while the less hydrophobic species are eluted earlier. Several systematic approaches for reversed-phase HPLC method development have been described in the past (9–14). In most cases, an attempt is made to optimize sample retention (values of the retention factor, k), column efficiency (plate number, N), and selectivity (separation factor, α). Major emphasis is usually given to the optimization of selectivity, often using a preselected series of experiments plus a computer program for predicting retention (k and α) as a function of one or more experimental variables. About four decades ago, the gradient elution was merely used for the prediction of isocratic behavior because the gradient run covers all binary compositions of possible interest to isocratic separation (14,15). In the past, favored method development strategies have been based on varying experimental conditions that are believed to have the largest effect on α; for example, solvent type, solvent strength (%B), and column type for neutral samples, or pH and ion-pair-reagent concentration for ionic samples. The use of gradient elution with temperature and gradient steepness as variable parameters for the optimization of selectivity and separation have been used as an approach for method development (13).
Ion-exchange HPLC is another popular, nondenaturing analytical method that is used for the separation of species based on their charge (16). Separation in this case is achieved by either changing the pH of the mobile phase or increasing the salt content in the mobile phase. Either of these alterations change the charge on the species and thus affect the interaction between the species and the stationary phase. The resolution of peaks is generally based on the differential retention of the protein on the column (17). There are several studies published on this topic that focus on the importance of development and validation of charge heterogeneity analysis of protein therapeutics using an ion-exchange method (18–24). Several approaches have been published in literature on the types of elution to resolve the charge variants of mAb, including salt gradient, pH gradient, and salt hybrid gradient. All of these types of gradients have advantages and disadvantages associated with them. The most popular of these is the formation of a salt gradient. In a salt gradient, apart from the routinely optimized parameters (column, pH, conductivity, temperature, and the type of salt), the optimization of the shape of the elution gradient can have a significant impact on the resolution (25).
In this installment, we discuss the role of the gradient in separation by reversed-phase and ion-exchange HPLC. To illustrate the key points, we show data from two products. Granulocyte colony stimulating factor (GCSF) is a microbial protein that is expressed in E. coli. For this molecule, reversed-phase HPLC is examined for separation of the product-related variants (oxidized, main, and reduced species) in view of the difference in the hydrophobicity of these variants (24). The other molecule is a biosimilar monoclonal antibody product and in this case ion-exchange HPLC is explored as a tool for analysis of the charged variants (acidic, main, and basic species) because of the difference in the charges on these variants.
Materials and Methods
Protein Samples
The two therapeutic protein samples used in this study were recombinant human GCSF (E. coli derived) and an IgG1 mAb (CHO cell culture derived). Both were donated to us by major domestic biotech manufacturers.
Instrumentation and Columns
An Agilent 1200 series HPLC unit was used, consisting of a quaternary pump with degasser, an autosampler with a cooling unit, and a variable-wavelength detector.
Two ion-exchange columns were used in this study: a MAbPac SCX-10 strong-cation-exchange column and a 250 mm × 4.6 mm, 10-µm dp MAbPac WCX-10 weak-cation-exchange column. Both columns were purchased from Dionex (now part of Thermo Fisher Scientific).
Three reversed-phase columns were used: a 100 mm × 4.6 mm Chromolith High Resolution RP-18 column from Merck, a 250 mm × 4.6 mm, 5-µm dp C4 column from Phenomenex, and a 250 mm × 4.6 mm, 3.5-µm dp X-bridge BEH300 C4 column from Waters.
Results and Discussion
Selection of Column Chemistry
Oxidized and reduced species of GCSF have a different hydrophobicity index. Thus, these species can be resolved from the product using any reversed-phase HPLC column with chemistry between C4 and C18. C18 columns are more hydrophobic than C4 and hence require strongly hydrophobic organic solvents for elution as compared to C4. In this study, we found that C4 columns yielded better resolution than C18 for GCSF. Therefore, a C4 column was selected for method development.
In the case of mAbs, a weak-ion-exchange column can be used for resolving the charged variants. Weak-ion-exchange columns offer more resistivity on pH transition over small changes in ionic strength, but require more time for equilibration than a strong-ion-exchange column. The two types may also offer differential selectivity toward acidic versus basic variants. Based on our preliminary investigation, we selected strong cation exchange as the chemistry for the analysis of mAb charged variants.
Selection of Solvent Composition
Solvent composition is known to have a high impact on column selectivity. Typical reversed-phase HPLC separations involve the use of mixtures of acetonitrile, methanol, isopropanol, and water along with trifluoroacetic acid (<1%). For ion-exchange HPLC, buffer pH and molarity are important. Based on preliminary experimentation, an acetonitrile–methanol–water system at 60 °C was chosen for reversed-phase HPLC and 15 mM phosphate at pH 6.8 and 28 °C with sodium chloride was used as the elution buffer for ion-exchange HPLC.
Gradient Optimization
Optimizing the Initial and Final Composition
First, a longer linear gradient (0–100%) was performed and from this chromatogram, the start and end conditions for a shorter gradient were obtained (Figure 1). The percentage of eluent at the retention time of the first eluted peak minus the time required for eluting one void volume was considered as the start percentage required for elution of the first peak protein. Similarly, the percentage of the eluent at the retention time of the last eluted peak minus the time required for eluting one void volume was considered the stop percentage required for elution of the last peak (Figure 1a). For GCSF, an initial mobile-phase B composition of 45% acetonitrile, 15% methanol, and 40% water and a final mobile-phase B composition of 80% acetonitrile, 15% methanol, and 5% water was found to be optimal. In the case of the mAb, the initial mobile-phase B (15 mM phosphate at pH 6.8 with 200 mM NaCl) composition of 20% and final mobile-phase B composition of 60% was chosen. The short linear gradient after selection of the initial and final mobile-phase compositions is shown in Figure 1b.
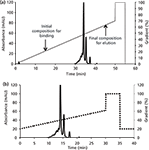
Figure 1: Chromatograms showing (a) determination of initial and final composition of eluent from the linear gradient for mAb and (b) a shorter method after determination of the initial and final eluent composition from the linear gradient for mAb.
Selection of Linear, Convex, and Concave Gradient Shape
If t is time at which %B is desired, and tf is the total time of gradient change, then for linear convex and concave gradients, %B can be approximated by
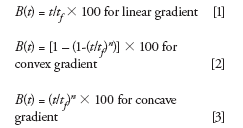
where n is the number controlling the steepness (convexity or concavity) of the gradient shape.
Depending on the peak distribution and spacing, a linear, convex, or concave shape can be selected. If the distribution of peaks and its spacing is uniform, then improvement in resolution or reduction in time is unlikely with a nonlinear gradient. However, if the spacing and distribution of peaks is nonuniform, then a convex or concave gradient shape may result in a better separation. The steepness of the curve can be increased where the peaks are widely spaced. The increase in steepness at the beginning of elution gradient results in a convex shape, but at the latter half it results in a concave shape. In our case, the spacing between the peaks was not uniform for both cases. The peaks after the main peak of interest were widely spaced and so a concave gradient was chosen. Otherwise, if the peaks before the main peak were widely spaced then a convex gradient would have been chosen.

Figure 2: Comparison of gradient shapes for GCSF analysis: (a) linear, (b) segmented, and (c) concave.
Three types of gradients were examined for GCSF, namely linear, segmented, and concave (Figure 2). All gradients were performed on a C4 column. As expected, the linear gradient resulted in evenly spaced peaks (Figure 2a). Further, the European Pharmacopoeia 's segmented gradient method was also performed (Figure 2b). This method has a shallow slope to resolve the oxidized impurities eluted before the main peak, followed by which the slope becomes steeper for elution of the reduced impurities after the main peak. The latter are easily resolved because of differences in hydrophobicities. Finally, a concave gradient was performed at high flow rates (3 mL/min) using a short monolithic column (Figure 2c). This approach resulted in optimal separation of the three components in a significantly reduced analysis time (⅙ of that with linear gradient and 1/14 of that with segmented gradient). Similarly, favorable results were obtained using a concave gradient for analysis of mAb charged variants (Figure 3) with the analysis time reduced from 45 min to 25 min.
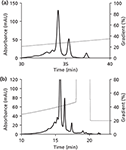
Figure 3: Comparison of gradient shapes for mAb analysis: (a) linear, (b) concave.
Optimization of the Steepness Factor for a Gradient Curve
The concavity or convexity factor, n, which controls the steepness of the curve, was also examined. In most cases, this can be obtained by doing trials for n from 1.5 to 4.0 with a stepwise increase of 0.5 (Figure 4). The optimal value of n was found to be 2 for GCSF and 2.5 for mAb.
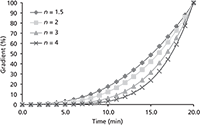
Figure 4: Overview of concave gradients with varying gradient steepness (n).
Final Length of Gradient
After an optimum value of gradient steepness has been determined, a decrease in interval between consecutive time points helps in reducing the gradient length thus compressing the peaks and making them sharp. This will also result in further reduction in time of analysis as shown above for GCSF (Figure 2c) and mAb (Figure 3b).
Conclusions
This installment aims to highlight the important role of gradient shape in HPLC analysis, in particular for biotech therapeutics. It should be noted that nonlinear gradients are likely to require more effort in optimization than the linear gradients. However, as illustrated in the case studies presented in this installment, a systematic optimization of these gradient shapes is likely to result in a significantly improved resolution along with a shorter analysis time.
References
(1) A.S. De Groot and D.W. Scott, Trends Immunol. 28 (11), 482–490 (2007).
(2) G. Chen, B.M. Warrack, A.K. Goodenough, H. Wei, D.B. Wang-Iverson, and A.A. Tymiak, Drug Discovery Today 16 (1), 58–64 (2011).
(3) A.S. Rathore, Trends Biotechnol. 27, 698–705 (2009).
(4) I.S. Krull, A.S. Rathore, and T.E. Wheat, LCGC North Am. 29 (9), 838–852 (2011).
(5) I.S. Krull, A.S. Rathore, and T.E. Wheat, LCGC North Am. 29 (12), 1052–1062 (2011).
(6) V.S. Joshi and V. Kumar, LCGC North Am. 31 (11), 948–953 (2013).
(7) Y.V. Kazakevich and R. Lobrutto, HPLC for Pharmaceutical Scientists (John Wiley & Sons, 2007).
(8) J.W. Dolan and L.R. Snyder, Encyclopedia of Analytical Chemistry (John Wiley & Sons, Ltd., 2012), pp. 1–19. DOI: 10.1002/9780470027318.a5907.pub2
(9) J.C. Berridge, Techniques for the Automated Optimization of HPLC Separations (John Wiley & Sons, 1985).
(10) P.J. Schoenmakers, Optimization of Chromatographic Selectivity: A Guide to Method Development (Elsevier, 1986).
(11) J.L. Glajch and L.R. Snyder, Eds., Computer-assisted Method Development for High-Performance Liquid Chromatography (Elsevier, Amsterdam, The Netherlands, 1990).
(12) L.R. Snyder, J.J. Kirkland, and J.L. Glajch. Practical HPLC Method Development (John Wiley & Sons, 2012).
(13) P.L. Zhu, L.R. Snyder, J.W. Dolan, N.M. Djordjevic, D.W. Hill, L.C. Sander, and T.J. Waeghe, J. Chromatogr. A 756 (1), 21–39 (1996).
(14) P.J. Schoenmakers, H.A.H. Billiet, and L. De Galan, J. Chromatogr. A 205 (1), 13–30 (1981).
(15) C.M. Du et al., Anal. Chem. 70 (20), 4228–4234 (1998).
(16) A. Williams and V. Frasca, Current Protocols in Protein Science , supplement 15, 8.2.1–8.2.30 (1999).
(17) W. Kopaciewicz, M.A. Rounds, J. Fausnaugh, and F.E. Regnier, J. Chromatogr. A 266, 3–21 (1983).
(18) J. Vlasak and R. Ionescu, Curr. Pharm. Biotechnol. 9 (6), 468–481 (2008).
(19) D. Farnan and G.T. Moreno, Anal. Chem. 81 (21), 8846–8857 (2009).
(20) L.C. Santora, Z. Kaymakcalan, P. Sakorafas, I.S. Krull, and K. Grant, Anal. Biochem. 299 (2), 119–129 (2001).
(21) K.G. Moorhouse, W. Nashabeh, J. Deveney, N.S. Bjork, M.G. Mulkerrin, and T. Ryskamp, J. Pharm. Biomed. Anal. 16 (4), 593–603 (1997).
(22) J.C. Rea, G.T. Moreno, Y. Lou, and D. Farnan, J. Pharm. Biomed. Anal. 54 (2), 317–323 (2011).
(23) J.C. Rea, Y.J. Wang, T.G. Moreno, R. Parikh, Y. Lou, and D. Farnan, Innovations Biotechnol. 439–464, available at: http://cdn.intechopen.com/pdfs-wm/28723.pdf.
(24) H.S. Lu, C.L. Clogston, L.O. Narhi, L.A. Merewether, W.R. Pearl, and T.C. Boone, J. Biol. Chem. 267 (13), 8770–8777 (1992).
(25) P. Jandera, J. Chromatogr. A 845 (1), 133–144 (1999).
Varsha S. Joshi is a postdoctoral fellow with the Department of Chemical Engineering at the Indian Institute of Technology Delhi.

Varsha S. Joshi
Vijesh Kumar is a graduate student with the Department of Chemical Engineering at the Indian Institute of Technology Delhi.

Vijesh Kumar
Ira S. Krull is a Professor Emeritus with the Department of Chemistry and Chemical Biology at Northeastern University in Boston, Massachusetts, and a member of LCGC's editorial advisory board.

Ira S. Krull
Anurag S. Rathore is a professor in the Department of Chemical Engineering at the Indian Institute of Technology in Delhi, India.

Anurag S. Rathore


.png&w=3840&q=75)

.png&w=3840&q=75)


.png&w=3840&q=75)


.png&w=3840&q=75)


