Resolving the Complexity of Biomacromolecules Using Multiple Modes of Chromatography
LCGC North America
To resolve and quantitate monoclonal antibodies and antibody–drug conjugates, analytical scientists need various chromatographic modes, such as sizeexclusion, ion-exchange, hydrophobic interaction, and hydrophilic interaction chromatography. Here, we provide advice for making the most of each mode.
Separating proteins and antibodies is a unique analytical challenge because of the complexity of the analytes. Both sample heterogeneity, because of a number of chemical modifications to the analyte, and nonspecific binding to the silica surface often result in chromatographic peak broadening and tailing. This installment of "Column Watch" focuses on several different chromatographic strategies that analytical scientists can use to resolve and quantitate various biomacromolecules, including monoclonal antibodies (mAbs) and antibody–drug conjugates (ADCs). Selected aspects of size-exclusion, hydrophobic interaction, ion-exchange, hydrophilic interaction, and reversed-phase chromatography are discussed.
Biomacromolecules (in particular monoclonal antibodies [mAbs]) have seen a renewed interest in the pharmaceutical and biotechnology industry. The reason for this high level of interest resides in the number of benefits these biological molecules have for patients including, but not limited to, high efficacy in treating an illness, high specificity for a target receptor or antigen, wide therapeutic range, and limited, undesirable side effects (1). However, because of the fact that these molecules are complex and are often produced in host cell lines, bacteria, or fermentation reactors, these potential therapeutics exhibit significant heterogeneity that needs to be evaluated and characterized using various analytical techniques (2).
The complexity of such biomacromolecules can be easily illustrated by examining the structure of a typical monoclonal antibody as depicted in Figure 1.
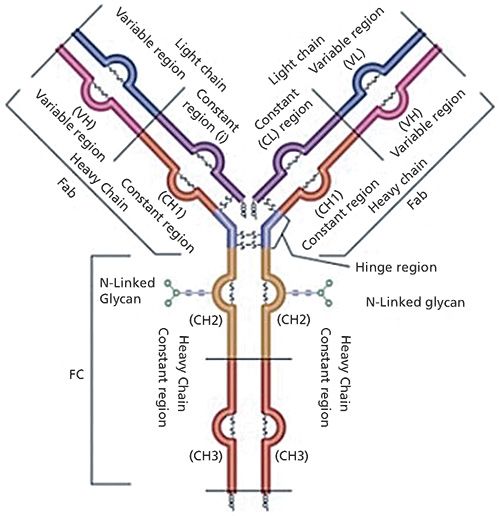
Figure 1: Graphic depiction of an IgG1 antibody. Note the structural complexity of the different domains of the mAb. (Courtesy of MilliporeSigma.)
Monoclonal antibodies are large, tetrameric immunoglobulin G (IgG) molecules with a molecular weight of approximately 150 kDa (150,000 g/mol). These molecules form a Y-shape composed of four peptide chains: two identical light (L) chains, with a molecular weight of approximately 25 kDa each, and two identical heavy (H) chains, with a molecular weight of approximately 50 kDa each. To form the Y-shape, these four polypeptide chains associate with each other through the creation of inter- and intrachain disulfide bonds. From a structural biology perspective, a monoclonal antibody can be broken down into two domains: the fragment crystallizable (Fc) domain, which is responsible for the effector function, and the antigen binding domain (Fab), which, as the name implies, is solely dedicated to binding the antigen to the antibody. Monoclonal antibodies are glycoproteins that have two conserved N-glycosylation sites in the Fc domain. A variety of other chemical and enzymatic modifications can further modify a monoclonal antibody, including methylation, phosphorylation, deamidation, oxidation, and conjugation to a cytotoxic, small-molecule drug (thus resulting in an antibody–drug conjugate [ADC]), among many others (3). Therefore, there could be thousands of variant combinations in a single mAb formulation, and some of these variants may elicit a lethal response in a patient. In addition to the above mentioned modifications to the primary structure of the mAb, modifications to the higher-order structure of the mAb may occur, such as aggregation or clipping, which will also affect the safety and efficacy of the therapeutic (4).
Because of the above-mentioned, inherent danger associated with the possible heterogeneity of these biologics, the Food and Drug Administration (FDA) and the European Medicines Agency (EMA) now require all biopharmaceutical manufacturing companies to submit a comprehensive report detailing the complete characterization of their submitted drug formulation. And because of this stringent requirement, the need for effective, sensitive, and robust analytical techniques to fully characterize these biomacromolecules is a key factor for the "biopharma" market to continue to thrive. This installment of "Column Watch" outlines several analytical chromatographic strategies that biopharmaceutical scientists can use to fully characterize novel biopharmaceuticals.
Size-Exclusion Chromatography
Size-exclusion chromatography (SEC) is a mode of chromatography that separates molecules by their size (that is, hydrodynamic radius). This mode of chromatography does not rely on the interaction of the analytes with a stationary-phase ligand; it is an entropic process meaning that it relies on the random flow of the analytes through the stationary-phase particles. For most practical purposes, this process can be envisioned as follows: Analytes with a higher molecular weight will be eluted earlier in the run, since these analytes are fully or partially excluded from the pores of the stationary phase particles, and lower molecular weight analytes will be eluted later in the run, since these analytes will spend more time navigating the torturous path through the particle (5).
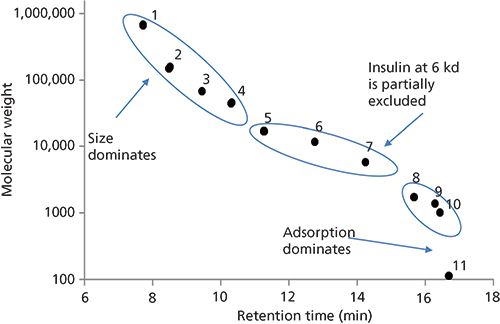
Figure 2: Molecular weight calibration curve for a series of proteins separated by SEC. Column: 30 cm × 4.6 mm, 3-µm dp Zenix SEC-150; mobile phase: 0.2 M sodium phosphate dibasic, adjusted to pH 7.0 with phosphoric acid; flow rate: 0.25 mL/min; column temperature: 25 °C; detection: UV absorbance at 215 nm; injection volume: 0.5 µL; sample: mixture of proteins from Table I (1 mg/mL in 0.2 M sodium phosphate dibasic, adjusted to pH 7.0 with phosphoric acid). (Adapted with permission from reference 6.)
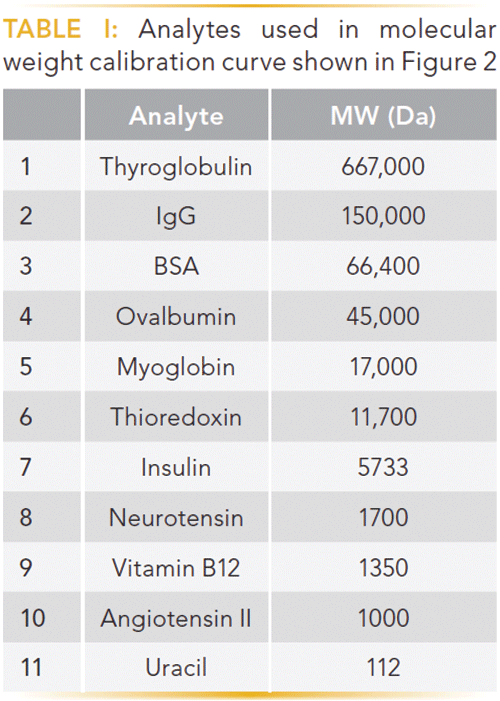
As noted in the prior paragraph, the driving force in SEC is the exclusion effect based on molecular weight and size. This exclusion effect is dictated by the pore diameter and geometry of the stationary-phase particle. Obviously, when selecting an SEC column (or any column, for that matter) for a separation experiment, one needs to be cognizant of the pore size of the particle. If the pore size of the particle is too small, the analytes of interest will not enter the particle and will be eluted in the void volume. For SEC of smaller proteins and peptides, particles with a pore diameter of 150 Å will provide a good linear separation range when creating a molecular weight calibration curve as depicted in Figure 2. Table I details the molecular weights of the analytes used in this study. As shown in Figure 2, proteins with molecular weights larger than approximately 50 kDa (analytes 1–3) begin to be excluded from the pores of the column, resulting in premature elution from the column, whereas analytes with molecular weights less than 5 kDa (analytes 8–11) interact more with the stationary phase and are eluted later in the run. To achieve the best chromatographic results with this column, one should operate in the linear region of the curve (analytes 5–7, with molecular weights 17 kDa–6 kDa) (6).
Recently, there have been some developments in the manufacturing and application of small particle size SEC columns for biomolecule separations. These new columns exist as 2.0-µm and sub-2-µm silica particles, enabling the biochromatographer to perform high efficiency separations in half the time as 3.0- and 4.0-µm particles. Recent studies (7) have shown the advantages of using small-particle SEC column technology.
In addition to recent advances in column technology, the mobile phase is also important to consider when performing SEC of biomolecules. One area of focus where the composition of the mobile phase will dictate success or failure in an SEC experiment is in characterizing ADCs by SEC. ADCs, because of the added cytotoxic drug payload, tend to exhibit secondary interactions with the stationary phase. These interactions will result in broad peak tailing and lower sensitivity of higher-order aggregates. One way to minimize these interactions is to add an organic alcohol (that is, isopropanol, 1-butanol, 1-propanol, and so forth) to the mobile phase. The addition of an alcohol modifier is thought to either mask surface silanols on the stationary phase or stabilize a particular fold of the protein, thereby reducing the heterogeneity of the analyte and allowing for the analyte to be eluted with a lower peak volume (8,9).
One last aspect of SEC that needs to be broached is the effect of salt and salt type in SEC. Salt is typically used in SEC to minimize electrostatic interactions between the analyte and charged sites on the silica stationary phase. Most SEC methods will use sodium or potassium phosphate (100–200 mM, pH 7.0–7.4) to perform the separation, though recent research has revealed that potassium salts may elicit better resolution of dimeric species (10). One problem with this salt, however, is that it is not compatible with mass spectrometry (MS) detection. Volatile salts, like ammonium formate, have been used to perform online SEC–MS for characterizing biotherapeutics. Figure 3 shows the deconvoluted MS spectral results of such a study, showing that SEC–MS could be used in drug-to-antibody ratio (DAR) characterization of an ADC (11).
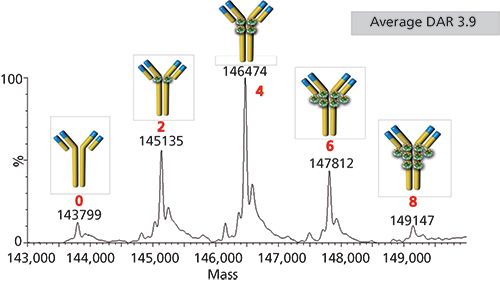
Figure 3: Native SEC–MS spectrum of the SigmaMAb ADC mimic. The difference in molecular weight between each main peak is 1336 Da, corresponding to the molecular weight of two payloads. Column: 30 cm × 2 mm, 4-µm dp TSKgel SuperSW 3000; mobile phase: 100 mM ammonium acetate, pH 7.0 (isocratic); flow rate: 0.07 mL/min; column temperature: 35 °C; detection: ESI-MS, 1000–8000 m/z; injection volume: 1.0 µL; sample: ADC mimic (100 µg/mL in 100 mM ammonium acetate, pH 7.0). (Adapted with permission from reference 11.)
Hydrophobic Interaction Chromatography
Hydrophobic interaction chromatography (HIC) is a mode of chromatography that separates analytes based on the degree of interaction between hydrophobic moieties on the analyte and hydrophobic ligands on the stationary phase. Under conditions of high concentrations of salt, the hydration layer around a protein may be disrupted to the extent that it becomes entropically favorable for hydrophobic regions of the protein's surface to interface with the nonpolar stationary phase. Because of the lower molecular weight and lower propensity for folding, HIC is typically not used for separating peptides. Salt selection in HIC is dictated by the Hofmeister series, which classifies cations and anions in terms of their ability to disrupt the hydration layer around a protein (chaotropic) or promote the formation of a hydration layer (kosmotropic). Typical salts in HIC are ammonium sulfate, potassium sulfate, and sodium sulfate.
The biggest application area currently under investigation for HIC is in determining the DAR profile of an ADC. The DAR profile is one critical quality attribute (CQA) that a biopharmaceutical company needs to determine for approval by the FDA or EMA. An overly conjugated ADC can kill healthy and carcinogenic cells, whereas an under-conjugated ADC may not be efficacious in killing carcinogenic cells. In cysteine-linked ADCs, where the linker and cytotoxic payload is conjugated through the sulfhydryl moiety of a cysteine amino acid, separation by HIC leads to a profile of peaks corresponding to zero, two, four, six, and eight drugs attached to the antibody. Figure 4 details such a separation scheme. The keen reader will note the presence of a peak between peaks 2 and 3; this peak corresponds to a DAR 3 species. Some researchers have brought forth the possibility that not being able to detect and quantify these odd-numbered DAR species could result in an underestimation of the average DAR for an ADC by as much as 3% (12).
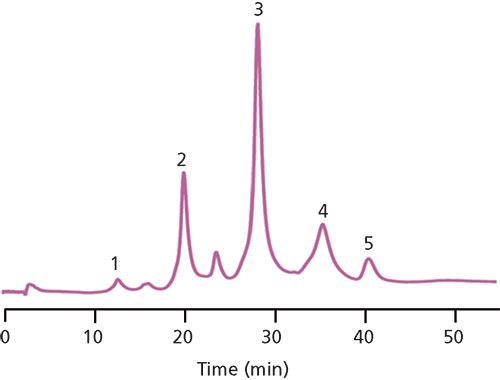
Figure 4: HIC–UV analysis of native SigmaMAb ADC mimic. Column: 10 cm × 4.6 mm, 2.5-µm dp TSKgel Butyl-NPR; mobile-phase A: 50 mM potassium phosphate, 1.5 M ammonium sulfate, pH 7.0, plus 5% (v/v) isopropyl alcohol; mobile-phase B: 50 mM potassium phosphate, pH 7.0, plus 20% (v/v) isopropyl alcohol; gradient: 0–100% B in 50 min; flow rate: 1.0 mL/min; column temperature: 35 °C; detection: UV absorbance at 215 nm; injection volume: 5.0 µL; sample: ADC mimic (100 µg/mL, 50 mM potassium phosphate, pH 7.0). Peaks: 1 = DAR 0 (native mAb); 2 = DAR 2; 3 = DAR 4; 4 = DAR 6; 5 = DAR 8. (Adapted with permission from reference 11.)
Figure 4 also shows the use of isopropyl alcohol in both mobile phases, essentially setting up an alcohol gradient. The reason for this inclusion is the same as was discussed with SEC: Some analytes tend to interact too strongly with the stationary phase and need the extra organic component to promote elution from the column. It should be noted here, though, that both SEC and HIC are considered native techniques, meaning that the structure and activity of the protein is preserved. However, using alcohols in the mobile phases increases the risk of these analytes being denatured. One should always check the stability of their analytes in dilute, organic solutions before incorporation in a chromatographic method (by using a technique such as sodium dodecyl sulfate polyacrylamide gel electrophoresis [SDS-PAGE]). Most proteins, in general, will be stable in solutions up to 35% organic solvent (13).
Ion-Exchange Chromatography
Ion-exchange chromatography is a mode of chromatography that separates analytes by charge. Proteins and peptides are amphoteric, which means that they exhibit both acidic and basic functionalities. The acidic portions of a protein include aspartic acid, glutamic acid, cysteine, tyrosine, and the α-carboxylate on the C-terminus. The basic portions of a protein include arginine, histidine, lysine, and the α-amine on the N-terminus. Charge variants of a biotherapeutic, another CQA that regulatory bodies require manufacturers to monitor, can be detected and resolved by ion-exchange chromatography. These charge variants can arise from mistranslation of messenger RNA (mRNA) transcripts and post-translational modifications such as deamidation, oxidation, or glycosylation, among others (14).
When choosing a column for an ion-exchange chromatography experiment, one needs to be aware of the isoelectric point (pI) of the native state of the protein. For example, most mAbs have a pI of ~7.4. If the pH of the mobile phase is lower than 7.4, the mAb will be positively charged and bind to a cation-exchange column. If the pH of the mobile phase is above 7.4, the mAb will be negatively charged and bind to an anion-exchange column. In addition to cation versus anion exchangers, these can be broken down into weak and strong exchangers based on the pKa for the exchanger.
There are two methods for eluting analytes off of an ion-exchange chromatography column: using a salt gradient and using a pH gradient. The salt gradient approach uses a linear gradient of a salt (that is, sodium chloride, potassium chloride, and so on) to essentially compete with the analyte binding to the column. Figure 5 shows a separation of different mAb charge variants, from a series of proprietary mAbs, by ion-exchange chromatography using a salt gradient (15).
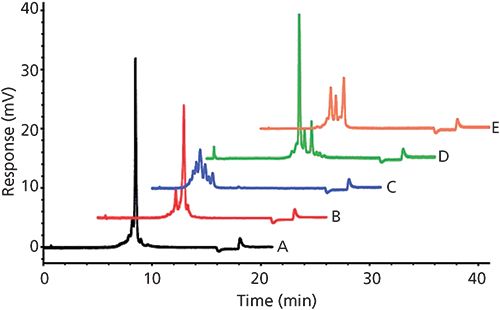
Figure 5: Analysis of mAb charge variants by weak cation exchange chromatography. Conditions: Column: 10 cm × 4.6 mm, 7-µm dp TSKgel CM-STAT; mobile-phase A: 20 mM 2-(N-morpholino)ethanesulfonic acid (MES) buffer, pH 6.0; mobile-phase B: 20 mM MES buffer, pH 6.0 + 0.5 M sodium chloride; gradient: 0-30% B in 15 min, 30-100% B in 2 min; flow rate: 1.0 mL/min; detection: UV absorbance at 280 nm; column temperature: 25 °C; injection volume: 20 µL; sample: mAbs A-E (1 g/L in 20 mM MES buffer, pH 6.0). (Adapted with permission from reference 15.)
The pH gradient approach uses a complex buffer system that gradually changes the pH of the mobile phase; this gradual pH change results in concomitant changes to the ionic state of the analytes and stationary phase ligands, which leads to elution of the analytes. There are negatives to each of these techniques; the salt gradient is not as effective at resolving similarly charged variants as a pH gradient method whereas a pH gradient requires a complex buffer system that may cause issues with method reproducibility. However, some vendors have made available off-the-shelf buffer solutions for pH gradient methods for resolving protein charge variants.
Hydrophilic Interaction Chromatography
Hydrophilic interaction chromatography (HILIC) is a mode of normal-phase chromatography in which the mobile phase is relatively nonpolar and the stationary phase is relatively polar. In HILIC, the strong solvent is water (or a low concentration buffer) and the analytes partition between an aqueous-enriched layer adsorbed on the stationary phase and the bulk mobile phase. Retention of analytes is mostly due to the amount of water adsorbed to the particle and the ionic strength of the buffer used in the mobile phase. Analytes are eluted off the column by gradually increasing the amount of water (buffer) in the mobile phase.
The key application area in the biopharmaceutical industry for HILIC is in glycan analysis, though recently there have been some publications focusing on the use of new, wide-pore HILIC columns for glycoprotein separations (16,17). The pattern of glycosylation is another CQA that biopharmaceutical manufacturers need to determine as dictated by regulatory agencies. Glycosylation can affect a protein's folding ability as well as its stability. More importantly, the pattern of glycosylation can affect the antibody's ability to bind antigens and promote antibody-dependent cellular cytotoxicity (ADCC) and complement-dependent cytotoxicity (CDC).
To determine the pattern of glycosylation on a potential biotherapeutic, generally one first releases the glycans from the protein using an enzyme such as PNGase F. Afterward, the released glycans are labeled with a fluorescent tag like 2-aminobenzamide or procainamide. The sample is then subjected to chromatographic analysis with either fluorescence detection or MS detection. Figure 6 shows chromatographic results of separating a mixture of N-linked glycans released from human IgG. Baseline resolution for all the individual glycans was observed, except for the positional isomers G1F and G1F'. The identities of these different glycans were confirmed by LC–MS.
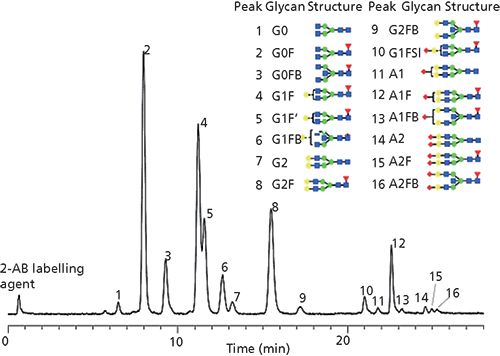
Figure 6: Analysis of N-linked glycans released from human IgG. Column: 15 cm × 2.1 mm, 2.7-µm dp BIOshell Glycan; mobile-phase A: 100 mM ammonium formate, pH 4.5; mobile-phase B: acetonitrile; gradient: 74-71% B in 15 min, 71-55% B in 10 min, 55-45% B in 1 min; flow rate: 0.4 mL/min; column temperature: 50 °C; detection: fluorescence, 260-nm excitation, 430-nm emission; injection volume: 3.0 µL; sample: released, 2-AB labeled glycans from human IgG (100 µg/mL in 30:70 100 mM ammonium formate, pH 4.5-acetonitrile).
Affinity Chromatography
Affinity chromatography is a mode of chromatography that relies on a specific interaction between the analyte of interest and the stationary-phase ligand. Ideally, no other component of the sample would interact with the ligand, thus only the analyte of interest interfaces with the stationary phase. Afterward, a second solution is passed through the column that breaks this interaction, thus eluting the analyte.
Protein A chromatography is the most common form of affinity chromatography used in the biopharmaceutical industry. Protein A is a 42-kDa surface protein found in the cell wall of Staphylococcus aureus. This protein binds specifically to the heavy chain in the Fc region of IgGs, making it an ideal mechanism to separate IgGs from other components of a sample. Most protein A columns are manufactured by immobilizing the protein on a porous, organic particle. However, a new, monolithic format for protein A chromatography has been produced, allowing for high sample throughput, at various flow rates, without sacrificing efficiency. Figure 7 shows the purification of IgG at different flow rates using a protein A monolith.
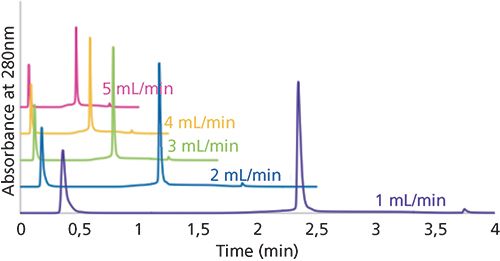
Figure 7: Purification of IgG using a protein A monolith at various flow rates. Column: 25 cm × 4.6 mm Chromolith Protein A; mobile-phase A: 100 mM sodium phosphate, pH 7.4; mobile-phase B: 100 mM sodium phosphate, pH 2.5; gradient (for 2-mL/min flow rate): 0% B for 0.25 min, increase to 100% B in 0.1 min, hold at 100% B for 1 min; flow rate: 2 mL/min; column temperature: 25 °C; detection: UV absorbance at 280 nm; injection volume: 10 µL; sample: IgG (1 g/L in 100 mM sodium phosphate, pH 7.4). (Figure courtesy of Dr. Egidijus Machtejevas.)
Reversed-Phase Chromatography
Reversed-phase chromatography is a mode of chromatography that separates analytes based primarily on hydrophobicity. Unlike HIC, reversed-phase chromatography uses a water–organic mixture for the mobile phase. There are several parameters that can be tuned in a reversed-phase chromatography experiment to get satisfactory peak shape and resolution; they have been reviewed in several recent publications (18,19).
Several wide-pore reversed-phase chromatography columns have been launched by column vendors over the past decade. These columns tend to fall into one of two categories: fully porous particle (FPP) packed columns and superficially porous particle (SPP) packed columns. SPP packed columns tend to provide more efficient separations because of better packing efficiencies of SPP columns as well as reduced longitudinal diffusion resulting from the presence of a solid silica core within the particle. Figure 8 showcases the advantages of using SPP packed columns compared to FPP packed columns in performing so-called "middle up/down" analysis of infliximab, a therapeutic mAb. Note the improved resolution and peak shape afforded by the 1000-Å SPP column.
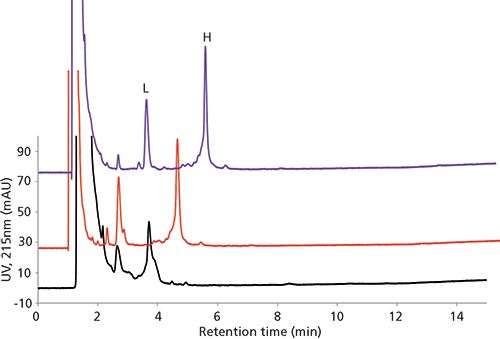
Figure 8: Middle up-down analysis of infliximab. L and H represent light and heavy chain, respectively. Columns: 10 cm × 2.1 mm, 1.7-µm dp (FPP, black), 3.4-µm dp (SPP, 400 Å, red), 2.7-µm dp (SPP, 1000 Å, purple); mobile-phase A: 70:30 water (0.1% [v/v] trifluoroacetic acid)-acetonitrile (0.1% [v/v] trifluoroacetic acid); mobile-phase B: 50:50 water (0.1% [v/v] trifluoroacetic acid)-acetonitrile (0.1% [v/v] trifluoroacetic acid); gradient: 20-50% B in 10 min, 50-100% B in 5 min; flow rate: 0.2 mL/min; column temperature: 75 °C; detection: UV absorbance at 215 nm; injection volume: 5.0 µL; sample: reduced infliximab (100 µg/mL in water with 0.05% trifluoroacetic acid).
Another key aspect in reversed-phase chromatography of biomacromolecules is the use of an ion-pair reagent in the mobile phase. Generally, trifluoroacetic acid has been used as a good ion-pair reagent because it masks interactions between the analytes and free, active silanols on the stationary phase. However, this ion-pair reagent can cause severe ion suppression when coupled to MS detection. Therefore, alternatives, like difluoroacetic acid and ammonium formate, should be used for MS analyses because they tend to provide good ion-pairing capacity while minimizing ion suppression. Figure 9 shows a comparative study of these two ion-pairing reagents in separating a series of insulin variants. Note the ~2.7-fold increase in sensitivity using ammonium formate (20).
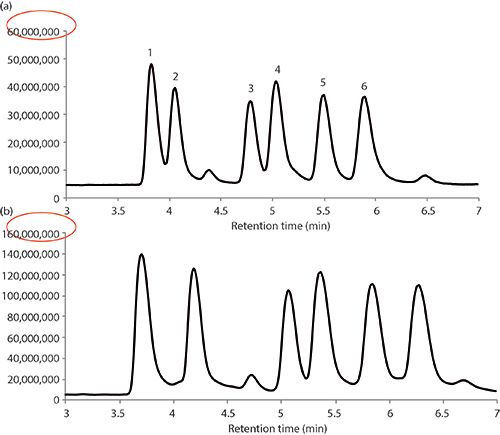
Figure 9: Separation of insulin variants by LC–MS using various mobile-phase modifiers: (a) difluoroacetic acid method, (b) ammonium formate method. Column: 15 cm × 2.1 mm, 2.7-µm dp BIOshell A160 Peptide C18; mobile-phase A: 75:25 10 mM ammonium formate, adjusted to pH 2.6 with formic acid or water (0.1% [v/v] difluoroacetic acid)-acetonitrile; mobile-phase B: 50:50 10 mM ammonium formate, adjusted to pH 2.6 with formic acid or water (0.1% [v/v] difluoroacetic acid)-acetonitrile (77:23 A:B); flow rate: 0.2 mL/min; column temperature: 75 °C; detection: MS, ESI-(+), TIC 100–3000 m/z; injection volume: 0.5 µL; sample: mixture of six insulin variants (100 µg/mL in 10 mM ammonium formate, adjusted to pH 2.6 with formic acid). Peaks: 1 = insulin-glargine, 2 = insulin-bovine, 3 = insulin-Asp, 4 = insulin-LisPro, 5 = insulin-human, 6 = insulin-porcine. (Adapted with permission from reference 20.)
Conclusion
Analytical scientists have myriad options in separating and purifying biomacromolecules. The choice of technique is dependent on what the end goal of the experiment is. If the researcher wants an active, native form of the protein, then a nondenaturing method is required (SEC, ion exchange, HIC, affinity). If the researcher is using MS detection or does not need the active, native state of the protein, then a denaturing technique can be used (reversed-phase chromatography, HILIC). It is also becoming commonplace to couple two of these techniques in series to perform two-dimensional (2D)-LC. As the complexity of biotherapeutics increases, and regulatory requirements become more stringent, the continued need for new column technologies and methods will persist.
References
(1) A.J. Chirino and A. Mire-Sluis, Nat. Biotechnol. 22, 1383–1391 (2004).
(2) K. Sandra, I. Vandenheede, and P. Sandra, J. Chromatogr. A 1335, 81–103 (2014).
(3) H. Liu, G. Ponniah, H.M. Zhang, C. Nowak, A. Neill, N. Gonzalez-Lopez, R. Patel, G. Cheng, A.Z. Kita, and B. Andrien, mAbs 6, 1145–1154 (2014).
(4) A. Beck, E. Wagner-Rousset, D. Ayoub, A. Van Dorsselaer, and S. Sanglier-Cianferani, Anal. Chem. 85, 715–736 (2013).
(5) J.H. Knox, High Performance Liquid Chromatography (Edinburgh University Press, 1978).
(6) R.A. Henry and S. Schuster, "Impact of Pore Exclusion on Reversed-Phase HPLC Column Performance," presented at the Eastern Analytical Symposium (EAS 2016), Somerset, New Jersey, 2016.
(7) H.K. Brandes, S. Shollenberger, and C.E. Muraco, Reporter 34.3, 33–34 (2016).
(8) X.M. Lu, K. Benedek, and B.L. Karger, J. Chromatogr. A 359, 19–29 (1986).
(9) S. Fekete, S. Rudaz, J. Veuthey, and D. Guillarme, J. Sep. Sci. 35, 3113–3123 (2012).
(10) A. Goyon, A. Beck, J. Veuthey, D. Guillarme, and S. Fekete, J. Pharm. Biomed. Anal. 144, 242–251 (2017).
(11) C.E. Muraco, K. Ray, G. Oden, and D.S. Bell, "Using All the Tools in the Toolbox: Characterization of a Novel Antibody-Drug Conjugate Mimic by Several Modes of Chromatography," presented at the International Symposium on the Separation of Proteins, Peptides, and Polynucleotides (ISPPP 2017), Philadelphia, Pennsylvania, 2017.
(12) B. Bobaly, G.M. Randazzo, S. Rudaz, D. Guillarme, and S. Fekete, J. Chromatogr. A 1481, 82–91, (2017).
(13) C.N. Pace, S. Trevino, E. Prabhakaran, and J.M. Scholtz, Phil. Trans. R. Soc. Lond. B 359, 1225–1235 (2004).
(14) E. Wagner-Rousset, S. Fekete, L. Morel-Chevillet, O. Colas, N. Corvaia, S. Cianferani, D. Guillarme, and A. Beck, J. Chromatogr. A 1498, 147–154 (2017).
(15) R. Romling, Reporter 29.3, 20–21 (2011).
(16) V. D'Atri, S. Fekete, A. Beck, M. Lauber, and D. Guillarme, Anal. Chem. 89, 2086–2092 (2017).
(17) A. Periat, S. Fekete, A. Cusumano, J. Veuthey, A. Beck, M. Lauber, and D. Guillarme, J. Chromatogr. A 1448, 81–92 (2016).
(18) A. Beck, S. Cianferani, and A. Van Dorsselaer, Anal. Chem. 84, 4637–4646 (2012).
(19) A. Beck, G. Terral, F. Debaene, E. Wagner-Rousset, J. Marcoux, M.C. Janin-Bussat, O. Colas, A. Van Dorsselaer, and S. Cianferani, Expert Rev. Proteomics 13, 1–26 (2016).
(20) C.E. Muraco, S. Shollenberger, and H.K. Brandes, "Reversed-Phase HPLC Analysis of Insulin Variants and Analogs by UV and Mass Spectral Detection," presented at the American Association of Pharmaceutical Scientists National Biotechnology Conference (AAPS NBC 2016), Boston, Massachusetts, 2016.
ABOUT THE AUTHOR
"Cory E. Muraco"

Cory E. Muraco is a Senior Scientist at MilliporeSigma. Cory received his Master's in Science in Chemistry from Youngstown State University in 2013. His current research interests are in furthering the understanding of the interaction mechanisms between solid supports and large biomacromolecules and developing new stationary phases for HPLC and UHPLC columns and solid-phase microextraction (SPME) technologies.
ABOUT THE COLUMN EDITOR
"David S. Bell"

"David S. Bell" is a manager in Separations Technology and Workflow Development at MilliporeSigma (formerly Sigma-Aldrich/Supelco). With a B.S. degree from SUNY Plattsburgh and a PhD in Analytical Chemistry from The Pennsylvania State University, Dave spent the first decade of his career within the pharmaceutical industry performing analytical method development using various forms of chromatography and electrophoresis. During the past 20 years, working directly in the chromatography industry, Dave has focused his efforts on the design, development, and application of stationary phases for use in HPLC and hyphenated techniques. In his current role at MilliporeSigma, Dr. Bell's main focus has been to research, publish, and present on the topic of molecular interactions that contribute to retention and selectivity in an array of chromatographic processes. Direct correspondence to: LCGCedit@ubm.com

Perspectives in Hydrophobic Interaction Temperature- Responsive Liquid Chromatography (TRLC)
TRLC can obtain separations similar to those of reversed-phase LC while using only water as the mobile phase.


