Real-Time Profiling of Volatile Malt Aldehydes Using Selected Ion Flow Tube Mass Spectrometry
LCGC North America
The authors use headspace SIFT-MS to target and identify volatiles in various malt aldehydes. The specificity and speed are compared to current methodology.
Jessika De Clippeleer,* Filip Van Opstaele,* Joeri Vercammen,† Gregory J. Francis,‡ Luc De Cooman,* and Guido Aerts*
*KaHo St-Lieven, Laboratory of Enzyme, Fermentation, and Brewing, Ghent, Belgium.
†Interscience Expert Center, Louvain-la-Neuve, Belgium.
‡Syft Techologies UK, Warrington, UK.
Direct Correspondence to: jessika.declippeleer@kahosl.be.
Malt, the main raw material for beer production, is made from selected cereal grain, usually barley (Hordeum vulgare L.), by steeping, germination, and drying (kilning). By varying the processing parameters during germination and drying, various types of malt are obtained (1). The strong influence of malt composition on final beer quality and beer flavor stability is generally acknowledged (2–4). In particular, flavor stability remains one of the main quality criteria for beer, and the urgency to control it is endorsed by the global beer market and its allied need for longer storage times for exported beer.
Formation and release of volatile aldehydes is recognised as one of the main causes of beer flavor deterioration upon storage (5–7). Most of these compounds pre-exist abundantly in malt, and can vary significantly between different malt types. As such, the staling potential of finished beer is determined largely by the type of malt used in the brewing process (8–12). Therefore, each modern brewery that aims at a pleasant and consistent beer flavor has to take appropriate measures from the onset of the brewing process by selecting high-quality malt. Consequently, knowledge of malt aldehyde content is indispensable for brewers in view of quality control, selection of the appropriate malt variety, and objective assessment of flavor stability of the processed beer.
Different procedures have been applied to isolate carbonyl compounds from malt (13,14). Their isolation from the complex malt matrix is far from easy and requires an appropriate sample preparation procedure. Traditional extraction techniques such as vacuum distillation or continuous steam distillation–solvent extraction (that is, Likens–Nickerson extraction) with subsequent Kuderna–Danish evaporation before gas chromatography (GC) analysis, are very cumbersome and time-consuming (15,16). To increase throughput and selectivity and maintain sensitivity, headspace analysis, preferably in combination with solid-phase microextraction (SPME), is the method of choice (16). SPME is a well-known sample preparation technique that is solvent-free, fast, inexpensive, easily amenable to GC, and has proven to be extremely powerful for analyzing volatile as well as semivolatile compounds at trace and ultratrace levels (17).
Unfortunately, headspace SPME of malt and beer samples suffers from the interference of other compounds that are abundant in the matrix. To eliminate these interferences, SPME of aldehydes generally is carried out in combination with a selective extraction, on-fiber derivatization, for example, with o-(2,3,4,5,6-pentafluorobenzyl)hydroxyl-amine (PFBHA) (18–20). Converting the aldehydes to their pentafluorobenzylhydroxylamine derivatives is not only beneficial with respect to extraction selectivity but also has a positive effect on GC performance. Additional effects, which are due predominately to the nature of the SPME procedure — that is, equilibrium extraction — and which hamper accurate quantification, require the use of internal standards and standard addition, which complicates the overall procedure even further. Moreover, milling and exposure to ambient air during sample preparation and extraction induces the pro-oxidative enzyme potential of malt, which leads to the formation of unwanted artifacts and a severe risk of biased results.
Selected ion flow tube mass spectrometry (SIFT-MS) is an analytical technique that is based upon soft chemical ionization taking place in a flow tube reactor. First introduced by Smith and Spanel, SIFT-MS is now an established technique for volatile organic compound (VOC) analysis that has advantages over many other analytical approaches (21). SIFT-MS provides a quantitative measure of analytes in air mixtures in real time at sensitivities in the low parts-per-billion (ppb) level, and more recently, the parts-per-trillion (ppt) level without the need for external calibration (absolute quantification) (22,23). These very low quantification limits are enabled by a thorough understanding of the chemical kinetics of an analyte with each of the SIFT-MS reagent ions H3O+, NO+, and O2+ (21,24).
Initially, the instrumentation used to exploit the SIFT-MS technique was large and cumbersome and only able to be operated by highly skilled laboratory scientists. Furthermore, early SIFT-MS instruments had very poor limits of detection due to low ion currents. New instrumentation specifically designed for quantitative measurements often will generate total ion signals greater than 2 × 10⁷ cps, which leads to routine measurements in the parts-per-trillion range being possible (23,25,26).
To properly utilize SIFT-MS as an analytical technique, at a level that will provide analyte quantification, requires knowledge of rate coefficients, product ion channels and their respective branching ratios, reactions of the water cluster ions with the analyte, and secondary reactions of major product ions with H2O. Currently, the database of this knowledge contains over 400 compounds that can be quantified by SIFT-MS without the need for an external calibrant.
A unique feature of SIFT-MS is its ability to quickly and directly analyze the headspace samples mentioned earlier, without requiring specific sample preparation or derivatization techniques. Moreover, the use of three reagent ions, generally, creates sufficient selectivity for real-time analysis without the need for (time-consuming) chromatographic separations. The SIFT-MS application range is already very broad and is still broadening as this article goes to press. Applications such as breath analysis (21,27), environmental monitoring (28), oil exploration (29), ambient air monitoring for occupational safety and health (30), and the detection of chemical warfare agents (26) and peroxide-based explosives (31) have been published recently.
In this article, we present our results on the evaluation of dynamic headspace SIFT-MS to discern volatile profiles and composition of various malted barley cultivars. Prime focus is on the analysis of aldehydes and particularly as compared to the headspace SPME procedure currently used.
Experimental
Reagents: All chemicals were purchased from Sigma-Aldrich (St. Louis, Missouri) at the highest purity available.
Malt Samples: Five different malt samples were used during this study. All were produced from barley on industrial scale, and referred to as A, B1, B2, B3, and C. Three different barley cultivars were distinguished: A, B and C. From the single-variety industrial malt B, three different harvest years were studied — B1, B2, and B3. Samples A, B1, B2, and B3 were supplied by the same malting plant.
Headspace SPME GC–MS Analysis: Volatile aldehydes in malt were quantitatively determined according to Vesely and colleagues (19). Extraction of marker aldehydes from CO2-milled malt samples (0.25 g in 10 mL water) was performed by headspace SPME with on-fiber PFBHA derivatization using a 65-μm PDMS-DVB coated fiber (Supelco, Bellefonte, Pennsylvania). The PFBHA (1 g/L) was loaded during 10 min at 50 °C, after which extraction and derivatisation was carried out for 30 min. The carbonyl derivatives were analyzed using a TraceGC/DSQ II GC–MS system (Thermo Fisher Scientific, Madison, Wisconsin) purchased at Interscience (Louvain-la-Neuve, Belgium). The system was equipped with a CTC CombiPAL autosampler, a split–splitless injector with narrow-bore glass inlet liner, and an RTX-1 fused-silica capillary column (40 m × 0.18 mm, 0.2-μm film thickness, Restek). Helium was used as carrier gas at 0.8 mL/min. The inlet temperature was set at 250 °C, and injection was carried out in split mode (split ratio 50:1). The oven temperature was kept at 50 °C for 2 min, then raised to 210 °C at 6 °C/min, followed by an increase to 250 °C at 15 °C/min, and finally held at 250 °C for 5 min. The MS transfer line was set at 260 °C. Ionization of the carbonyl derivatives was obtained by electron ionization and the main fragment ion (m/z = 181) was detected in the single ion monitoring scan mode (19). Data were processed with XCalibur software (Thermo Fisher Scientific).
SIFT-MS Analysis: A commercial SIFT-MS instrument (Voice200, Syft Technologies, Christchurch, New Zealand), was used for this work. The system was equipped with a direct inlet and a heated external interface, which provided direct entry to the flow tube. The external interface was Siltek treated (Restek) to minimize activity.
Target compounds were analyzed using selected ion mode (SIM). Here, abundance is derived from the measured signal intensity at the specific product ion masses. The following compounds were targeted: 2,3-butanedione, formaldehyde, acetaldehyde, hexanal, trans-2-pentenal, trans-2-hexenal, trans-2-heptenal, trans-2-octenal, trans-2-nonenal, trans,trans-2,4-decadienal, 2-methylpropanal, 2-methylbutanal, 3-methylbutanal, methional, phenylacetaldehyde, benzaldehyde, and furfural. All relevant instrumental settings, target and product ions, monitored reactions, and branching ratios are summarized in Table I. The majority of the data was obtained from a proprietary compound library database included with the instrument (25). Care was taken not to induce any conflicts in selecting target product ion masses. Soft ionization with minimal fragmentation in combination with three readily available reagent ions offers sufficient selectivity to discern between most isobaric compounds, for example trans-2-hexenal and furfural. Of course, this selectivity is not ultimate, such as with 2-methylbutanal and 3-methylbutanal, two isomers that could not be discerned from each other.
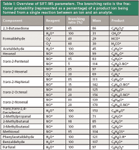
Table I: Overview of SIFT-MS parameters. The branching ratio is the fractional probability (represented as a percentage) of a product ion being formed from a single reaction between an ion and an analyte.
Static Headspace SIFT-MS Analysis: Static headspace analyses were carried out with a CTC CombiPAL autosampler (Thermo Fisher). The system was installed on a TraceGC system (Thermo Fisher), which was equipped with a standard split–splitless injector with a laminar cup liner. Due to the size and weight of the SIFT-MS instrument (900 × 725 × 875 mm, 212 kg), the SIFT-MS system had to be placed on the laboratory floor, close to the GC system. Hyphenation was achieved by means of the instrument's heated external interface, which entered the GC oven at the left-hand side, similar to a regular benchtop MS. The SIFT-MS and GC–MS instruments were connected directly to each other without any restriction installed in the heated external interface, by means of a piece of 5-m of deactivated fused-silica capillary tubing (Siltek 0.25 mm i.d., Restek). During analysis, the split–splitless injector, GC oven, and heated external interface were kept at 200 °C. Carrier gas was helium at 70 kPa, which corresponded with a flow rate of 10 mL/min. Injections were made in splitless mode.
Ungrounded malt grains (±5 g) were placed in a 20-mL headspace vial, capped, and subsequently placed on the autosampler tray. A blank sample was prepared by analyzing an empty vial (laboratory air). All samples were equilibrated at 50 °C or 75 °C for 10 min. Afterwards, part of the headspace was sampled by means of a gastight syringe (2.5 mL, Hamilton, Reno, Nevada) and transferred to the split–splitless injector. Other headspace conditions were set as follows: syringe temperature, 150 °C; agitation speed, 500 rpm; syringe fill speed, 100 μL/s; injection volume, 2.5 mL; and injection speed, 10 μL/s.
Dynamic Headspace SIFT-MS Analysis: Volatile emissions from ungrounded malt grains were sampled with a microchamber–thermal extractor (μ-CTE, Markes International, Llantrisant, UK). The system consisted of six Siltek-treated stainless steel sample containers (44 mL capacity each), which could be sealed from exterior air to prevent contamination from occurring. Usually, the microchamber–thermal extractor is used as a miniaturized alternative to carry out material emission testing. Therefore, the entire assembly is fed with a constant flow of (inert) gas and brought to high temperature (120 °C max). At the same time, each active sample container is fitted with a thermal desorption tube, which is filled with an appropriate packing material to enrich the released volatiles. Afterwards, compounds are removed from the tube by means of thermal desorption or another appropriate technique.
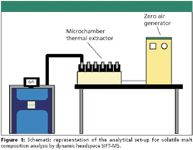
Figure 1
A schematic representation of the analytical set-up for volatile malt composition analysis with the SIFT-MS instrument and the microchamber–thermal extractor for dynamic headspace sampling is depicted in Figure 1. Practical hyphenation between both instruments was achieved by connecting the SIFT-MS instrument heated external interface with the outlet of the microchamber–thermal extractor sample container. To achieve this, a small piece of an empty thermal desorption tube was connected to the external interface by means of a ¼-in. nut and ferrule. The metal frit, which normally is used to secure the packing material, was left in place to serve as a filter to prevent small dust particles from entering the flow tube. Contrary to the static headspace set-up, the external interface was furnished with an internal restriction to control and reduce the flow towards the flow tube. The restriction reduced the flow to 10 mL/min and simplified handling, which permitted easy changeover from container to container without vacuum disturbance. A schematic drawing of the interface and a representation when in use are given in Figure 2. Approximately 25 g of malt was used for analysis. During sampling, the microchamber–thermal extractor was kept at 50 °C, while the flow rate was set at 10 mL/min (nitrogen). The total test time was 20 min — 10 min equilibration and 10 min actual data acquisition.
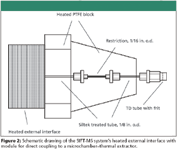
Figure 2
Principal Component Analysis: Principal component analysis (PCA) was performed for interpretation of the results in a statistical way. PCA is a projection method (bilinear modeling method) that offers an interpretable overview of the main information in a multidimensional data table. The information carried by the original variables is projected onto a smaller number of underlying variables (principal components). The first principal component (PC1) covers as much of the variation in the data as possible. The second principal component (PC2) is orthogonal to the first and covers as much of the remaining variation as possible, and so on. The result of PCA is displayed graphically to facilitate the identification of patterns in data and to detect interrelationships between different variables.
In this study, PCA was used for differentiation of the different malt samples on the basis of particular compounds in their volatile analytical pattern, which was obtained by headspace SPME GC–MS and by dynamic headspace SIFT-MS, respectively. PCA was done by means of multivariate data analysis software (The Unscrambler v9.2, CAMO, Oslo, Norway).
Results and Discussion
Headspace SPME GC–MS Analysis: Quantitative profiling of aldehyde markers was performed on all malt samples A, B1, B2, B3, and C according to Vesely and colleagues (19) by headspace SPME with on-fiber PFBHA derivatization and capillary GC in combination with a quadrupole mass spectrometer operating in the single ion monitoring mode (m/z = 181; see Experimental section). The investigated aldehyde markers can be classified into Strecker degradation aldehydes (2-methylpropanal, 2- and 3-methylbutanal, methional, benzaldehyde, and phenylacetaldehyde), aldehydes formed during Maillard reactions (furfural) and lipid oxidation aldehydes (hexanal and trans-2-nonenal). These compounds are to be regarded as true markers for flavor instability of beer and are determined on a routine basis (32).
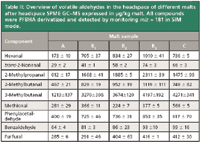
Table II: Overview of volatile aldehydes in the headspace of different malts after headspace SPME GCâMS expressed in µg/kg malt. All compounds were PFBHA derivatized and detected by monitoring m/z = 181 in SIM mode.
The quantitative results summarized in Table II are the mean values of two measurements with coefficients of variation situated between 0.2% and 25%. The malted barley cultivar A has a relatively low content of aldehyde markers compared with the cultivars B and C. Different crops from the same barley cultivar B, referred to as B1, B2, and B3, vary considerably in their aldehyde concentrations. The aldehyde profile of variety C is characterized by a high concentration of 3-methylbutanal and methional.
In order to visualize the differentiation of the malt samples, the quantitative headspace SPME GC–MS data were processed with a multivariate data analysis software package described earlier (CAMO). The biplot as depicted in Figure 3 is the result of PCA on the data matrix composed of the different malt samples (objects) and the measured volatiles (variables) in each sample. The two first principal components explain 94% (PC1 78%, PC2 16%) of the total variance. Based upon their volatile composition, the various malt varieties A, B, and C are differentiated clearly by means of PCA. Malt A was characterized by the substantially lower concentrations of the selected aldehyde markers than were found for malt samples B and C. Malt C is differentiated from the other malt varieties by its higher amount of methional present. From malt variety B, harvest year B1 is distinguished from B2 and B3 because lower concentrations were measured for this crop.
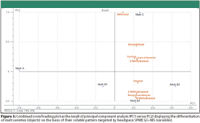
Figure 3
On the basis of quantitative GC–MS profiling of the selected aldehyde markers, clear classification of the malt samples was obtained by visualization of the data matrix by PCA. To evaluate the true potential of headspace SIFT-MS, the headspace SPME GC–MS analyses on the various malt varieties as described earlier were repeated using this innovative technique of real-time measurement. It was verified by multivariate data analysis that an equivalent differentiation of the various malt varieties can be obtained on the basis of their headspace profiles acquired by SIFT-MS.
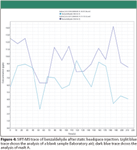
Figure 4
Static Headspace SIFT-MS Analysis: Static headspace injection is by far the easiest way for automated analysis of volatile components by means of SIFT-MS. In the first test to determine overall method performance and sensitivity, malt type A was analyzed. Therefore, ungrounded malt grains were weighed into a headspace vial, equilibrated and analyzed. In total, 17 carbonyl compounds were measured, including the marker aldehydes determined by headspace SPME GC–MS. As an illustration, the resulting SIFT-MS trace for benzaldehyde after 10 min equilibration at 50 °C is depicted in Figure 4. The results of the other compounds are summarized in the bar graph in Figure 5. Compared to the blank analysis, of which the results also are depicted in Figures 4 and 5, only minor differences can be discerned. To increase the response of the target compounds, the extraction temperature was increased to 75 °C (see Figure 5). As expected, this led to a proportional increase in signal intensity for some of the volatile components, such as acetaldehyde, hexanal, furfural, 2,3-butanedione, 2-methylpropanal, 2-methylbutanal, and 3-methylbutanal. The perceived response increase, however, is not necessarily due to the elevated extraction temperature alone, but also is affected by the induction of oxidative processes and heat load, which creates artifacts. To avoid these oxidative reactions during analysis, sampling temperature is, preferably, kept as low as possible. As a result, static headspace injection was not considered a valuable injection technique for the analysis of aldehydes in malt.
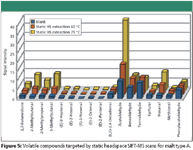
Figure 5
Dynamic Headspace SIFT-MS Analysis: When directly analyzing the headspace of intricate samples such as malt, the sampling technique used in combination with SIFT-MS is of vital importance. Because the static headspace analyses did not produce significant levels of target volatiles, the experiment was repeated using dynamic headspace SIFT-MS. Compared to the static headspace procedure discussed earlier, dynamic headspace extraction with the microchamber–thermal extractor uses a substantially higher amount of material (25 g versus 5 g). As a result, higher absolute responses are obtained easily without the need to increase extraction temperature and without inducing stress-related emissions.
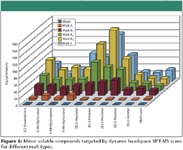
Figure 6
Dynamic headspace SIFT-MS was applied to the analysis of the target volatiles in all malted barley samples. Figures 6 and 7 show qualitative data for the less and more abundant volatiles, respectively. Each result is the mean of two replicate measurements with coefficients of variation situated between 0.5% and 15%. As can be deduced from both figures, headspace profiles clearly differ between malt variety as well as harvest year. For example, malt sample A is characterized by low levels of aldehydes and other target volatiles, and was received from the same malting plant as malt samples B1, B2, and B3, but produced from a different barley cultivar. Depending on harvest year, the signal intensity of the target compounds varied substantially, as illustrated by malt samples B1, B2, and B3. All originated from the same barley cultivar, but from different crops. Malt sample C was produced from a different barley variety than A and B, and malted by another malting plant, which expressed itself in a dissimilar headspace profile. Phenylacetaldehyde and benzaldehyde showed the highest signal intensities in malt samples B1, B2, B3, and C. Obviously, malt sample A, which was characterized by only a limited number of abundant compounds, shows the lowest signal intensities for all detected volatiles. Knowledge of these variations in headspace profiles among various malted barley types, varieties, and harvest years is of great interest to many commercial users. Indeed, many of these compounds are described in literature as key odorants in barley and malted barley, and both the organoleptic quality of beers and their flavor stability during aging are affected by them (33–35).
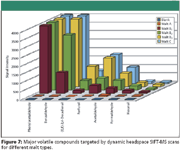
Figure 7
The SIFT-MS results for the aldehyde markers are in accordance with the headspace SPME results earlier described. To verify the grouping of different malt varieties by PCA as was obtained with headspace SPME GC–MS, the dynamic headspace SIFT-MS data were processed with the multivariate data analysis software. To compare the results, the data matrix for PCA was composed of only the measured volatiles 2-methylpropanal, 2- and 3-methylbutanal, methional, benzaldehyde, phenylacetaldehyde, furfural, hexanal, and trans-2-nonenal (variables) in each of the malt samples (objects). Figure 8 represents the combined score–loading plot (biplot). Based upon the headspace profiles as acquired by SIFT-MS, this biplot bears comparison with the PCA-plot as was obtained previously from the headspace SPME GC–MS results depicted in Figure 3. Next to a similar, significant classification of the malt samples, Figure 8 also displays good reproducibility of the SIFT-MS results and exhibits that 95% of the total variance is explained by PC1 (79%) and PC2 (16%). The biplot in Figure 8 clearly visualizes the high potential of the SIFT analysis for a fast classification of the different malt samples on the basis of the selected measured volatiles. Moreover, this technique allows real-time measurement of substantially more volatiles than is done with headspace SPME GC–MS.
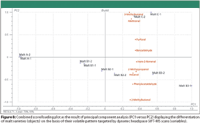
Figure 8
Conclusion
The objective of this study was to distinguish malt varieties on the basis of their headspace profiles by means of headspace SIFT-MS. A broad range of volatiles were identified readily by direct analysis of malt headspaces without sample preparation, derivatization, or chromatographic preseparation. Cycle time per individual sample could, therefore, be reduced to 10 min, which is substantially lower than the more commonly applied technologies.
The results demonstrate the potential of SIFT-MS for profiling different malts on the basis of their volatile composition (profiling) and for detecting the volatiles associated with malt quality (quality control, cultivar selection).
Acknowledgment
Jo Vervenne (Interscience, Belgium) is gratefully acknowledged for providing the instrument to perform the SIFT-MS experiments.
The authors are also grateful to Silke Poiz (KaHo Sint-Lieven, Belgium) for performing the headspace SPME GC–MS experiments on the different malt samples.
References
(1) C. Forster, H. Miedaner, L. Narziss and W. Back, in Proceedings of the 25th European Brewery Convention Congress, Brussels (Oxford University Press, New York, 1995), pp. 475–482.
(2) P. Boivin, in Monograph 31 of the European Brewery Convention Symposium "Flavor and Flavor Stability," Nancy, (Fachverlach Hans Carl, Nürnberg, Germany, 2001), Contribution 1.
(3) M. Gastl, E. Spieleder, M. Hermann, F. Thiele, F. Burberg, A. Kogin, H. Ikeda, W. Back, and L. Narziss, Monatsschrift für Brauwissenschaft 59, 163–174 (2006).
(4) L.F. Guido, A.F. Curto, P. Boivin, N. Benismail, C.R. Gonçalves, and A.A. Barros, J. Agric. Food Chem. 55, 728–733 (2007).
(5) K. Wackerbauer and R. Hardt, Brauwelt Int. 4, 320–327 (1997).
(6) C.W. Bamforth, MBAA, Tech. Quart. 41, 97-103 (2004).
(7) B. Vanderhaegen, H. Neven, H. Verachtert, and G. Derdelinckx, Food Chem. 95, 357–381 (2006).
(8) J. Van Waesberghe, G. Aerts, and L. De Cooman, in Monograph 31 of the European Brewery Convention Symposium "Flavor and Flavor Stability," Nancy (Fachverlach Hans Carl, Nürnberg, Germany, 2001), Contribution 6.
(9) J.W.M. van Waesberghe, Brauwelt Int. 20, 375–378 (2002).
(10) B. Skadhauge, S. Knudsen, F. Lok, and O. Olsen, in Proceedings of the 30th European Brewery Convention Congress, Prague (Fachverlach Hans Carl, Nürnberg, Germany, 2005), Contribution 76.
(11) L.F. Guido, P. Boivin, N. Benismail, C.R. Gonçalves, and A.A. Barros, in Proceedings of the 30th European Brewery Convention Congress, Prague (Fachverlach Hans Carl, Nürnberg, Germany, 2005), Contribution 77.
(12) A. Stephan, M. Kusche, and G. Stettner, in Proceedings of the 31st European Brewery Convention Congress, Venice (Fachverlach Hans Carl, Nürnberg, Germany, 2007), Contribution 99.
(13) A.D. Beal and D.S. Mottram, J. Agric. Food Chem. 42, 2880–2884 (1994).
(14) B. Fickert and P. Schieberle, Nahrung 42, S. 371–375 (1998).
(15) J.A. Maga, J. Agric. Food Chem. 26, 175–178 (1978).
(16) B. Plutowska and W. Wardencki, Food Chem. 101, 845–872 (2007).
(17) J. Pawliszyn, in Solid Phase Microextraction: Theory and Practice (Wiley-VCH, Germany, 1997).
(18) M. Ojala, T. Kotiaho, J. Siirilä, and M.L. Sihvonen, Talanta 41, 1297–1309 (1994).
(19) P. Vesely, L. Lusk, G. Basarova, J. Seabrooks, and D. Ryder, J. Agric. Food Chem. 51, 6941–6944 (2003).
(20) H.H. Jelen, A. Dabrowska, D.K. Lensporf, J. Nawrocki, and E. Wasowicz, Chem. Anal. 49, 869–880 (2004).
(21) P. Spanel and D. Smith, Med. Biol. Eng. Comput. 34, 409–419 (1996).
(22) D. Smith and P. Spanel, Mass Spectrom. Rev. 24, 661–700 (2005).
(23) D.B. Milligan, G.J. Francis, B.J. Prince, and M.J. McEwan, Anal. Chem. 79, 2537–2540 (2007).
(24) C.G. Freeman and M.J. McEwan, Aust. J. Chem. 55, 491–494 (2002).
(25) Voice200®, Syft Technologies Ltd., Christchurch, New Zealand; http://www.syft.com
(26) G.J. Francis, D.B. Milligan, and M.J. McEwan, Anal. Chem. 81(21), 8892–8899 (2009).
(27) P.F. Wilson, C.G. Freeman, M.J. McEwan, D.B. Milligan, R.A. Allardyce, and G.M. Shaw, Rapid Commun. Mass Spectrom. 15, 413–417 (2001).
(28) D.B. Milligan, P.F. Wilson, C.G. Freeman, M.J. McEwan, M.N. Mautner, T.J. Clough, and R.R. Sherlock, J. Environ. Qual. 31, 515–524 (2002).
(29) P.F. Wilson, C.G. Freeman, and M.J. McEwan, Int. J. Mass Spectrom. 229, 143–149 (2000).
(30) G.J. Francis, V.S. Langford, D.B. Milligan and M.J. McEwan, Anal. Chem. 81, 1595–1599 (2009).
(31) P.F. Wilson, B.J. Prince, and M.J. McEwan, Anal. Chem. 78, 575–579 (2006).
(32) S. Malfliet, F. Van Opstaele, J. De Clippeleer, E. Syryn, K. Goiris, L. De Cooman, and G. Aerts, J. Inst. Brew. 114, 180–192 (2008).
(33) A.C.J. Cramer, D.S. Mattinson, J.K. Fellman, and B.K. Baik, J. Agric. Food Chem. 53, 7526–7531 (2005).
(34) B. Fickert and P. Schieberle, Nahrung 42, S. 371–375 (1998).
(35) VCF Volatile Compounds in Food: database, L.M. Nijssen, C.A. Ingen-Visscher, and J.J.H. van Donders, Eds. – Version 11.1.1 – Zeist (The Netherlands): TNO Quality of Life (1963–2009).
New Study Reviews Chromatography Methods for Flavonoid Analysis
April 21st 2025Flavonoids are widely used metabolites that carry out various functions in different industries, such as food and cosmetics. Detecting, separating, and quantifying them in fruit species can be a complicated process.
Analytical Challenges in Measuring Migration from Food Contact Materials
November 2nd 2015Food contact materials contain low molecular weight additives and processing aids which can migrate into foods leading to trace levels of contamination. Food safety is ensured through regulations, comprising compositional controls and migration limits, which present a significant analytical challenge to the food industry to ensure compliance and demonstrate due diligence. Of the various analytical approaches, LC-MS/MS has proved to be an essential tool in monitoring migration of target compounds into foods, and more sophisticated approaches such as LC-high resolution MS (Orbitrap) are being increasingly used for untargeted analysis to monitor non-intentionally added substances. This podcast will provide an overview to this area, illustrated with various applications showing current approaches being employed.


