Quality by Design in Pharmaceutical Analysis Using Computer Simulation with UHPLC
LCGC North America
In this study, the quality-by-design principle is applied instead of trial-and-error in the development of an LC method.
In this study, the quality-by-design principle is applied instead of trial-and-error in the development of a liquid chromatography method. With few measurements, the appropriate stationary phase and chromatographic conditions such as the composition of mobile phase, gradient time, temperature, and pH can be determined. A mixture of an active pharmaceutical ingredient and its 13 impurities was analyzed on a short narrow-bore column (50 mm × 2.1 mm, packed with sub-2-µm particles) providing short analysis times. The performance of commercial modeling software for robustness testing was systematically compared to experimental measurements and design-of-experiment–based predictions.
The separation of an active pharmaceutical ingredient (API) and its impurities is a necessary step in the control of drugs. In most cases, the structures of the impurities vary widely. Some impurities are very similar to the API and others are built very differently. Reversed-phase chromatography is mainly used for their separation. In reversed-phase chromatography several parameters influence the quality of the separation. One of them is the stationary phase, where several interactions determine the separation: Hydrophobic interactions are the most dominant in terms of retention, and silanol groups influence the "polar selectivity" (1). If their ratio changes, the separation might change also. Other parameters include the composition of the mobile phase (%B or time of gradient [tG]), pH, and temperature. Both selectivity and working parameters must be in strict control if we transfer the method from laboratory to laboratory, or from high performance liquid chromatography (HPLC) to ultrahigh-pressure liquid chromatography (UHPLC) or vice versa. In the early stage of HPLC this was realized and method development was based on scientific recognitions in the field. In 1976 Horváth, Melander, and Molnár established the fundamentals of reversed-phase chromatography based on a design-of-experiments (DoE) approach (2). In 2002, regulatory authorities in the pharmaceutical industry, such as the Food and Drug Administration (FDA), recognized that analytical chemistry, in our case HPLC, is an integral part of the production of an API. In their guidelines, they highlighted that every parameter that can affect the analytical results must be forecasted. Today, this approach is called analytical quality by design (QbD).
The aim of this work was the implementation of analytical QbD in LC using intelligent modeling software (3–6). The modeling software, which was originally developed in 1986 in cooperation with Snyder and his colleagues (7–9) and Molnár, looking at one and two dimensions, has now reached a three-dimensional (3D) stage (3,4,10,11). This intelligent software is based on the solvophobic theory of Horváth and colleagues (2) and the gradient elution theory of Snyder and Dolan (12). Further additions such as an improved peak tracking tool, the cube, and a robustness device help decrease the number of experiments needed for the development of a method and establish QbD-compatible UHPLC methods. This is particularly true for the 3D design (3).
In 2004, a new age started in LC with the introduction of a new instrument with low extracolumn peak broadening (13). To get high efficiency, sub-2-µm particles were introduced. The columns packed with these small particles needed higher pressure compared to conventional HPLC. Today, the pressure limit is above 1000 bar or 14,500 psi. This new type of LC technique is called UHPLC.
Some considerations should be mentioned about the interconnection of QbD and intelligent software packages. To get a robust method, we need to know the influence of parameters and their combined action on a separation. In QbD this means we have to establish the design space, a region where we have baseline separation. In a classical trial-and-error approach one needed thousands of experiments and the final result might have been robust or not. It was hard to predict the resolution outside of an investigated area. Using intelligent software approaches, the number of measurements can be reduced by two or three orders of magnitude down to 12 runs (14,15). The critical point is the robustness of the separation. In trial-and-error approaches it is impossible to run hundreds of experiments; therefore the robustness is always under debate. Using intelligent software, 12 measurements are enough to get a robust method and indicate its limits (4).
This article investigates the development of an HPLC method for a pharmaceutical drug and its impurities using modeling software with multifactorial optimization of three measured critical HPLC method parameters — gradient time (tG), temperature (T), and pH — as well as further calculation of three factors: the flow rate, %B start, and %B end using UHPLC.
Experimental
Chemicals
The mobile phase used in this work was a mixture of acetonitrile and 5 mM citrate buffer. Acetonitrile (gradient grade), citric acid, sodium hydroxide, standard reference buffers (pH 2.00, 4.01, and 7.00) were purchased from Merck. For the measurements, water was prepared fresh using ELGA Purelab UHQ water (ELGA). The buffer was filtered before use on regenerated cellulose filter membrane with a pore size of 0.2 µm (Sartorius).
The sample used throughout the study was an API and its starting materials (Stm), intermediates (Int), and known and unknown impurities (Imp).
Equipment and Software
UHPLC was performed using a Waters Acquity UPLC system equipped with a binary solvent delivery pump, an autosampler, a photodiode-array detector, a 5-µL injection loop and 500-nL flow cell, and Empower software. The column was a 50 mm × 2.1 mm, 1.7-µm dp Acquity BEH C18 UPLC column, which was selected from a large database with more than 500 reversed-phase columns (1). The dwell volume of the system was measured to be 0.125 mL.
An MP 225 pH meter was purchased from Mettler-Toledo.
Modeling was carried out using DryLab v. 4.1.5.3 software, and the quantitative robustness evaluation of generated models was performed with the latest DryLab Robustness module v.1.0. (Molnár-Institute).
MarvinSketch v. 6.0.2 software was purchased from ChemAxon.
Results and Discussion
Sample
Our study examined an API and its intermediates that were formed during the API manufacturing process. The flowchart of the synthesis can be seen in Figure 1. Both intermediates and newly formed impurities (Stm1, Stm2, and Int1–Int7) can be found in the final product. Two impurities (Imp1 and Imp2) were identified. They were synthesized and used for their identification in the reaction mixture. The identification of two other impurities (Imp3 and Imp4) is in progress.

Figure 1: Flowchart of the API preparation.
Determining the starting points for prediction of retention and resolution by the modeling software is important. There are three ways to do this. The first is to run a reversed-phase gradient from 0 to 100% acetonitrile or methanol on a C18 column. The second is based on previous scientific knowledge, the "Knowledge Space," if available. The third is to predict some physicochemical parameters using intelligent modeling software, if possible. However, if there are unknown components then all three approaches are of limited use. Because we had two unknown impurities, we decided to use a reversed-phase gradient. The gradient time was established with a so called "scouting gradient," where we tried to find all possible unknowns before validating the method. Therefore, we tried to accommodate all known and unknown impurities in the increasing part of the gradient, which in our case was 10–80% B. As gradient times, we selected 1.5 min and 4.5 min. The temperature range tested in two different models between 20 °C and 80 °C.
In Figure 2 the logD–pH function is given for the distribution of the investigated solutes between n-octanol and water as a function of the eluent pH.
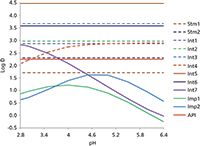
Figure 2: LogD prediction by the MarvinSketch software.
From the logD–pH diagram the following conclusion can be made: At any pH there are big differences in the nonpolarity of the various solutes and, therefore, gradient elution has to be selected. In the QbD concept, the gradient parameters will play an important role. The acidity of an eluent will influence retention and, from Figure 2, it can be concluded that the pH will have a great influence on the separation. The third parameter is the temperature. Unfortunately, silica-based reversed-phase columns have an upper temperature limit between 60 °C and 90 °C. However, the temperature influence is not negligible and must always be measured.
Explanations of how the modeling software 3D model was developed has been published numerous times (3–11,14,15). Experimental design for the simultaneous optimization of gradient time, temperature, and pH requires 12 experiments, as illustrated in Figure 3. Two basic gradients with different rates (1.5 and 4.5 min, 10–80% B) were carried out at three column temperatures (20, 50, and 80 °C). Mobile-phase A was 5 mM citrate buffer at seven pH values (2.8, 3.4, 4.0, 4.6, 5.2, 5.8, and 6.4); mobile-phase B was acetonitrile. Citric acid was chosen as the buffer because it has high buffer capacity between pH 2.8 and pH 6.4 (pK1 = 3.1, pK2 = 4.7, and pK3 = 5.4). Acetonitrile was selected as the organic modifier because of its low viscosity. The flow rate was at 0.8 mL/min. The injection volume was 1 µL.
Experimental points were designed using the parameters above. Using the three temperature values two temperature ranges were determined: We called 20–50 °C the low temperature range and 50–80 °C the high temperature range. Using the seven pH values, three pH ranges could be determined: pH = 2.8–3.4–4.0 was called the low pH range; pH = 4.0–4.6–5.2 was called the middle pH range; and pH = 5.2–5.8–6.4 was called the high pH range. The gradient time was 1.5 and 4.5 min on every temperature and pH value. Six cubes were prepared using these parameters (see Figure 3).
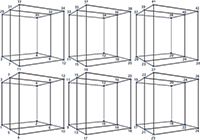
Figure 3: Design-of-experiments (DoE) cubes for the simultaneous optimization of gradient time (tG), temperature (T), and pH of eluent A. Circles represent the input experiments for the 3D models.
The short gradient time (tG1 = 1.5 min, 10–80% B), experiments are at points 1, 5, 9, 13, 17, 21, 25, 3, 7, 11, 15, 19, 23, 27, 29, 31, 33, 35, 37, 39, 41, 43, and 45. The long gradient time (tG2 = 4.5 min, 10–80% B) experiments are at points 2, 6 ,10, 14, 18, 22, 26, 4, 8, 12, 16, 20, 24, 28, 30, 32, 34, 36, 38, 40, and 42. The low temperature (T1 = 20 °C) experiments are at 1, 2, 5, 6, 9, 10, 13, 14, 17, 18, 21, 22, 25, and 26; the middle temperature runs (T2 = 50 °C) are at 3, 4, 7, 8, 11, 12 15, 16, 19, 20, 23, 24, 27, and 28; and the high temperature runs (T3= 80 °C) are at 29, 30, 31, 32, 33, 34, 35, 36, 37, 38, 39, 40, 41, and 42. Using the three pH ranges that we determined, the low pH range = 2.8 (1, 2, 3, 4, 29, and 30)–3.4 (5, 6, 7, 8, 31, and 32)–4.0 (9, 10, 11, 12, 33, and 34); the middle pH range = 4.0 (9, 10, 11, 12, 33, and 34)–4.6 (13, 14, 15, 16, 35, and 36)–5.2 (17, 18, 19, 20, 37, and 38); and the high pH range = 5.2 (17, 18, 19, 20, 37, and 38)–5.8 (21, 22, 23, 24, 39, and 40)–6.4 (25, 26, 27, 28, 41, and 42). The low temperature range (T1–T2) and low pH range are shown in Figure 4a. The low temperature range (T1–T2) and middle pH range are shown in Figure 4b. The low temperature range (T1–T2) and high pH range are shown in Figure 4c. The high temperature range (T2–T3) and low pH range are shown in Figure 4d. The high temperature range (T2–T3) and middle pH range are shown in Figure 4e. The high temperature range (T2–T3) and high pH range are shown in Figure 4f. The measured parameters are given in Table I.
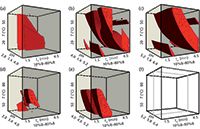
Figure 4: Design spaces in the 3D models. The irregular red zones indicate the design spaces of the UHPLC method, where the critical resolution is higher than 1.5 (baseline separation) and in which an alteration of working conditions (changing the position of the working point) is possible without a new validation, as this is done inside of the design space (the irregular red shapes inside of the cubes) and this is not considered to be a change.
After the experiments were carried out, the chromatograms were integrated and exported in AIA-format (Analytical Instrument Association, *.cdf), which is available in most chromatography data system (CDS) software, and tG, T, and pH models were calculated. The peaks were identified by their UV spectra and peak areas, as previously described (3–10,14,15).

Table I: Input experiments for the 3D models
Next, we conducted an examination of the cubes and established the most appropriate working (or set) point for making a robust method.
At the low and the middle pH range there was no stable retention time of the components, so the method was not robust at those levels. At the high temperature range and high pH range Stm2 dissolves, so the cube could not be prepared (see Figure 4e). The most appropriate cube is at the low temperature and high pH range. We selected the working point, where the method seemed to be robust: at tG = 4.0 (10–80% B), T = 40 °C, pH = 6.2 (see Figure 4c and Figure 5).
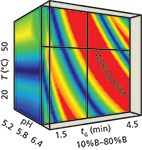
Figure 5: The working point in the low temperature rangeâhigh pH range cube. For the coordinates of the working point see Table II.
Comparing the results, we can see that there is only a difference of 0.01 min (maximum) between the predicted and experimental retention times. The predicted and experimental resolution values are in good agreement, especially in the case of the critical pair Int1 and Int4 (see Figure 6 and Table II).
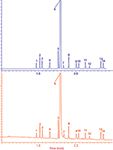
Figure 6: Predicted (top, blue) and experimental (bottom, red) chromatograms, spiked at 0.1% level show the excellent prediction of the chromatographic selectivity at the selected working point (see Table III). There are 14 components separated and quantitated. Peaks: 1 = Imp1, 2 = Imp7, 3 = Imp2, 4 = Stm1, 5 = Imp3, 6 = API, 7 = Int2, 8 = Imp4, 9 = Int1, 10 = Int4, 11 = Int6, 12 = Stm2, 13 = Int5, 14 = Int3.
It was mentioned before that 12 measurements are needed for a cube, but 72 measurements for six cubes were not necessary because there were common points (3, 4, 7, 8, 9, 10, 11, 12, 15, 16, 17, 18, 19, 20, 23, 24, 27, 28, 33, 34, 37, and 38; see Figure 3). We only had to make 42 measurements.
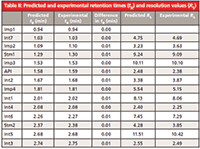
Table II: Predicted and experimental retention times (tR) and resolution values (RS)
The fastest way to achieve the 42 measurements is to measure the two gradient slopes at 20 °C at all pH values then raise the temperature to 50 °C and 80 °C and measure all gradient slopes.
On a 5-cm-long narrow-bore column, the pH equilibrates easier that the temperature.
After conducting 42 experiments that were examined over a large pH range (2.8–6.4) and a large temperature range (20–80 °C) we understood the chromatographic behavior of components in a broader region. The required time for method development was two work days (16 h), and we only had to use 400 mL of eluent.
The developed method uses only 3 mL of eluent (which includes equilibration time and injection time). With this method we can analyze more than 300 samples per day.
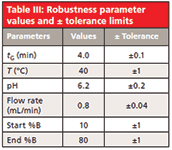
Table III: Robustness parameter values and ± tolerance limits
Modeling the Robustness Testing
Utilizing a new feature of the modeling software, a modeled robustness test was performed. Besides the three model variables (tG, T, pH), the flow rate, the initial %B composition, and the final %B compositions of the mobile-phase gradient were tested. This feature does not allow us to ignore some factors or to change the design; the effects of these six factors are calculated, optionally at two or three levels. In our case, the effect of the six variables was studied at three levels. The modeled deviations from the nominal values (or robustness parameters [see Table III]) follow:
- the gradient time was set to 3.9, 4.0, and 4.1 min;
- the temperature was set to 39 °C, 40 °C, and 41 °C;
- the mobile phase pH was set to 6.0, 6.2, and 6.4;
- the flow rate was set to 0.76, 0.80, and 0.84 mL/min;
- the initial mobile phase composition was set to 9%, 10%, and 11% B;
- and the final composition was set to 79%, 80%, and 81% B (see Table III).
Then the 729 experiments were modeled, which took approximately 30 s. A criterion of Rs > 1.5 for baseline separation was considered. Figure 7 shows the results of the 729 experiments expressed in frequency of how many times a given critical resolution value was found. As we can see, the most frequent resolution was Rs = 2.47, and the lowest predicted resolution is Rs= 1.79. As the lowest resolution value (1.5) was selected, the method can be considered robust, since the success rate is 100% in the studied design space, that is, no out-of-specification (OOS) results are expected.

Figure 7: Frequency of critical resolution values of critical peak pairs. A blue square with the height of N = 1 symbolizes how many times one Rs,crit-value was found from the 729 runs, so there is a sum of 729 squares on the diagram. As Rs,crit,min = 1.79, Rs,crit,max = 2.53, all routine experiments are chromatographically in specifications; that is, the production can be done with 100% success rate, without out-of-specification (OOS) results.
Another feature of this module is the calculation of the effects of individual and interacting parameters. Figure 8 describes the importance of each parameter related to the selected deviation from the nominal value for the critical resolution, demonstrating that the flow rate has the most significant influence on the critical resolution; that is, a positive change in flow rate would increase the Rs,crit, and changes in tG and temperature would have the second and third greatest effect on Rs,crit, respectively. We can also see some interaction between the separation parameters.
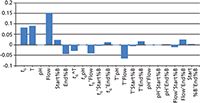
Figure 8: The relative effects of the chromatographic parameters on separation.
Summary
Method development in LC is time consuming and labor intensive and, therefore, an expensive process for most pharmaceutical companies. Any tool that helps reduce the number of experiments and shows the critical parameters shortens the time and cost. According to QbD requirements in the pharmaceutical industry, all parameters must be controlled and predicted in terms of how they influence product quality. Analytical chemistry is an integral part of the production process and the final product. In our study, we investigated the separation of an API and its starting materials (Stm), intermediates (Int), and known and unknown impurities (Imp). Intelligent modeling software was used for the prediction of separation conditions. The logP, pKa, and logD–pH functions were predicted and are important for method development. Based on 12 experimental measurements, the position of each component in a 3D cube — a critical resolution space — was elaborated. The comparison between predictions and the experimental runs showed only a small difference of 1–3% in the retention times, which is an excellent and unparalleled result. From the cube, the robust conditions could be calculated, thus ensuring that small variations in experimental parameters cannot cause separation problems. Furthermore, the software offered an opportunity to visualize and quantitate the method robustness in a unique way, which is becoming a more important part of the method development process in regulatory considerations in drug master file submissions. In the meantime, the submission of the documentation as explained by Schmidt and Molnár (11) has been accepted by four European health authorities without any further questions.
Last but not least, in the future QbD will be an integral part of HPLC method development because without a DoE and the corresponding design space it will not be possible to meet current regulatory requirements. The control strategy, which is a part of QbD, has to be established because it will enable the industry to easily implement so-called continual improvements. These goals can be achieved faster using modeling software.
We intend to apply two intelligent program packages for this purpose, as shown in this article. The first one is to use modelling software to predict the retention and resolution of unknown impurities and by using the resulting design space to allow much greater flexibility in routine quality control without the need for regulatory post-approval changes. The second package is valuable for the prediction of important physical chemical parameters (logP, pKa, and logD–pH) for easier selection of measurement ranges. With the proper selection of the gradient time, temperature, and pH ranges for charged analytes ("pH-Cube") and gradient, time, temperature, and tC (ternary-eluent composition or "ternary Cube") for neutral analytes we will be able to develop new, better, and more efficient drugs in much shorter time in the future.
References
(1) L.R. Snyder, J.W. Dolan, and P.W. Carr, J. Chromatogr. A. 1060, 77–116 (2004).
(2) Cs. Horváth, W. Melander, and I. Molnár, J. Chromatogr. 125, 129–156 (1976).
(3) I. Molnár, H.-J. Rieger, and K.E. Monks, J. Chromatogr. A. 1217, 3193–3200 (2010).
(4) K. Monks, I. Molnár, H.-J. Rieger, B. Bogáti, and E. Szabó, J. Chromatogr. A. 1232, 218–230 (2012).
(5) I. Molnár, J. Chromatogr. A. 965, 175–194 (2002).
(6) I. Molnár, H.-J. Rieger, and R. Kormány, Chrom. Today 3–8 Mar. (2013).
(7) L.R. Snyder, J.W. Dolan, and D.C. Lommen, J. Chromatogr. 485, 65–89 (1989).
(8) J.A. Lewis, D.C. Lommen, W.D. Raddatz, J.W. Dolan, L.R. Snyder, and I. Molnar, J. Chromatogr. 592, 183–195 (1992).
(9) J.A. Lewis, J.W. Dolan, L.R. Snyder, and I. Molnár, J. Chromatogr. 592, 197–208 (1992).
(10) M.R. Euerby, G. Schad, H.-J. Rieger, and I. Molnár, Chrom. Today 13-20 Dec. (2010).
(11) A.H. Schmidt and I. Molnár, J. Pharm. Biomed. Anal. 78–79, 65–74 (2013).
(12) L.R. Snyder and J.W. Dolan, High-Performance Gradient Elution, (John Wiley and Sons, New York, 2007, ISBN-10 0-471-70646-9).
(13) M.E. Swartz, J. Liq. Chromatogr., Related Technol. 28, 1253–1263 (2005).
(14) R. Kormány, I. Molnár, and H.-J. Rieger, J. Pharm. Biomed. Anal. 80, 79–88 (2013).
(15) K.E. Monks, H.-J. Rieger, and I. Molnár, J. Pharm. Biomed. Anal. 56, 874–879 (2011).
Róbert Kormány is a chemist who studied chromatography at the M.Sc. level. He works at the pharmaceutical company Egis and specializes in developing UHPLC methods for the separation of pharmaceutical compounds using computer modeling.
Imre Molnár, PhD, is the president of the Molnár-Institute and a former coworker of Csaba Horváth at Yale University, where he developed the fundamentals of reversed-phase chromatography, the highly cited and well-known "solvophobic theory." In 1981 he founded the Molnár-Institute for Applied Chromatography in Berlin, Germany. Since 1984, he has been working with LC Resources on the development of the DryLab software. He is a specialist in pharmaceutical research and analysis and conducts a series of HPLC courses on reversed-phase chromatography and on the DryLab-software for the development of robust methods.
Jenõ Fekete, PhD, is a full professor at Budapest University of Technology and Economics. His main research interests are separation science and environmental analytical chemistry. His research group uses HPLC, UHPLC, GC, and HS-GC–MS for method development. His publications number more than 100, and he is a coauthor of two recently published books about UHPLC methods. Direct correspondence to: rkormany@gmail.com

New Study Investigates Optimizing Extra-Column Band Broadening in Micro-flow Capillary LC
March 12th 2025Shimadzu Corporation and Vrije Universiteit Brussel researchers recently investigated how extra-column band broadening (ECBB) can be optimized in micro-flow capillary liquid chromatography.


