A Quality-by-Design Methodology for Rapid LC Method Development, Part II
LCGC North America
This second part of the series describes the data loss inherent in most early method development experiments due to coelution, peak exchange, and the general difficulty of accurately identifying peaks across the experiment trial chromatograms.
Part I of this article described the application of Quality-by-Design (QbD) principles to the task of screening analytical columns. In a QbD approach a statistical experiment design plan (Design of Experiments, or DOE) [1] is used to systematically vary multiple study factors in combination through a series of experiment trials that, taken together, can comprehensively explore a multi-factor design space. Such a design can provide a data set from which the experimenter can identify and quantify interaction effects of the factors along with their linear additive effects, curvilinear effects, and even non-linear effects. This quantitation translates the design space into a knowledge space.

Michael E. Swartz
As also described in Part I, in a traditional method development approach one would first study "easy to adjust" instrument parameters, meaning those for which no equipment configuration change was required. However, categorizing instrument parameters as easy versus hard to control is no longer valid in many cases due to the availability of multi-column and multi-solvent switching capabilities for most modern LC instrument systems. Therefore, one can now address up front the instrument parameters which are understood or expected to have the strongest effects on separation of the sample compounds. This is consistent with a QbD approach in which a Pareto analysis would first be carried out to rank instrument parameters in terms of their expected ability to affect compound separation; a manageable number of the top-ranked parameters are then included in the first phase of method development. Table I presents a phased method development approach using a rank-based partitioning of instrument parameters consistent with QbD-based practice.

Ira S. Krull
An experimenter defines the design space for a given method development study by selecting instrument parameters (study factors) and defining the range or level settings of each. A DOE-based experiment then defines the specific combinations of the study factors which together provide a statistically valid sampling of the design space. Figure 1 illustrates a DOE-based sampling plan for a two-factor design space. The black dots in the figure correspond to the trials defined by a classical two-level factorial design. Such a design is typically used in initial variable screening studies to explore both single factor (linear additive) effects and two-factor interaction effects. The red dot in the figure is the center point run. A best practices approach includes this run to estimate the presence of "curvature" in the response space, that is, effects which depart from linearity. The center point is usually replicated within the design — the results from the center-point repeats provide an internal estimate of the experimental error associated with each measured result.
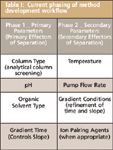
Table I: Current phasing of method development workflow
The gray dots in the figure correspond to the additional points which would be present in a classical three-level factorial design, also referred to as a response surface design. When screening design results indicate that curvature effects are important, the response surface points can be added to the design to identify the specific factor or factors which are expressing the curvature effects and quantify these effects.
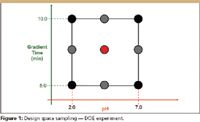
Figure 1
Classical two-level DOE designs support a categorical (non-numeric) factor such as Column Type. However, classical three-level and mixed-level designs do not — these designs require the variables to be numeric. Fortunately advanced DOE designs called algorithm designs enable the experimenter to study greater than two columns at a time in combination with factors such as pH, gradient slope, and organic solvent type — factors that are major effectors of column selectivity. This is important for two reasons. First, it enables the experimenter to include a larger portion of the column selectivity space in the design space. Second, the effects of factors such as pH and organic solvent makeup on the separation of a given set of compounds can be substantially different for different columns. Expanding the design space and characterizing interaction effects therefore provide a solid opportunity for knowledge-based selection of the stationary and mobile phases.
A DOE-based experiment is a sound statistical platform for LC method development consistent with QbD best practice. However, compound coelution and changes in compound elution order between experiment trials (peak exchange) are common in early column and solvent screening experiments. Coelution and peak exchanges are due to the major effects that variables such as pH and organic solvent type can have on the selectivity of the various columns being screened. These circumstances cause inherent data loss and inconsistency in critical results such as compound resolution which can substantially reduce the ability to translate the design space into a true knowledge space.
This second part of the series first describes the data loss inherent in most early method development experiments due to coelution, peak exchange, and the general difficulty of accurately identifying peaks across the experiment trial chromatograms (peak tracking). Such data loss will be shown to make numerical analysis of the results very problematic. It often reduces data analysis to a manual exercise of viewing the experiment chromatograms and picking the one that looks the best in terms of overall chromatographic quality — a "pick-the-winner" strategy. This article then describes Trend Responses, novel interpretations of results which are directly derived from experiment chromatograms by the Fusion AE software program without peak tracking and are more robust to coelution and peak exchange. Trend Responses overcomes the data loss inherent in traditional column-screening studies, and so enables accurate quantitative analysis of the experiment results.
Inherent Data Loss in Early Method Development Experiments
The inherent data loss due to coelution and peak exchange in column-screening experiments can be seen by comparing the chromatograms in Figures 2 and 3, obtained from a column–solvent screening experiment that included three columns, pH, and gradient time as study factors. In Figure 2, the resolution data value for impurity C obtained from trial 13 is a measure of its separation from the main active pharmaceutical ingredient one (API 1), the immediately prior-eluted compound. However, in Figure 3, the instrument parameter settings associated with trial 19 have caused impurity G to migrate away from API 1 so that it no longer coelutes with this compound. As a result, the impurity C resolution data obtained from trial 19 now measures its separation from impurity G. Therefore, the impurity C resolution values in the two chromatograms are not measuring the separation of the same peak pair. Additionally, the coelution of impurity G with API 1 under the trial 13 conditions means that trial 13 will have missing data for this impurity.

Figure 2
Table II presents the experiment design used in the column–solvent screening experiment from which the chromatograms in Figures 2 and 3 were obtained, along with resolution results for three of the impurities in the experiment sample. These data were generated by tracking the peaks across the experiment chromatograms. One can see the two common problems associated with the Table II data: the large number of missing resolution results overall, and the huge disparity in the resolution results present for a given compound. These problems are due to the major differences in the degree of coelution and peak exchange between the DOE experiment runs.

Figure 3
The result of this inherent data loss, which is typical in multifactor column–solvent screening experiments, is that the data might not accurately represent a compound's actual chemistry-based behavior, and so provide no basis for legitimate modeling and interpretation of the results.

Table II: Example data set - current practice data
Peak tracking in early column–solvent screening experiments is laborious and error-prone. And as seen in Table II, even when it is done, the data might not be sufficient to define accurately the effects of changing chromatographic conditions on the resolution of all critical peak pairs. However, this does not mean that data analysis must be reduced to examining chromatograms with no opportunity for quantitative knowledge. As described in the next section, the inherent data loss problems can be solved by using DOE methods in combination with the Trend Responses data interpretation. These responses provide data from which the variable effects on chromatographic performance can be determined quantitatively without direct peak tracking.
A New Quality-by-Design Based Methodology
Figure 4 is a flowchart of a new QbD-based method development workflow. The new methodology harmonizes with the current SOPs of many leading pharmaceutical labs in that it is a phased approach to method development. However, as shown in red text within the figure, a solid DOE approach to column–solvent screening is utilized in Phase 1, along with software-based data treatments, which together enable the qualitative elements of the current approach to be transformed into statistically rigorous quantitative practice without the need for peak tracking. DOE also is used in the new Phase 2 workflow; in this phase, novel data treatments have been developed to derive and integrate quantitative method robustness metrics into formal method development and optimization. The details of the new Phase 2 technologies and methods will be presented in Part III.
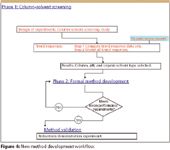
Figure 4
The new QbD-based methodology has been implemented in commercial software and demonstrated successfully in "live" studies carried out at many pharmaceutical laboratories. These studies involved either test mixes of active ingredients and impurities designed to challenge the methodology, or current method development projects in which obtaining an acceptably performing method proved resistant to all current attempts. The next two subsections of this column present the new QbD-based methodology and the software-based data treatments used in Phase 1, and describe one of the successful proof-of-technology experiments.
QbD-based Phase 1 Workflow
The new QbD methodology executes the column–solvent screening phase using statistical DOE. The experimental work involves the following five workflow steps:
Define the design space. Table III is a template of the recommended experiment variables and settings for a Phase 1 — column–solvent screening experiment — traditional LC. The template can be modified as required by the target instrument platform (for example, gradient time range for ultrahigh-pressure liquid chromatography [UHPLC]) and the nature of the specific sample compounds.
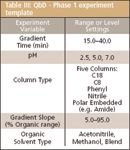
Table III: QbD - Phase 1 experiment template
Generate a statistically designed experiment. The experiment design defines a variety of different study factor level setting combinations (different instrument methods) to be run on the LC system. The use of a statistical experimental design ensures that all important study factor effects will be expressed in the experiment data.
Transform the experiment into instrument control settings. This requires constructing a sample set and building the instrument methods required by the DOE design within the chromatography data software (CDS). The software does this step automatically.

Table IV: Novel trend response data sets
Run the various design conditions on the instrument. This requires running the sample set and processing the resulting chromatograms. The CDS runs the sample set automatically. Processing the chromatograms is done manually using native CDS features.
Derive predictive models of the Response data sets. The results data within each experiment chromatogram are retrieved from the CDS, and unique Trend Responses (defined in Table V) are derived from these results and modeled. The software does this step automatically.

Table V: Modified Phase 1 experiment template
The experimenter then enters chromatographic performance goals which the software uses to identify the study parameter settings that provide the best method performance.
Table IV defines the unique trend responses that are used in the data analysis. These responses are of two general types: peak count-based and peak results-based. As the name implies, a peak count-based response is obtained by counting the number of integrated peaks in each chromatogram that meet a certain criterion. A peak result-based response is a way of obtaining a result such as resolution or retention time for a specific peak using indirect peak tracking. For example, setting the Max Peak # – RESPONSE operator to Max Peak 2 – USP Resolution will find the second largest peak in each chromatogram and obtain the resolution result for the peak. It is important to note that obtaining trend responses does not require any assignments of sample compounds to peaks in the experiment chromatograms, that is, no peak tracking. And as opposed to a pick-the-winner strategy, these responses are analyzed statistically and modeled. The models quantify the effects of changing the study factors on important chromatographic trends such as the number of visualized and separated compounds in addition to the critical peak-pair specific information provided by the peak result trend responses.
Proof-of-Technology Experiment
A column–solvent screening experiment was conducted to validate the new QbD methodology, as implemented in Fusion AE, a commercial software package, and demonstrate the utility of trend responses. The goal was development of a stability-indicating method. To seriously challenge both the approach and the software, a current product was selected as the target sample. This product contains two APIs, a minimum of nine impurities that are related structurally to the APIs (same parent ion), two degradants, and one process impurity.
The instrument platform used in this work was a Waters ACQUITY UPLC system (Waters, Milford, Massachusetts) equipped with a four-position internal column selection valve. The LC system was controlled by Waters Empower 2 chromatography data software. To accommodate the LC system the Phase 1 — column–solvent screening experiment template was modified as shown in Table V in terms of the gradient time, the organic mobile phase, and the number of analytical columns evaluated (three were used in this study).
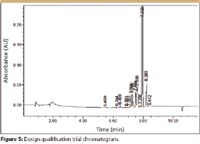
Figure 5
Before running the screening experiment, a design space qualification trial was run at center point conditions of the numeric experiment variables (gradient time = 7.5 min, pH = 4.50). The C18 column was used in this trial, because it has the most central position in the selectivity space of the three candidate columns. Figure 5 presents the chromatogram obtained from the qualification trial. As the chromatogram shows, all sample compounds eluted after 5 min, that is, after the mobile phase reached 50% organic. The initial % organic value for the gradient slope variable in the QbD screening experiment template was therefore changed from 5.0% to 50.0%.

Table VI: Columnâsolvent screening experiment data set
Table VI presents the column–solvent screening experiment design generated from the template along with the trend response results computed directly from the chromatogram data. Table VII presents the modeling results for the number of peaks trend response in the form of a variable effects ranking table. The strongest effect, that is, the largest effect in absolute magnitude, is assigned a rank of 1.0000; the strength of each other statistically significant variable effect is ranked proportionately relative to that of the strongest effector. The table contains two critical results worth describing in detail. First, pH and gradient time express significant column-type dependent interaction effects within the design space. In fact, the relative rank of 0.960 associated with the complex (Gradient Time*pH)*RP interaction term identifies this as the second largest observed effect. Second, the C18 column was entered in the Column 1 position within the software, and so is used as the baseline standard by which the other two columns are compared. As the Model Term Effects for Phenyl (–5.03) and pH (–3.01) in Table VIII show, switching from the C18 column to either the Phenyl or the RP column has a strong negative effect on the number of peaks Trend Response.
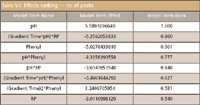
Table VII: Effects ranking - no. of peaks
Once the software derives an equation for each trend response, the equations can be linked to an optimization algorithm that identifies the variable settings that perform best according to user-definable goals. Table VIII presents the response goal settings, which a multiple response optimization algorithm uses to gauge the acceptability of any given solution. The settings for the Max_Peak_1 – Peak Area response illustrate the power and flexibility of the trend responses. This response is used as an indirect measure of the purity of the primary active pharmaceutical ingredient (API), because a coeluted compound will increase the integrated area of the API peak. The response goal is therefore set to Minimize, and the Upper Bound value is set to 4,700,000, because several chromatograms demonstrated that API areas of greater than this value occurred when the API was coeluted with an impurity. Table IX presents a numerical optimization answer obtained using the goal settings in Table VIII. The answer identifies level settings of the experiment variables that perform best within the design space studied.

Table VIII: Optimizer search settings
A graphical approach also can be used to visualize acceptable performing methods within a design space. Figure 6 presents three 2D contour graphs of the number of peaks trend response — one for each column evaluated. The graphs show the combined effects of pH and gradient time on this key response, and illustrate the superior performance of the C18 column for this response relative to the other two columns. Figure 7 is a simplified version of the contour graph in Figure 6. In this graph, a goal of Maximize is applied to the number of peaks response with the minimum acceptability value (Lower Bound) of 13 visualized peaks. The graph is interpreted as follows:

Table IX: Numerical optimizer answer
The pink shaded region corresponds to parameter settings that do not meet the minimum acceptability goal (equation predicts less than 14 peaks).

Figure 6
The dark pink line demarcating the shaded and unshaded regions defines parameter settings that exactly meet the response goal (equation predicts exactly 14 peaks).
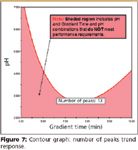
Figure 7
The unshaded region corresponds to parameter settings that exceed the goal (equation predicts greater than 14 peaks).
Figure 7 is called a response overlay graph, because multiple response goals can be displayed (overlaid) on such a graph. This is shown in Figure 8, which contains shading for each of the six key trend responses analyzed in the column–solvent screening study. Note that six individual graphs would have to be generated and compared visually to determine the same information contained in this one response overlay graph in terms of level setting combinations that meet or do not meet all trend response goals.
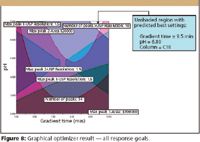
Figure 8
Figure 9 presents the chromatogram obtained by analyzing the sample with the LC system set at the numerical optimizer answer settings presented in Table IX — the best result obtainable within this design space. It is important to note that the resolutions of the two APIs are both below 2.00. This means that an optimization experiment should be performed to further optimize separation for both mean performance and method robustness. In this second experiment, the column type, pH, and gradient time will be fixed at best conditions, and other parameters will be brought into play.

Figure 9
In practice, the trend response approach will not always yield the optimum LC method (instrument parameter settings) in a single experiment, and indeed it is not meant to. The trend response approach is part of a phased workflow in which these responses enable the experimenter to identify the best settings of parameters such as column type, pH, and mobile phase organic type; parameters that normally have the greatest effect on separation, and therefore cause the most inherent data loss. After these settings are identified, these parameters are then held constant to minimize coelution and peak exchange. This simplifies any peak tracking that can be required in a subsequent optimization experiment.
Conclusions
Chromatographic analytical method development work normally begins with selection of the analytical column, the pH, and the organic solvent type. A major risk of using either a one-factor-at-a-time (OFAT) approach or a first principles equation approach in this phase is that these approaches provide extremely limited coverage of the design space. This limitation translates into little or no ability to visualize or understand the interaction effects usually present among these key instrument parameters.
Alternatively, a QbD-based methodology employs a statistical experiment design to address the design space comprehensively and enable the experimenter to visualize and quantify all important variable effects. However, this approach often results in significant inherent data loss in key chromatographic performance indicators such as compound resolution due to the large amount of peak exchange and compound coelution common in these experiments. Inherent loss makes it difficult or impossible to quantitatively analyze and model these data sets, reducing the analysis to a pick-the-winner strategy done by visual inspection of the chromatograms. This knowledge limitation has been overcome successfully by using a statistical experimental design coupled with automatically computed trend responses. This new methodology, implemented in a fully automated QbD-based software program, successfully replaces a pick-the-winner strategy with rigorous and quantitative column–solvent screening without the need for difficult, laborious, and error-prone peak tracking. Part III will describe the integration of quantitative method robustness estimation into method optimization – the second phase of LC method development.
Acknowledgments
The authors are grateful to David Green, Bucher and Christian, Inc., for providing hardware and expertise in support of the live experimental work presented in this paper. The authors also want to thank Dr. Graham Shelver, Varian, Inc., Dr. Raymond Lau, Wyeth Consumer Healthcare, and Dr. Gary Guo and Mr. Robert Munger, Amgen, Inc. for the experimental work done in their labs which supported refinement of the phase 1 and phase 2 rapid development experiment templates.
Joseph Turpin is an Associate Senior Scientist with Eli Lilly and Company, Inc., Greenfield, IN.
Patrick H. Lukulay, Ph.D. is the Director, Drug Quality and Information U.S. Pharmacopeia Rockville, MD.
Richard Verseput is President, S-Matrix Corporation Eureka, CA.
Michael E. Swartz "Validation Viewpoint" Co-Editor Michael E. Swartz is Research Director at Synomics Pharmaceutical Services, Wareham, Massachusetts, and a member of LCGC's editorial advisory board.
Ira S. Krull "Validation Viewpoint" Co-Editor Ira S. Krull is an Associate Professor of chemistry at Northeastern University, Boston, Massachusetts, and a member of LCGC's editorial advisory board.
References
(1) ICH Q8 — Guidance for Industry, Pharmaceutical Development, May 2006.
(2) ICH Q8 (R1), Pharmaceutical Development Revision 1, November 1, 2007.
(3) L.R. Snyder, J.J. Kirkland, and J.L. Glajch, Practical HPLC Method Development, 2nd Ed. (John Wiley and Sons, New York, 1997).
(4) J.A. Cornell, Experiments With Mixtures, 2nd Ed. (John Wiley and Sons, New York, 1990).
(5) M.W. Dong, Modern HPLC for Practicing Scientists (John Wiley and Sons, Hoboken, New Jersey, 2006).
(6) D.C. Montgomery, Design and Analysis of Experiments, 6th Edition (John Wiley and Sons, New York, 2005).
(7) R.H. Myers and D.C. Montgomery, Response Surface Methodology (John Wiley and Sons, New York, 1995).
(8) P.F. Gavin, B.A. Olsen, J. Pharm. Biomed. Anal. 46, 431–441 (2007).

Common Challenges in Nitrosamine Analysis: An LCGC International Peer Exchange
April 15th 2025A recent roundtable discussion featuring Aloka Srinivasan of Raaha, Mayank Bhanti of the United States Pharmacopeia (USP), and Amber Burch of Purisys discussed the challenges surrounding nitrosamine analysis in pharmaceuticals.


