Quality Control of Snake Venoms for Proteomic Analysis: Comparing Applicability of CGE-on-the-chip and Planar Polyacrylamide Gel Electrophoresis
LCGC Europe
The evaluation of the state of a biological sample before starting the complex analyses is a crucial step in proteomics studies. This paper compares planar polyacrylamide gel electrophoresis (SDS-PAGE) and capillary on-the-chip SDS GE (CGE-on-the-chip) in terms of the speed of analysis, sensitivity and flexibility. Snake venoms, which are heterogeneous with high bioactivity and consist mainly of proteins with a molecular weight mass range below 100 kDa, were investigated. CGE-on-the-chip was found to be a faster and more stable technique, providing more information than classical SDS-PAGE. CGE-on-the-chip was also capable of detecting many compounds over a broad molecular weight mass range whereas the SDS-PAGE is more time-consuming and provides acceptable resolution either in the very low (below 17 kDa) or in the mid- to high-molecular mass region (16–200 kDa) depending on the gel/buffer-system selected.
Martina Marchetti,1 Walter Welz2 and Günter Allmaier,1
1Research Division Instrumental Analytical Chemistry, Institute of Chemical Technologies and Analytics, Vienna University of Technology, Vienna, Austria,
2Institute of Analytical Chemistry, Johannes Kepler University, Linz, Austria.
Snake venoms are complex mixtures of bioactive compounds. Proteins and peptides comprise about 90–95% of the dry weight of snake venoms. Nucleotides, carbohydrates, biogenic amines, inorganic ions or very low levels of free amino acids and lipids constitute the remaining.1
There are a number of reasons why an understanding of these biological fluids is important. Around 2.5 million people are victims to snakebites worldwide and 100000 of these are fatal. Flaccid paralysis, systemic myolysis, coagulopathy and haemorrhage, renal damage and failure, cardiotoxicity and local tissue injury at the site of the snakebite are the major symptoms following envenomation. These symptoms indicate that snake venoms particularly affect the central nervous, cardiovascular, muscular and vascular system. Over 100 snake venoms are known to affect the haemostatic system by a variety of mechanisms.1

The development of alexipharmic agents to treat injured people is vital. A crucial prerequisite for successful treatment is knowledge about the biochemical composition of all those different snake venoms because it represents the underlying treatable pathogenesis. In addition to these adversarial properties some venoms, such as those of cobras, were successfully applied in the treatment of Parkinson's and Alzheimer's disease.2 Viper venoms have been shown to inhibit tumours3 and indications are given that some constituents of the venom may be used for the therapy of bronchial asthma.4
In fact Captopril, a pharmaceutical used to control unbalanced cardiovascular functions, was structurally empathized to bradykinin potentiating peptides isolated from Bothrops jararaca, which were the first effective angiotensin-converting enzyme (ACE) inhibitors used as blood pressure regulating drugs applied to humans.5–7
However, snake venoms are very heterogeneous biological systems showing undeniable interspecies and intraspecies variations expressed by qualitative and quantitative diversity of biological activity and protein pattern.8 Interspecies variations can be explained by evolutionary aspects of venomous snakes.9 Intraspecies variations have been attributed to age,10 sex,11 geographical location or climate,12 genetics,13,14 alimentary habits9,15 and the complex, not well-understood interaction of some of these factors.16
A lot of emphasis has been put into the investigation of snake venoms for their applications in medicine.17–19 For this reason a typical proteomics approach making use of 2-dimensional gel electrophoresis (2D GE) and/or liquid chromatography (LC) both combined off- or on-line with mass spectrometry (MS) for protein identification became popular over the last few years. But using these highly sophisticated strategies and instrumentation seem to marginalize the importance of sample preparation and sample control at the very first beginning of the analytical process (to get a well-defined and constant starting material). It is a well-known but underestimated fact that sample preparation and, particularly for venoms, sample handling/extraction plays a crucial role for the subsequent protein identification and their relative/absolute quantification.
Wrong conclusions can be drawn easily from inhomogeneous prepared samples or samples which have been reanalysed without checking the state of venom proteolysis after storing for a certain time span. This last aspect is particularly important for snake venoms since most of the proteins are metalloproteases or other enzymes which may retain a certain activity even if stored deep frozen.
The focus of this study was to evaluate the suitability of a capillary gel electrophoresis on-the-chip (CGE-on-the-chip) system with a laser induced fluorescence (LIF) detector compared with the well-established one-dimensional planar gel electrophoretic method, sodium dodecyl sulphate polyacrylamide gel electrophoresis (SDS-PAGE), to get reliable information about the initial state of a complex biological protein sample before proteomic analysis. We studied four different Bothrops species, namely Bothrops alternatus [Figure 1(a)], Bothrops jararaca, Bothrops moojeni and Bothrops jararacussu, for intraspecies comparison and Crotalus durissus terrificus, a tropical rattlesnake, for interspecies comparison.

Figure 1
Experimental
All chemicals and solvents used were analytical grade except where otherwise stated. High-quality water was generated with a Simplicity ultrapure water system (Millipore, Billerica, Massachusetts, USA). Desiccated venoms [Figure 1(b)] from five snakes, namely Crotalus durissus terrificus, Bothrops jararaca, Bothrops jararacussu, Bothrops moojeni, Bothrops alternatus, were donated by the Instituto Butantan (Sao Paulo, Brazil). From each 2 mg of venom were reconstituted in 1 mL H2O containing 5 mM ethylenediamine tetraacetic acid (EDTA), for metalloprotease inhibition, and 20 mM β-octylglucoside, to assist solubilization. After centrifugation for 2 min at 13000 rpm all samples were immediately used for analysis without any storage.
One dimensional gel electrophoresis (1D GE) was performed on ready-made 4–12% Bis-Tris gels (NuPAGE, Invitrogen, Carlsbad, California, USA) with a 2-(N-morpholino)-ethane sulfonic acid (MES) buffer (Invitrogen, 50 mM MES pH 7.2, 50 mM Tris base, 0.1% SDS, 1 mM EDTA, pH 7.3 ) and on 16% Tricine gels according to Schägger20 (Invitrogen, 100 mM Tris base pH 8.3, 100 mM Tricine, 0.1% SDS, pH 8.3) respectively. Freshly thawed samples (4 uL) were mixed with 1 µL 4× lithium dodecylsulfate sample (LDS) buffer (Invitrogen, 40% glycerol, 564 mM Tris base, 424 mM Tris HCl, 8% LDS, 2.04 mM EDTA, 0.88 mM SERVA Blue G250, 0.7 mM Phenol Red, pH 8.5) and heated for 5 min at 95°C with and without the addition of dithiothreitol (DTT).
Total snake venom was (3 µg) applied on each gel lane. For the Tricine system, 5 µL Tricine sample buffer (Invitrogen, 900 mM Tris HCl pH 8.45, 24% glycerol, 8% SDS, 0.015% Coomassie Blue G, 0.005% Phenol Red) were mixed with 5 µL aqueous snake venom, heated with and without DTT at 95°C and 2 µg were applied on each gel lane. Gels were stained using either Coomassie brilliant blue R-250 after glutaraldehyde fixation or stained silver, according to a MS-compatible protocol.21 Qualitative and quantitative analysis of the SDS-PAGE was performed on the ImageMaster TotalLab software (GE Healthcare, Uppsala, Sweden) after scanning the gel. For molecular weight calibration a prestained protein marker (SeeBlue Puls2 prestained, Invitrogen) was used.
The CGE-on-the-chip analysis was performed on an Agilent 2100 Bioanalyzer (Agilent, Waldbronn, Germany) using the Protein P200- and the P80-LabChip kit (Agilent). Quantification and qualitative analysis was performed automatically using the dedicated protein assay software. All chips were prepared according to the protocol provided by the manufacturer. Briefly, 4 µL aqueous snake venom sample was mixed with 2 µL of the sample buffer provided with, and without, a reducing agent (DTT).
The solution was heated for 5 min at 95°C and further diluted with 184 µL H2O. The final sample preparation (6 µL), equivalent to 0.253 µg snake venom, was pipetted into the designated sample wells on the CGE-chip and electrokinetically injected. For correct molecular weight sizing a protein ladder consisting of well-defined proteins (Agilent) was treated the same way.
Results and Discussion
The basic principle of separation in slab GE is by masking the protein's net charge with SDS. SDS confers a negative charge to the polypeptide in proportion to its length, generating a constant mass-to-charge ratio (m/z) and thus the same electrophoretic mobility for every protein in solution when voltage is applied.22 A porous gel acts as a sieve by retarding, or completely obstructing, the movement of proteins while allowing smaller proteins to migrate freely. After a visualization step for the separated proteins a linear correlation between retardation indices and the logarithm of molecular weights (MWs) is used to determine the MW of the individual protein in an unknown sample. CGE-on-the-chip is a separation system for proteins where basically the same separation principles are used as for slab GE.23
Briefly, the proteins are treated with SDS to generate a homogenous m/z. For protein detection during the sample preparation step a fluorescence dye is interlaced in the SDS–protein complex. After that, the sample is loaded on a chip containing a sieving matrix which is a linear polymer, contrary to the networked structure of polyacrylamide/bisacrylamide in slab gels. Rather than using the migration distances measured in slab GE to calculate Rf values, migration times are obtained. MW determination is performed by comparing migration times of well-defined protein standards, which are added during sample preparation, to those of unknown analytes. The basic data for the CGE-on-the-chip system are electropherograms which can be displayed as gel-like images [see Figures 1(c)–(d)] for comparison with the basic data of a slab gel.
The CGE-on-the-chip-system allows two different gel-buffer compositions for separating proteins respectively. One is optimized for analysing low MW (P80) proteins up to 80 kDa, whereupon the second is deployed for biomolecules between 14–200 kDa (P200). As can be seen from Figure 1(c), Figure 1(d) and summarized in Table 1, a significant number of distinct proteins can be separated and detected from the different snake venoms. Bothrops species did not exhibit significantly different numbers of proteins compared with the Crotalus species using the separation system dedicated for the low mass region (P80), in which 12–15 peaks were observed under reducing conditions (+DTT).
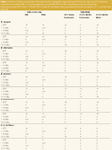
Table 1: Number of distinct protein bands of five snake venoms, investigated under reducing (+DTT) and non-reducing (-DTT) conditions, observed by two different CGE-on-the-chip-assays (low and high MW, P80 and P200 respectively) and by two different slab polyacrylamide gels (16% Tricine, 4â12% Bis-Tris). For slab GE, two different staining procedures were also compared. (n.d 5 no protein band detected).
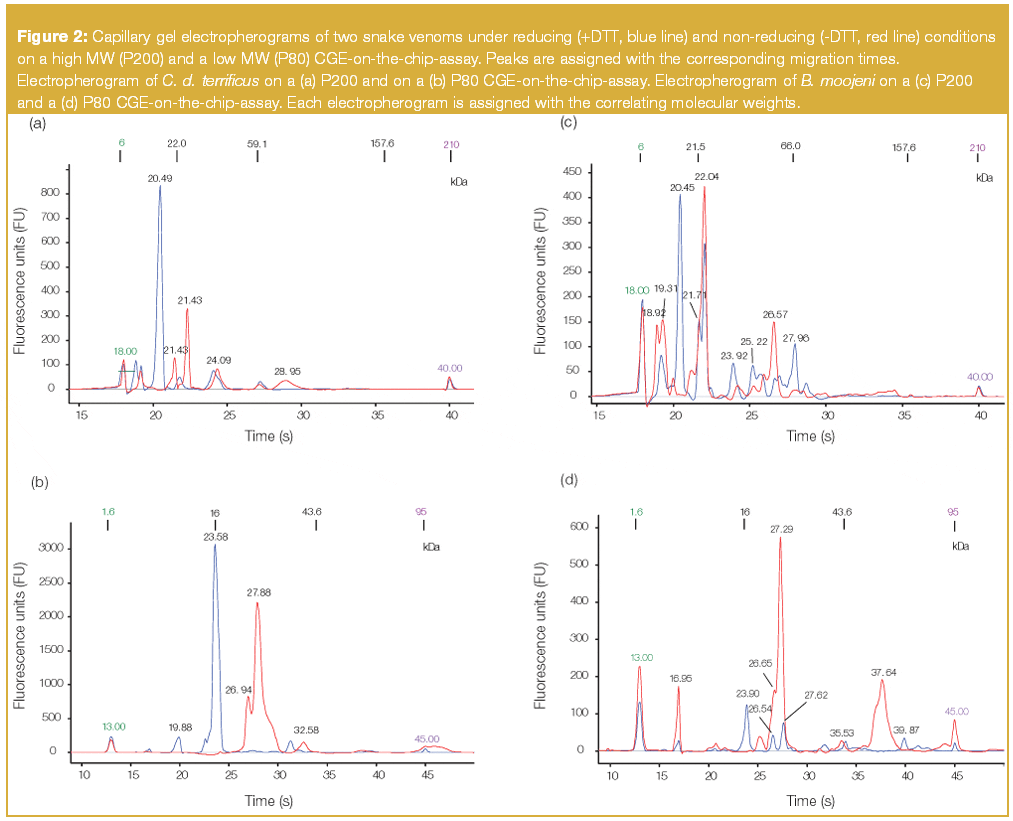
For non-reducing conditions (-DTT) significantly less compounds, only four distinct peaks, were detected for Crotalus durissus terrificus but 10–15 components were observed in Bothrops species. In contrast the high MW separation system (P200) exhibited significantly more peaks for the Bothrops species (+DTT: peaks 10–11, -DTT: peaks 10–16) than Crotalus (+DTT: peak 7, -DTT: peak 6). A closer look at the electropherograms of the latter, indicated that most of the proteins were located in the MW region below 75 kDa [Figures 2(a)–(b) and Table 1]. The high separation efficiency for compounds between 5–80 kDa on the P80 system enabled the observation of 12 distinct peaks which were partially lost on the P200 system by the overlapping of one or more compounds in the mid-mass region. In comparison only one component at 129 kDa, visible under non-reducing conditions on the P200 system, was not observed on the P80 system. For investigating and comparing snake venoms of Crotalus species the P80 protein chip was sufficient.
Figure 2
Bothrops species exhibited a more complex protein pattern under reducing conditions. Most of the peaks were observed in the already discussed mid-mass range between 15–75 kDa (Table 1). Nevertheless, crucial changes in the high MW region were observed, indicated by the presence and/or absence of distinct peaks at about 104–130 kDa for B. jararacussu, 105 kDa for B. jararaca and 100 kDa for B. alternatus (Figure 3). But still, more peaks were detected on the P80 system. These findings are valid for almost all snake venoms under non-reducing (-DTT) conditions except for B. moojeni venom which contained a significant amount of high MW proteins with 5 peaks above 95 kDa. (Table 1) With respect to quality control (QC) of snake venom samples, the benefit of additionally detected compounds above 95 kDa in the case of the P200 CGE-on-the-chip system does not compensate for the loss of peaks below 15 kDa and for the lower separation efficiency. In the case of sample degradation occurring during storage, which may be caused by enzymatic decomposition, the amount of low MW residues should increase and a good separation in this molecular mass region is obtainable.
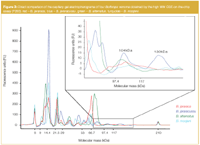
Figure 3
As shown in Figure 4 for the P200 system sample decomposition manifests itself in decreasing peak numbers and intensities in the molecular weight range above 50 kDa bringing more complexity to the low molecular mass region which is separated unsatisfactory below 30 kDa in this case but better manageable with the P80 system (data not shown).
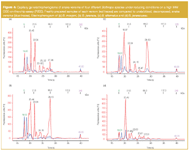
Figure 4
Molecular weight (sizing) accuracy certainly depends on the type of proteins investigated, but sizing reproducibility of 5% or even better can be achieved in most cases24,25 using the CGE-on-the-chip separation system. However, MW determination was difficult in both the P80 and P200 system. Overlapping signals of the upper MW marker with peaks emerging from the sample itself [see Figure 2(b)] lead to misinterpretation of peaks during automatic data evaluation. Assigning the low MW marker was in some cases difficult for the P200 system since many peaks of the sample interfere with the needed signal from the internal standard.
Planar gel electrophoretic systems have a broader variability of separation parameters for proteins. Different buffer systems can be used for the same percentage of crosslinking in the gel matrix showing better separation, for example, in the mid-to-high MW range (14–200 kDa), as it applies for 4–12% Bis-Tris gels used with a MOPS (morpholinopropane sulfonic acid) buffer.
Acceptable resolution for low and high MW proteins (3–200 kDa) can be achieved for the same gel type (4–12% Bis-Tris) used with a MES buffer as it is demonstrated in Figure 5(b) and Figure 5(c). In conventional slab GE snake venoms of Bothrops and Crotalus species are dominated by proteins and peptides in the low- and mid-mass region.

Figure 5
To get an overview of all compounds present a good separation between 2–80 kDa needs to be achieved to evaluate the actual biological/compositional state of the sample and also be able to draw conclusions about sample modifications, such as enzymatic degradation during storage (giving rise to low MW compounds expressed by increasing intensities of the appropriate protein bands) or protein depletion as a result of wrong sample handling observed by various decreasing signal intensities independent of a particular mass range.
Gradient gels with a MES buffer system show very good separation efficiency for proteins larger than 6 kDa but smaller compounds will not be retarded at all. The high resolving power between 3–70 kDa of 16% Tricine gels permits the observation of many distinct bands between 4–30 kDa [Figure 5(a)] but the high degree of crosslinking is significantly affecting the quality of separation for larger constituents. The assignment of single bands gets more complicated already in mid-molecular mass range at about 60 kDa. Under reducing conditions twelve to sixteen distinct protein bands were observed on the Tricine gel for the different snake venoms but only four to nine distinct compounds were detected on the Bis-Tris gel (Table 1).
Interestingly, under reducing conditions (+DTT) the Crotalus species sample showed the least number of bands on the Bis-Tris electrophoresis system, compared with those observed on both CGE-on-the-chip systems (P80 and P200), and Tricine slab gels, in which it exhibited the highest number of single protein bands. Under non-reducing (-DTT) conditions four to eighteen single components were distinguished on the Tricine gel and four to fifteen proteins were observed on the Bis-Tris gel. Indeed, under non-reducing conditions Crotalus exhibited again the fewest differentiable components. Considering the interesting MW region between 15–75 kDa the higher separation efficiency of the Tricine gel could be clearly determined. Except for B. alternatus and B. jararaca, missing 2 and 1 constituents respectively, in this region more proteins were detected on the Tricine gels than on the Bis-Tris gels.
The absolute protein amount applied for the analysis in slab gel electrophoresis (GE) and the CGE-on-the-chip-system is limited by the handling of very small amounts of liquids (see Experimental). The same stock solutions of venom were used for both systems initially, containing 2 mg dry snake venom per mL in the beginning, of which 4 µL were used for further analysis. Diluting the original samples with the manufacturer's buffers according to the dedicated protocols resulted in final applicable amounts of 2 µg of snake venom for the Bis-Tris and 3 µg for the Tricine gels and only 0.25 µg for the CGE-on-the-chip system.
In both techniques the sample amount was above the detection limit (LOD) to a considerable degree, because a complete protein pattern was required for evaluation. A complete protein pattern again demands enough sample to cover low and high abundant proteins within one analysis step. To detect low abundant proteins silver staining was necessary in the case of slab GE. As can be seen from Figure 5(b) and 5(c) and Table 1 a significantly higher number of protein bands can be observed below 14 kDa and between 15–75 kDa. The sensitive LIF detector of the CGE-on-the-chip system allows the detection of very small amounts (20 ng/µL bovine serum albumin) of material without loss of information. Only 10% of the material is injected for analysis giving comparable or sometimes even better results than slab GE (Table 1).
The time for sample preparation before instrumental analysis is almost the same for CGE-on-the-chip and slab GE. The CGE-on-the-chip system used during our work allowed automated protein analysis with little operating expenses thus speeding up the analysis time significantly compared with slab GE. Whilst the analysis time for one protein sample during CGE-on-the-chip takes about 3 min (or 30 min for a full protein chip containing 10 samples and one standard for MW sizing), the time required for one or more samples during slab (GE) is routinely 40 min for the small ready-made gels used in this study, and up to one hour or more if larger gels are used.
Time consumption increases further when polyacrylamide/bisacrylamide gels have to be made from basic ingredients.
Protein detection is performed on-line during CGE-on-the-chip with a LIF detector, whilst the time for the staining procedure of slab GE has to be considered. Coomassie brilliant blue staining is a universal visualization procedure which is also suitable for quantification but takes about 1–2 hours. The more sensitive silver-staining procedure takes up to 3 hours or can be extended to an overnight procedure depending on the analysis which is performed after electrophoresis. CGE-on-the-chip, where the samples cannot be recollected, stored or reused is purely analytical, whereas proteins separated by GE can be further processed by various techniques, such as MS, Edman sequencing or electroelution to collect single proteins.
Data evaluation is performed automatically directly after the analysis in the instance of the CGE-on-the-chip-system giving information about peak height, peak area, migration time and calculated MW of a specific compound. More experienced users do not have much opportunities, except correcting the labelling of the lower and upper MW marker, to take a hand in this process of baseline subtraction, peak detection or peak integration. Evaluating slab gel electrophoretic data comprises scanning the gel on a special flatbed scanner densitometrically followed by partially automated editing processes (protein band detection, baseline drawing, background subtraction, de-smiling and de-grimacing of single lanes, normalization before MW determination and calibration for quantification).
Taking all points together, evaluating data to get reasonable information about the biological "state" of a sample after accomplished gel electrophoretic separation is disproportionally more laborious for SDS-PAGE than it is for the CGE-on-the-chip-system. Comparing the total time consumption for 10 samples analysed on the CGE-on-the-chip system and on SDS-PAGE using ready-made gels without taking the time for preparing various buffers into account, it takes about 40 min on the automatized CGE-on-the-chip system but can take up to 6 hours or even 1 day (depending on Coomassie staining or silver staining) with SDS-PAGE to generate useful data.
Conclusion
Proteomic studies need a well-defined biological state of a sample before complex analysis strategies are worked out and quantification becomes feasible between different samples. Then these data can be used to answer questions derived from the fields of biology, medicine or biopharmaceutical industry. Therefore a screening method — fast, reliable, high throughput-capable and with a high significance — is needed before the real analytical experiment is started by using complex array of instruments and/or work flows.
Comparing a well-established method, planar SDS polyacrylamide GE, with capillary GE-on-the-chip showed that the application of slab GE is a very open technique, which can be adapted for different problems arising during snake venom analysis because of the high content of small proteins and peptides. By varying the degree and type of crosslinkage of the sieving gel matrix and the buffer composition many problems can be solved.
In the instance of snake venoms the best results concerning separation efficiency were achieved by using 16% Tricine gels. Staining procedures, to achieve highest sensitivity possible, have to be adapted for each type of samples and are very time consuming and hence limiting steps during these analyses. Tricine gels, using reducing conditions by adding DTT, combined with silver staining was by far the best combination for snake venoms, exhibiting up to 17 different protein bands. The disadvantage is that it takes one day or even longer to get meaningful results for sample evaluation, which should be answered more quickly.
In the instance of CGE-on-the-chip, the separation system is not so flexible since separation is limited to two different MW regions. High MW proteins can be separated up to 200 kDa with poor resolution below 15 kDa. The low MW proteins (region) are notably better separated with the second system designed for samples up to 80 kDa. Because snake venoms mainly consist of proteins below 75 kDa the low MW separation assay is well suited.
Despite the fact that the staining procedure cannot be changed and adjusted to special properties of snake venoms, the sensitivity of the LIF detection system permitted the observation of almost the same number of proteins as it was detected with an optimized protocol for slab GE. The biggest advantage of the CGE-on-the-chip system is the efficiency of the method where only a few hours are needed to prepare the samples, execute separation, evaluate the automatically performed interpretation.
The CGE-on-the-chip-system is a valuable alternative to conventional GE to get information of the "biological state" of snake venoms before subsequent complex proteomics studies.
Acknowledgements
We thank Andrea Zenker (Agilent Technologies, Basel, Switzerland), Martin Kratzmeier and Helmut Elgass (Agilent Technologies, Waldbronn, Germany) for supporting this work and helpful discussions as well as the early supply of the P80 assay.
References
1. F. S. Markland, Toxicon, 36, 1749–1800 (1998).
2. R. A. Barker et al., J Neurosci., 20, 3415–3424 (2000).
3. C. Marcinkiewicz, Cancer Res., 63, 2020–2023 (2003).
4. S, Bazan-Socha et al., Clin Exp Allergy, 36, 1184–1191 (2006).
5. S. H Ferreira and M. Rocha e Silva, Experientia, 21, 347–349 (1965).
6. H. Gavras, Clin Sci Mol Med Suppl., 2, 57s–60s (1975).
7. J.G. Johnson et al., Clin Sci Mol Med Suppl., 2, 53s–56s (1975).
8. S.M. Serrano, Proteomics, 5, 501–510 (2005).
9. M. Sasa, Toxicon, 37, 249–252 (1999).
10. J.M. Gutierrez, Rev Biol Trop., 28, 341–351 (1980).
11. M.C. Menezes, et al., Toxicon, 47, 304–312 (2006).
12. S. Schenberg, Science, 129, 1361–1363 (1959).
13. J.C. Daltry et al., Toxicon, 34, 67 (1996).
14. B.G. Fry, Genome Res., 15, 403–420 (2005).
15. L. Sanz, Journal of Proteome Research, 5, 2098–2112 (2006).
16. I.M.B. Francischetti et al., Comparative Biochemistry and Physiology Part C: Pharmacology, Toxicology and Endocrinology, 127, 23 (2000).
17. D. Lanzer et al., Peptides, 25, 1085–1092 (2004).
18. D. C. Koh, A. Armugam and K. Jeyaseelan, Cell Mol Life Sci., 63, 3030–3041 (2006).
19. L.F. Izidoro et al., Bioorg Med Chem., 14, 7034–7043 (2006).
20. H. Schägger and G.von Jagow, Anal Biochem., 166, 368–379 (1987).
21. A. Shevchenko et al., Anal Chem., 68, 850–858 (1996).
22. R. Westermeier, Electrophoresis in Practice (Wiley-VCH, Weinheim, 2001).
23. L. Bousse et al., Anal Chem., 73, 1207¬–1212 (2001).
24. P. Barthmaier, Fast analysis of proteins between 5–50 kDa using Agilent 2100 bioanalyzer and Protein 50 assay. Agilent Application Note Publication Number 5988-8322EN (2002).
25. M. Kuschel et al., J Biomol Techn., 13, 172–178 (2002).
Martina Marchetti got her PhD in chemistry from the University of Vienna. In 2003 she became assistant professor for bio- and polymer analysis at the Institute of Chemical Technologies and Analytics of the Vienna University of Technology. Her main research interests are method development for proteomics (with applications in the field of allergens, microorganisms,
disease-model systems) and MALDI- as well as ESI mass spectrometry of biomolecules and high mass polymers.
Walter Welz obtained his PhD in biology and biochemistry from the University of Graz. He joined the department of pediatrics of the University of Graz as assistant professor and then joined the pharmaceutical industry as head of the QC department. Since 1996 he is an independent consultant for chemical and biological analysis. During the last years his main focus was the search and development of drugs and cosmetics based on active agents derived from the Amazon rain forest. Furthermore he is working at the Institute of Analytical Chemistry at the Johannes Kepler University of Linz.
Günter Allmaier holds the position of a full professor of analytical chemistry and is head of the research division of Instrumental Analytical Chemistry at the Institute of Chemical Technologies and analytics of the Vienna University of Technology. His research interests are laser- and spray-based mass spectrometric techniques, lab-on-the-chip bioassays and gas-phase electrophoretic macromolecule mobility analysis (GEMMA) on one hand focused on instrument development and on the other hand directed towards proteomics, drug- and polymer analysis as well as nanoparticle characterization.

New Method Explored for the Detection of CECs in Crops Irrigated with Contaminated Water
April 30th 2025This new study presents a validated QuEChERS–LC-MS/MS method for detecting eight persistent, mobile, and toxic substances in escarole, tomatoes, and tomato leaves irrigated with contaminated water.
University of Tasmania Researchers Explore Haloacetic Acid Determiniation in Water with capLC–MS
April 29th 2025Haloacetic acid detection has become important when analyzing drinking and swimming pool water. University of Tasmania researchers have begun applying capillary liquid chromatography as a means of detecting these substances.

.png&w=3840&q=75)

.png&w=3840&q=75)


.png&w=3840&q=75)


.png&w=3840&q=75)


