Quality Control and Advanced Characterization of Membranes
LCGC Europe
Because GPC is a reliable, simple and fast characterization method it can be readily adopted to investigate the separation behaviour of membranes.
Membrane technologies have emerged in recent years as a viable and cost-effective alternative to various purification and separation methods. Membrane processes can provide
- a barrier against microbes and pathogens
- an effective way to disinfect by-products
- fewer treatment unit processes
- higher process efficiency at lower costs
- application to a broad range of water qualities.
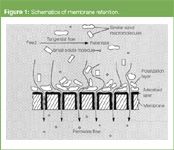
Figure 1
Membranes play an important role in many aspects of life (Figure 1 and Table 1).1,2 Biological membranes control our body's metabolism, artificial phospholipid membranes can be used for drug delivery and synthetic membranes allow kidney patients to live until a transplant is available. Membranes with special adsorption properties are used for selective removal of unwanted compounds in pharmaceutical and fine chemical production processes. Synthetic membranes are used for sterile filtration, water treatment, energy-efficient purification of solvents and many more processes (Table 2).

Table 1: Sales of membrane industry.
The membranes can only meet the requirements in such important processes if they show the proper membrane properties (Table 3). Consequently, the characterization of membrane properties and quality parameters is very important.3–6 Quality testing should also be fast, efficient, reliable and reflecting the application (i.e., not in a vacuum or dry state).
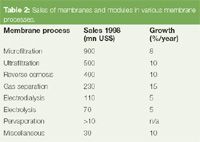
Table 2: Sales of membranes and modules in various membrane processes.
Most of the listed properties can be assessed by the proposed SEC method; only the last two properties cannot be measured by SEC methods easily. In contrast, traditional characterization methods by latex particles and proteins, for example, are slow and tedious, reflect only a single parameter (such as bubble point) or cannot be used in the final product (the membrane is analysed separately in an early stage that doesn't reflect the product properties). This article shows how liquid chromatography (LC) can be used to overcome several of the disadvantages of traditional methods. The authors employed SEC to characterize either the membrane itself or the membrane in the final product in both a comprehensive and simple way. Standard chromatography equipment can be used as it is readily available in most laboratories. No special staff training is necessary to perform the tests. This technique can be a cost-effective alternative or addition to the more traditional membrane characterization methods.
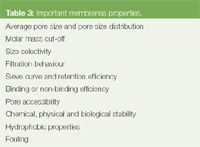
Table 3: Important membranes properties.
Description of Membrane Characterization Technique
This membrane characterization method is based on the filtration of a probe molecule of known size or molecular weight.7 The probe molecule (e.g., a broad molar mass dextran sample) is dissolved in water (stock solution) and filtered through the membrane (Figure 2).
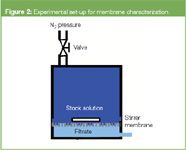
Figure 2
Please note that the fractionation results (i.e., the separation characteristics of the membrane, depend on filtration conditions, such as cross flow and backpressure).8–9
Only those molecules smaller than the membrane pores will be able to penetrate through the membrane into the filtrate while larger molecules will remain on the feed side (retentate). If the chosen probe sample has a broad molar mass distribution (i.e., size distribution), a single filtration experiment can probe the complete pore size range of the membrane in the wet state. The ability to test the membrane under field operating conditions is important if swelling or non-permanent porosity has to be considered for the membrane quality.
Because GPC is a reliable, simple and fast characterization method it can be readily adopted to investigate the separation behaviour of membranes (planar or fibre like).10–12 A known sample (stock solution) is separated by the membrane and filtrate and retentate solutions can be injected into the GPC instrument for the determination of concentrations, retention and molar masses (see Figure 3). Permeation and retention behaviour of the membranes across the whole pore size range can be derived from two injections. The resulting sieve curves are directly generated by the chromatography software.
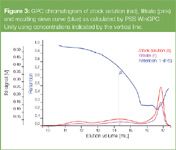
Figure 3
Description of Chromatography
Two types of membranes were investigated: plane membranes from regenerated cellulose and poly(ether sulphone) hollow fibre membranes. Plane and hollow-fibre membranes require different filtration set-ups. In the situation of plane membranes a commercial dialysis cell was used to permeate a stock solution of known molar mass distribution (Figure 2). For hollow-fibre membranes a dedicated filtration tester was used.7
Standard SEC procedures were employed.10–12 The test compound used in the experiments was a 0.5% aqueous solution of a broad dextran polymer standard (PSS Polymer Standards Service, Mainz, Germany, lot# dxt70) with a well known molar mass distribution (Mw = 66000 Da, Mw/Mn = 1.75).
The filtrate and the retentate were collected and the solutions were injected into the chromatograph. A conventional GPC instrument GPC1100 equipped with PSS Suprema 1000 + 30 columns (8 × 300 mm each) and operated by PSS WinGPC Unity scientific GPC software (both from PSS Polymer Standards Service) was used to characterize the membranes by size-exclusion chromatography using standard GPC conditions. Calibration was performed with PSS dextran reference materials to measure accurate molecular weights and pore diameters. The pore size was calculated using the Rg–M relationship published by Smit.13
Determination of Membrane Parameters and Results
The membrane properties can be obtained by a specific comparison of the concentration profiles (GPC elugrams) of the stock solution (depicted as indexS) and the filtrate (indexF) and retentate (indexR).
For example, the retention behaviour, R, of a synthetic or natural membrane can be described by the amount, c, and size, d (or molar mass, M) of the solutes that are retained for each size (or elution volume as measured by GPC).

At each position in the GPC chromatogram, the molar mass of the retained species is known from molar mass calibration.
Figure 3 shows the GPC chromatogram of the stock solution (red), filtrate (pink) and the resulting sieve curve (blue) as calculated by the software using concentrations indicated by the vertical line. It describes the filtration behaviour of the membrane that is directly related to its average pore size and pore size distribution. It can be calculated in different ways (user selectable) and can be expressed in terms of pore diameter, molar mass or elution volume.
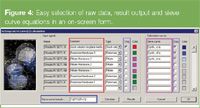
Figure 4
Sieve curve determination: The software allows the user to enter the sieve curve equation. An example of a sieve curve, S, calculation using the stock solution (CS), the filtrate (CF) and the retentate (CR) is shown in Figure 4 (blue rectangle) but other equations have been used in the literature.

Several membranes can be characterized in a sequence and processed automatically. Overlays of the raw chromatograms and the retention behaviour can be obtained easily. Figure 5 shows the graphical representation of the property determination for three membrane showing very different filtration characteristics. Even minor property differences can be visualized with the overlay results.
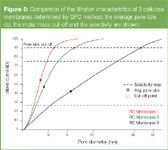
Figure 5
Cut-off molar mass: This molar mass value defines the retention of a given amount of sample; typically 90% is used as the molar mass cut-off. However, additional retention parameters can be useful to answer specific questions or for in-depth comparison of different membranes. Figure 5 shows the 90% cut-off results for different regenerated cellulose membranes. The screen shot (Figure 6) shows the on-screen result dialogue and the user specified five retention levels (blue rectangle) for in-depth membrane comparison. If 100% retention is not reached, the respective result field in the screen dialogue shows zero. If a result is not trustworthy or unique (more than one cut-off value) the software also flags that (red rectangle in Figure 6).
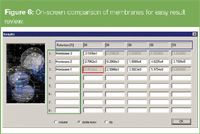
Figure 6
Average pore size, dp: The average pore diameter, dp, can be determined at the inflection point of the sieve curve, S, expressed in pore size, d.

The pore size can be calculated from known molar mass using the following equation.

In this work the Rg–M relation of Smit et al.13 was used to determine the pore radii based on the primarily measured molar masses. Results for the investigated membranes are shown in Table 4.

Table 4: Result summary for membrane characterization by GPC methods.
Membrane selectivity, D: Size selectivity is an important membrane performance parameter and can be easily determined by the proposed GPC method. The selectivity of a membrane is typically determined at 25% and 75% retention, but the software allows the user to specify the threshold parameters.

Where ideal selectivity is achieved (D = 1) the membrane would only allow a single size to pass through the pore. If all molecules could migrate through the membrane no selectivity would be achieved and the selectivity parameter would be infinite (D = ∞). The obvious selectivity difference of the membranes shown in Figure 5 is well reflected by the numerical results in Table 4.
Conclusion
The characterization of membranes by size-exclusion chromatography of dextran macrosolutes is an efficient method to study the filtration process through membrane pores. The analysis of the transfer of the probe molecules through the membrane yields filtration profiles and sieve-curves that show the separation characteristics of the membranes. Parameters identifying membrane behaviour such as molar mass cut-off, pore-size dispersity and membrane selectivity can be used easily in membrane research and QC.
Peter Kilz is leader of the PSS software developement team. He received chemistry degrees at the Universities of Mainz (Germany) and Liverpool (UK).
Martin Viktorin works as a chemist in the Department of Precipitation Membranes at the R&D Biotechnology Divison of Sartorius AG, Göttingen, Germany. He is responsible for developing analytical methods for membrane production technology and membrane characterizations.
References:
1. H. Strathmann; Economic assessment of membrane processes; in: Separation and purification technology, N.N. Li, J.M. Calo, Eds, (Marcel Dekker, New York, USA, 1992) p. 1.
2. E. Drioli, Ind. Eng. Chem. Res., 40, 1277 (2001).
3. A.R. Cooper and D.S. van Derveer, in: Ultrafiltration Membrane Characterization, (Croydon, UK, 1979) p. 455.
4. A.N. Cherkasov et al., Colloid. J. USSR, 43, 661 (1981).
5. G. Träghardh and K. ölund, Desalination, 58, 115 (1986).
6. P.E. Barker, R.M. Alsop and G.J. Vlachogiannis, J. Membrane Sci., 21, 79 (1984).
7. P. Kilz, Characterization of Membranes by SEC, Polym. Sci. Mat. Eng., 77, 56 (1997).
8. G. Schock, A. Miquel and R. Birkenberger, J. Membrane Sci., 41, 55 (1989).
9. H. de Balmann and R. Nobrega, J. Membrane Sci., 40, 311 (1989).
10. P. Kilz, Optimization of GPC/SEC Separations, in HPLC Made to Measure, S. Kromidas, Ed., (Wiley, Weinheim 2006).
11. D. Held and P. Kilz, Characterization of Polymers by Liquid Chromatography, Macromolecular Symposia, 231, 145 (2006); DOI 10.1002/masy.200590019.
12. U. Just et al., Polymer Reference Materials: Round-Robin Tests for the Determination of Molar Masses, Int. J. Polym. Anal. Charact., 10, 225 (2005); DOI: 10.1080/10236660500418039.
13. J.A.M. Smit et al., Macromolecules, 25, 3585 (1992).

ISC 2024: An Interview with Amarande Murisier
October 8th 2024As part of our ISC 2024 coverage, we recently interviewed Amarande Murisier of the University Hospital of Lausanne, Switzerland (CHUV) about her winning the Rising Stars of Separation Science Award for Biopharmaceutcal Analysis and her scientific background.


