A QbD with Design-of-Experiments Approach to the Development of a Chromatographic Method for the Separation of Impurities in Vancomycin
Special Issues
Analytical methods are developed at various stages of the drug develoment process for samples of varying complexity.
APPLICATION BENEFITS
Using specialized software in conjunction with UPLC® Technology, an optimized QbD method for the impurities in vancomycin can be developed that will be robust for method validation and transfer.
WATERS SOLUTIONS
ACQUITY UPLC®
Fusion Method Development
Empower™ 2 CDS
KEY WORDS
Quality by design (QbD),
method development,
design of experiment (DOE)
INTRODUCTION
Analytical methods are developed at various stages of the drug develoment process for samples of varying complexity. Due to the inherent nature of the method development process, redundant efforts take place across an organization, resulting in a very costly and time-consuming activities. If we can streamline the process by which we develop methods, products can be brought to market faster and in a more cost effective manner.
Many different approaches are typically used to develop chromatographic methods today including trial and error, method/column scouting, and software approaches such as first principles approaches and simplex optimization procedures. All these approaches suffer from the inability to determine complex interactions effects between method variables or measurably consider method robustness during the method development process.
Vancomycin is a tricyclic glycopeptide antibiotic derived from Amycolatopasis orientalis (formerly Nocardia orientalis) and is indicated for the treatment of serious or severe infections caused by susceptible strains of methicillin-resistant (beta-lactam-resistant) staphylococci. Vancomycin is a large molecule (MW 1485.71 daltons) and contains many impurities that are difficult if not impossible to separate. Traditional HPLC gradient methods have shown the ability to separate out as many as 13 of these impurities, while the use of sub-2-μm ACQUITY UPLC Column chromatography has demonstrated the separation of as many as 26 impurities.
This paper describes a novel method development approach using Quality by Design (QbD) with Design of Experiments to develop a UPLC method for separating 39 impurities in vancomycin resulting in an optimally performing analytical method while simultaneously applying robustness limits to ensure success in final method validation and ultimately in method transfer.
EXPERIMENTAL
Analytical instrumentation
The vancomycin studies described here were carried out using an automated integrated system consisting of Fusion Method Development Software, Empower 2 Chromatography Data Software (CDS), and an ACQUITY UPLC System with PDA, Column Manager, and Solvent Select Valve allowing for the screening of up to four different column chemistries, six different aqueous buffers/pHs, and two different organic mobile phases in one run.
Data management
Fusion Method Development Software (S-Matrix Corporation, Eureka, CA) is a Quality by Design based LC Method Development software package with built-in robustness metrics. Fusion includes a built-in interface with the Empower 2 CDS Software that controls the ACQUITY UPLC System. Using the chromatographic results collected from Empower 2 CDS, Fusion manages complex statistics and models for method optimization. Fusion builds experiments, analyzes data, and presents results as visual and numerical method predictions.
RESULTS AND DISCUSSION
Phase 1: Rapid screening
Experiment design
The first phase of the method development involves the screening of the major effectors of selectivity, primarily the column chemistry, buffer pH, and organic mobile phase. The variables and ranges screened along with the constant conditions are listed in Figure 1's tables.


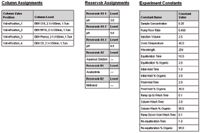
Figure 1. Screened variables and ranges.
Overlay graphics
The experimental design is run and data processed on the chromatographic system and the results are imported back into Fusion. The software predicts the optimum LC method after modeling all significant effects – linear, interaction, and complex – on each critical method performance characteristic. The unshaded (white) area of the overlay graph shown for the BEH C8 column with methanol as the organic mobile phase (Figure 2) highlights the experimental region where the mean performance goals are obtained.

Figure 2. Processed data are imported to Fusion, where an overlay graph illustrates in white the region where the mean performance goals are achieved.
Optimization
The Automated Optimizer wizard defines the LC method performance goals and ranks them in order of importance. The software searches for the LC method that meets all the performance goals simultaneously. The best result(s) are reported along with predicted results for an experimental run (Figure 3). These conditions are used for the next stage, Method Optimization.

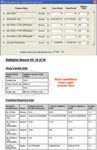
Figure 3. Fusion’s Automated Optimizer facilitates determination of the LC method that meets all performance goals.
Phase 2: Method optimization
Experiment design
Phase 2 experiments use the column (ACQUITY UPLC BEH C8, 2.1 x 100 mm, 1.7 μm) and mobile phase (pH 5.0 buffer, methanol B solvent) results from Phase 1 plus additional variables with tighter ranges to determine the optimum LC method. The experimental design is created using pump flow rate, gradient time, final percent organic, and column temperature as final optimization variables in the ranges shown (Figure 4).

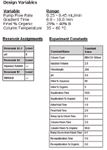
Figure 4. Fusion determines optimal method conditions and exports this information back to Empower 2 to be run and processed.
Fusion Software creates the experimental design and exports it to Empower 2, automatically creating all the necessary instrument methods, method sets, and sample sets. The experimental design is run and data processed on the chromatographic system and the results are imported back into Fusion.
In addition to the data analysis for method optimization, Fusion applies a combination of Monte Carlo Simulation and Process Capability statistics to evaluate method robustness without running additional experiments.
Multiple response surface plots
Visualizing the results with Fusion's 3D Response Surface Plots demonstrates the combined effects of variables on key chromatographic responses such as resolution, peak tailing, and retention time. Colors represent the magnitude of interaction and the curvature indicates the type of interaction (Figure 5).

Figure 5. Surface plot responses.
Multiple response effects plots
Another option for visualizing the interactions between variables is through Multiple Response Effects Plots. These plots clearly identify simple linear additive effects (1), complex interactions of variables (2), and other types of response effects (Figure 6).
Figure 6. Effects plot responses.
Final results of method optimization
Next, an overlay graph is created using a number of critical chromatographic responses. Of primary importance for the vancomycin separation is maximizing the number of peaks observed and the number of peaks exceeding different levels of resolution while minimizing the area of the vancomycin peak, which equates to separating out the most impurities. The overlay graph shows the QbD Design Space (unshaded region) where the method meets the mean performance goals and robustness criteria (Figure 7).

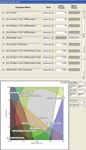
Figure 7. In the final overlay graph, the optimal QbD Design Space is the white or unshaded area.
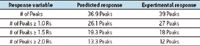
Using ranked response variables, the Method Optimizer determines the optimum method to best meet the performance and robustness goals specified. The final method conditions are listed along with predicted response results with confidence limits for this method (Figure 8).

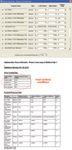
Figure 8. The Method Optimizer determines the optimum method to meet performance and robustness goals, and lists the final method and predicted responses.
Phase 3: Confirmation
Optimization results
The optimum method determined by the Fusion Method Optimizer was:
Column: ACQUITY UPLC BEH C8 Column, 2.1 x 100 mm, 1.7 μm
Mobile phase A: 10 mM Ammonium Acetate, pH 5.0
Mobile phase B: Methanol
Flow rate: 0.427 mL/min
Gradient: 5% to 29.66% Methanol in 8.85 min
Column temp.: 46.3 °C
This method was exported to Empower 2 and the vancomycin sample was run to evaluate the prediction accuracy. The chromatogram in Figure 9 shows the separation of vancomycin impurities obtained with the optimized method.

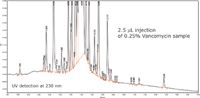
Figure 9. Confirmation run of the final UPLC method recommended by Fusion Software, where the number of impurities observed increased from 26 to 39.
The experimental results compare favorably with Fusion Software's predictions.

The QbD-based Fusion Software method improved the separation of impurities in vancomycin from 26, obtained previously with UPLC methods developed manually, to 39 impurities observed with the method shown.
CONCLUSIONS
- Fusion Method Development Software, used with the ACQUITY UPLC System, generated an optimized method for the analysis of vancomycin and its impurities in two business days.
- The use of UPLC data managed and processed by Fusion and Empower 2 software established a valid design space with both mean performance (set point optimization) and robustness (operating space).
- The QbD method's resolution improved from 26 peaks in previous method to 39 peaks.
- Integrated robustness calculations ensure a reproducible method, which increases confidence in the ability to validate and transfer that method.
Waters Corporation
34 Maple Street
Milford, MA 01757 U.S.A.
T: 1 508 478 2000
F: 1 508 872 1990
S-Matrix Corporation
1594 Myrtle Avenue
Eureka, CA 95501 U.S.A.


Polysorbate Quantification and Degradation Analysis via LC and Charged Aerosol Detection
April 9th 2025Scientists from ThermoFisher Scientific published a review article in the Journal of Chromatography A that provided an overview of HPLC analysis using charged aerosol detection can help with polysorbate quantification.


Analyzing Vitamin K1 Levels in Vegetables Eaten by Warfarin Patients Using HPLC UV–vis
April 9th 2025Research conducted by the Universitas Padjadjaran (Sumedang, Indonesia) focused on the measurement of vitamin K1 in various vegetables (specifically lettuce, cabbage, napa cabbage, and spinach) that were ingested by patients using warfarin. High performance liquid chromatography (HPLC) equipped with an ultraviolet detector set at 245 nm was used as the analytical technique.

Removing Double-Stranded RNA Impurities Using Chromatography
April 8th 2025Researchers from Agency for Science, Technology and Research in Singapore recently published a review article exploring how chromatography can be used to remove double-stranded RNA impurities during mRNA therapeutics production.


