Pyrolysis–Liquid Chromatography for the Analysis of Acrylic Resins
LCGC Europe
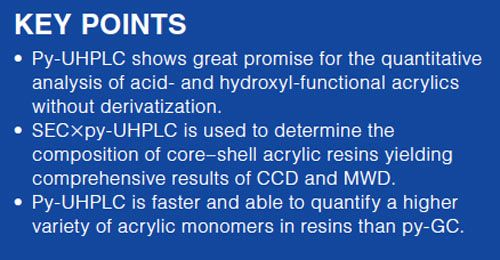
The determination of the chemical composition distribution of acrylic resins is not straightforward. Pyrolysis–gas chromatography (py-GC) analyses of acrylic resins can yield problems in the recovery of the hydroxyl and acid functional fragments that form. To overcome these problems pyrolysis–liquid chromatography (py-LC) can be performed. This article describes how the validation and quantification of hydroxyl acrylate-, hydroxyl methacrylate-, hydroxyl propylacrylate-, and hydroxyl propylmethacrylate resins by py-LC is performed. Furthermore, off-line size-exclusion chromatography (SEC) coupled to py-LC is performed to determine the chemical composition distribution over the molecular weight distribution of a core–shell waterborne acrylic resin.
Aschwin van der Horst, Yannic van Hooijdonk, and Afke Kroes, Nuplex Resins, Bergen op Zoom, The Netherlands.
The determination of the chemical composition distribution of acrylic resins is not straightforward. Pyrolysis–gas chromatography (py-GC) analyses of acrylic resins can yield problems in the recovery of the hydroxyl and acid functional fragments that form. To overcome these problems pyrolysis–liquid chromatography (py-LC) can be performed. This article describes how the validation and quantification of hydroxyl acrylate-, hydroxyl methacrylate-, hydroxyl propylacrylate-, and hydroxyl propylmethacrylate resins by py-LC is performed. Furthermore, off-line size-exclusion chromatography (SEC) coupled to py-LC is performed to determine the chemical composition distribution over the molecular weight distribution of a core–shell waterborne acrylic resin.
Pyrolysis is a technique that has been used by humans since prehistoric times. Tsuge (1) reported in his review a short historical overview of the maturity of pyrolysis. In most of the literature - and also reported by Tsuge - Williams (2) was the first to perform analytical pyrolysis when he observed isoprene and dipentene in the pyrolysate of natural rubber. It then took a long time before pyrolysis was adapted as a common analytical method for the analysis of (synthetic) polymers. With the introduction of mass spectrometry (MS) and the coupling of MS to gas chromatography (GC–MS), the development of pyrolysis hyphenated to GC (py-GC) took a giant leap. Different groups of researchers were involved in taking on the challenge of coupling pyrolysis to GC. Zemany (3) was probably the first to couple MS to pyrolysis (py-MS): he studied the thermal degradation products of biopolymers in 1952 with direct coupling of py-MS. In the expansion period (1952–1964) several types of pyrolyzating devices were developed to aid in the improvement of pyrolysis. These include heated furnace, heated filament, and Curieâpoint pyrolysis (4–6). The last was developed in 1964 by Simon and Giacabbo (5,6) and is currently one of the most applied py-GC systems.
In our research group we use both the Curie-point and the falling cup (heated furnace) pyrolysis hyphenated to GC–MS. In our research on the composition distribution of hydroxyl functional acrylic resins we often use the latter. Nevertheless, quantification without determining the hydroxyl number by titration is very difficult to achieve. Because of the good quantitative behaviour of the Curie-point pyrolysis hyphenated to GC by flame ionization detection (FID), we are able to determine the acrylic composition of waterborne and solvent-borne resins. Py-GC–FID shows very good results for commonly used non-polar acrylic monomersmethyl-methacrylate (MMA), methyl acrylate (MA), butyl methacrylate (BMA), butyl acrylate (BA), 2-ethyl hexylacrylate (2-EHA), 2-ethyl hexylmethacrylate (2-EHMA), and styrene (Sty). However, for acid functional and hydroxyl functional acrylic monomers the recovery is dependent on the concentration. The presence of higher concentrations of hydroxyl-functional (–OH) acrylic monomers in the resin shows moderate abundance, however, low concentration of –OH functional monomers show poor reproducibility. The cause of the latter is mainly a result of polarity problems yielding asymmetrical broad peaks in GC. For the analysis of acid functional (–COOH) acrylics, a derivatization method has been developed and is reported by Sharp (7), who derivatized the –COOH acrylic containing polymers with N,N-dimethylformamide-dipropylacetaal - an elegant method for solvent-borne acrylics because propylacrylate monomers are not used in industrial produced resins. Derivatization of waterborne acrylics on the other hand shows recovery problems and is therefore not suitable for quantification of –COOH functional acrylics (7,8).
In addition to py-GC–MS and because of the latter problem with polar acrylics, py-LC analysis of acrylic polymers is often performed in our research group for the quantification of –OH- and –COOH-containing polar acrylic resins. LC of residual acrylic monomers was developed in our laboratory by Kossen (9). This was fundamental for the development of an in-house py-LC method. The reported LC method is able to separate and quantify up to 20 non-polar and polar acrylic monomers in one series by reversed-phase LC.
Py-LC of acrylic and methacrylic acid was performed by Wang, Gerhart, and Smith (10) in 1995. They performed offâline pyrolysis of the latter with good abundance in LC coupled to UV detection at a wavelength of 210 nm. In our research group this method was adapted for the development of an on-line pyrolysis–high performance liquid chromatography (py-HPLC) method. The on-line pyâHPLC of acid-functional acrylic resins has already been published by the author (11). The goal of this research was to quantify the hydroxyl acrylic content in “homemade” standards made in an automated synthesizer. Furthermore, a waterborne acrylic core–shell polymer was determined by size-exclusion chromatography (SEC). Fractions were then collected and introduced into the pyrolysis–ultrahighâperformance liquid chromatography (py-UHPLC) system to determine its chemical composition distribution (CCD) and molecular weight distribution (MWD). Coupling of two-dimensional critical chromatography to pyrolysis was performed earlier by Kaal and co-workers, who fractionated fractions of a tri-block copolymer and analyzed it with py-GC–MS to determine the CCD and MWD (12). This article reports the first SEC×pyâUHPLC analysis of acrylic resins.
Experimental
Pyrolysis-GC–MS: All samples were dissolved in tetrahydrofuran (Biosolve) prior to analysis before being applied on a Curie-point pyrolysis wire or cup of 625 °C (GSG). The wire or cup applied with polymeric material and with a concentration of about 5–20 µg of polymer material was dried for 4 h in a vacuum stove at 120 °C. Py-GC–MS analysis of the latter was performed on a GC–MSD or GC–FID (both Agilent). The falling-cup auto-shot sampler AS-1020E pyrolyzer (Fronier Lab) was set at a pyrolyzing temperature of 625 °C. The falling-cup pyrolyzer was used in the singleâshot mode; double shot can be used to evaporate solvent prior to pyrolysis. Samples were analyzed on a 30 m × 0.25 mm, 0.25-µm Heliflex Cap column (Grace). After identification with MS, they were quantified by GC–FID using styrene or methyl methacrylate as a response marker. These monomer fragments were chosen because of their presence in commercially available resins.
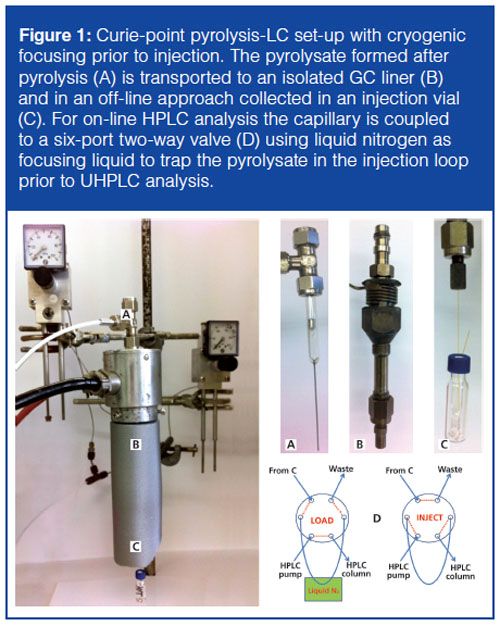
Pyrolysis-LC: Py-LC was performed on an Acquity UPLC system (Waters) applied with a photodiode array detector (Waters). The solvents used for gradient separation of the acrylic polymers were UHPLC-gradient grade acetonitrile (Actu-All Chemicals) and UHPLC water (Biosolve). To avoid peak splitting as reported by Kossen (9), a 0.1% ultrapure o-phosphoric acid (Merck) mixed with both gradient solvents (water and acetonitrile) was used in the applied gradient. For the separation a 50 × 2.1 mm, 1.7-µm BEH-C18 column (Waters) was used with a flow-rate of 1.0 mL/min; sample injection volume was set to 1.50 µL. The pyrolysis set-up coupled to the UHPLC system is homemade from a GC-injector (PerkinElmer) equipped with an aluminium injection extension. In this extension a septum was placed for the pyrolyzing unit. Nitrogen with a gas flow of 7.5 mL/min was used during pyrolysis. The pyrolysate was focused on a fused silica injection capillary by cryogenic trapping with liquid nitrogen, as described in previous work (11). A schematic overview of the “self-built” pyrolysis unit is presented in Figure 1 and is developed according to the model described by Wang, Gerhart, and Smith (10).
Two-Dimensional SEC×py-UHPLC: An aliquot of an unknown waterborne acrylic core–shell polymer material was dissolved in tetrahydrofuran (Biosolve) over night. After dissolving the sample, it was injected on a 717 plus autosampler, 600 system controller, and 996 PDA detector (all Waters) equipped with a 300 mm × 25 mm, 10-µm PL-Gel Preparative Mixed-B (Polymer Laboratories). Flow rate used was 5 mL/min. Fractions of 2.5 mL were collected manually. From these fractions an aliquot of 50 µL was dried for 30 min in a pyrolyzing cup in a vacuum oven at 105 °C prior to analysis by py-UHPLC. The experimental conditions for pyâUHPLC are explained in the previous paragraph.
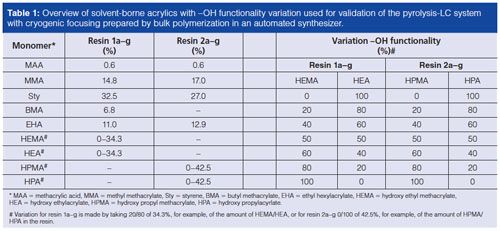
Samples: The –OH functional acrylics used in this study were synthesized in a Autoplant A-100 automated synthesizer (Chemspeed). A variation was made in the concentration
–OH functional acrylics in the model resins. The robot used to synthesize these acrylics was equipped with a four-needle head using an array of 16 parallel 100-mL reactors made from stainless steel. The atmosphere in the automated synthesizer was maintained by using a 100 bar overpressure of nitrogen gas over the reactor and a 1.5 bar pressure in the hood to avoid contact with oxygen. The model solvent-borne –OH functional acrylics were made by bulk polymerization, 15% of the monomer mixture was heated to 158 °C. A variation was made in the formulation for the presence of hydroxy etheylacrylate (HEA), hydroxy ethyl methacrylate (HEMA), hydroxy propylacrylate (HPA), and hydroxy propyl methacrylate (HPMA). When the temperature was reached, the rest of the monomers were fed from the monomer tank to the reaction vessel. The temperature was kept constant during the feeding of the monomer mixture for 105 min. After dosing all the monomers the vessel was cooled to 110 °C and the reaction was then boosted with a peroxide-boosting agent to reduce the monomer residual content. Table 1 presents an overview of the –OH variation in resins 1 and 2, which were used as standard validation material. From the total amount of –OH functional acrylic in, for example, sample 1 (34.3% total –OH acrylic), the HEMA/HEA concentration varied from 0–100% of the total 34.3% –OH functional acrylic. For sample 2 this variation was made of 42.5% total –OH functional HPMA/HPA.
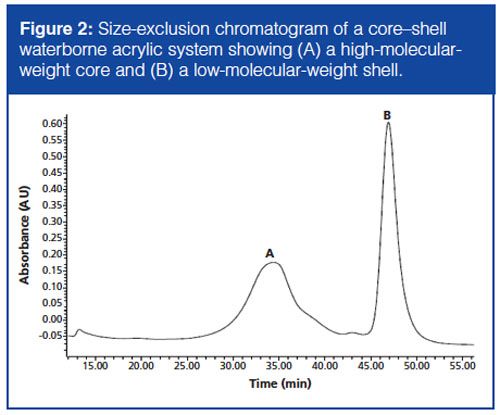
The waterborne acrylic core–shell resin was given by the synthesis department of Nuplex and no further information on the origin and/or synthesis of this polymer was given. The waterborne resin consists of a core and a shell: the main question was to determine the chemical composition of the core and the shell. The sample was analyzed by SEC to determine the MWD of the polymeric system. Since the core and the shell have different MWDs, an estimation of the high molecular weight of the core and low molecular weight of the shell could be made (Figure 2). Furthermore, the CCD of the core–shell system was determined. The latter was performed by analyzing the sample with py-UHPLC after fractionation by SEC - yielding a two-dimensional SEC×pyâUHPLC chromatogram and resulting in a CCD×MWD of the core and the shell. The results of the CCD are shown later in the results and discussion.
Results and Discussion
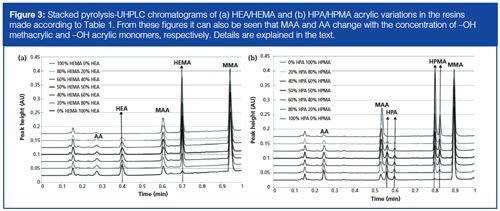
Pyrolysis of the standard –OH functional acrylics was performed using the method of Wang, Gerhart, and Smith (10). The pyrolysate was introduced into the UHPLC system and analyzed by gradient elution chromatography. The obtained chromatograms were stacked and are presented in Figure 3. The figure shows the separation of the HPMA, PHA, HEMA, and HEA functional acrylics. MMA is used as the internal standard for scaling the chromatograms because of an equal response in UV detection. The MMA content in all polymers was equal and therefore excellent to use for validation of the pyâUHPLC analysis. Figure 3 also shows an intensity change for the methacrylic acid (MAA) and acrylic acid (AA). This change in intensity was due to the presence of the hydroxyl monomer change over the percentage. It was observed that the increase of MAA was due to the increase of HMPA or HEMA. Increase of the latter was caused by fragmentation of hydroxyl methacrylic monomer, which has the tendency to further fragment into methacrylic acid. Furthermore, when HEA or HPA was the –OH functional monomer, more AA was formed after pyrolysis. This phenomenon was also observed by Senthil (13) for other acrylic polymers. Nevertheless, this phenomenon was not observed by py-GC–MS because of the low abundance of acid functional acrylics such as MAA and AA. To overcome the latter problem a derivatization method for acid functional acrylics was developed by Sharp (14). The –COOH acrylics were derivatized by N,N-dimethylformamide-dipropylacetaal, which is an elegant method to visualize the presence of acid functional acrylics in resins. However, this method is not applicable to the formation of acid functional acrylics after pyrolysis. As a result, GC is not the most suited analysis method to determine the amount of acrylic monomer after pyrolysis in resins because of its lack of scope.
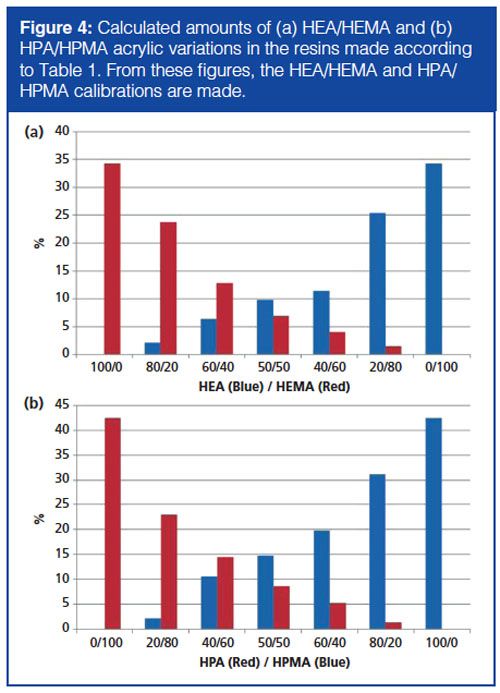
Quantification of the amount of HPA/HPMA and HEA/HEMA was performed and the results are shown in Figure 4. From this quantified amount a calibration was made for the presence and response of all four hydroxyl acrylics. From these regression lines the sensitivity and detection limits for these acrylics were calculated. The limit of concentration (LOC), detection (LOD), and determination (LOQ) for all hydroxyl-containing acrylics were determined according to the following formulas: LOC = 3σy/B, LOD = 6σy/B, LOQ = 10σy/B, where σy is the precision of the measurement and B is the slope of the calibration curve of the pyrolyzed monomers. The results are shown in Table 2. From these limits it can be concluded that the py-UHPLC method was able to quantify and determine concentrations of monomers down to 20 ppm. Nevertheless, for accurate quantification, a reference polymer with the same monomeric composition in about the same detection range needs to be analyzed. The latter is mandatory because the recovery of the pyrolysis is dependent on the neighbouring monomer in the polymer chain. Experience has taught us that a polymer [-A-B-A-B-]n shows other recoveries compared to [-A-C-A-C-]n or [-C-B-C-B-]n, where A, B, and C are three different monomers.

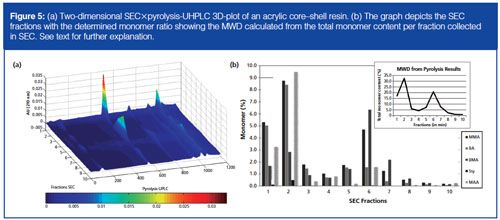
Py-UHPLC analysis offers us the option to perform twoâdimensional SEC coupled to py-UHPLC. This method can help us to determine the chemical composition distribution (CCD) of the acrylic polymer over the molecular weight distribution (MWD) determined by SEC.
In our laboratory we manually collected fractions of an unknown waterborne acrylic polymer after preparative SEC. A 50-µL aliquot of these fractions was put into a pyrolysis cup and was analyzed after drying by py-UHPLC to determine the CCD of the core and the shell of a waterborne acrylic resin. In Figure 5(a) the two-dimensional SEC×py-UHPLC 3D-plot of this acrylic core–shell resin is shown. The determined monomer concentration of the SEC-determined MWD shows the presence of two peaks: the first peak with the highest molecular weight (seen in the insert in Figure 5[b] and Figure 2) is the core–shell where the core is grafted to the shell and the second peak in the SEC chromatogram with the lower molecular weight is the “empty” shell with an empty core. From these SEC×py-UHPLC results we can see that both the core and the shell consist of MMA, BA, BMA, Sty, and MAA. However, the concentration of MAA in the “empty shell” is significantly lower than that present in the grafted “core–shell” part of the chromatogram. It can also be seen that the concentration of MMA and BA is significantly higher in the core than in the “empty” shell, which means that the core consists of MMA, BA, and MAA. These results could not have been obtained by SEC×py-GC analysis because of a lack of abundancy of MAA. From these results more insight into the polymerization process of the core–shell acrylic resin is obtained. This can help us to understand how such systems behave during polymerization.
Conclusion
Py-GC is a sophisticated, widely applied, and wellâdeveloped analysis method that is often used in the characterization of acrylics. However, pyrolysis coupled to GC or GC–MS is not a comprehensive method for polar acrylic monomer determination in waterborne- and solventâborne polymers. Furthermore, analysis time of py-GC is much longer compared to the alternative pyâUHPLC method described in this research. Polar acrylic monomers like MAA, AA, HPMA, PHA, HEMA, and HEA were determined by py-UHPLC by the use of an in-house developed cryogenic injector for on-line py-LC. The results of MAA and AA have been reported by Van Der Horst and co-workers (11) before. They showed proofâofâprinciple of using cryogenic focusing in on-line py-LC. Breakthrough experiments showed that less than 2% of the acrylic monomers were not trapped by cryogenic focusing, yielding excellent recoveries for the determination of
–COOH and –OH functionalized acrylics. In this research we determined the detection limits of acrylic monomers down to 20 ppm using py-UHPLC analysis. In addition, the coupling of SEC to py-UHPLC was performed and yielded a CCD×MWD of an acrylic waterborne core–shell resin. The next step in the analysis of the monomeric content of waterborne acrylics by on-line py-UHPLC is the use of a “sophisticated” trapping device like that shown by Jan Beens in comprehensive twoâdimensional GC×GC (15) mounted on our UHPLC system for comprehensive acrylic polymer analysis.
Acknowledgement
We would like to acknowledge Fred van Wijk, Dirk Mestach, Rob Adolphs, and Ferry Thijs for their helpful discussions, and Ria de Cooman and William Weaver for funding this research at Nuplex Resins. We would also like to thank Erik van der Hage from Akzo Nobel Car Refinishes Sassenheim for showing us his py-LC–MS device used in his thesis on py-MS. Furthermore, we would like to thank Heert Andringa, Robert van Egmond, Peter van den Berg, and Stephan Ploegaert from Nuplex Resins Bergen op Zoom for synthesizing the acrylic polymers by bulk polymerization on the high-throughput robot.
References
- S. Tsuge, J. Anal. Appl. Pyrolysis32, 1 (1995).
- C.G. Williams, J. Chem. Soc.15, 110 (1862).
- P.D. Zemany, Anal. Chem.24, 1709 (1952).
- R.L. Levy, Thesis, Institute of Technolology, Haifa, Israel (1963).
- W. Simon and H. Giacabbo, Chem. Ing. Techn.37, 709 (1965).
- H. Giacabbo and W. Simon, Pharm. Acta. Helv. 39, 162 (1964).
- J. Sharp, Analyst103, 517 (1980).
- R. van Egmond, B.Sc. Thesis, Hogeschool Breda, The Netherlands (1987).
- S.P. Kossen, LCGC Europe11, 679 (2001).
- F.C-Y. Wang, G. Gerhart, and C.G. Smith, Anal. Chem. 67, 3681 (1995).
- A. van der Horst, J. Slaakweg, K. Huiskes, Y. van Hooijdonk, and A. Kroes, J. Chem. Chem. Eng. 8, 668 (2014).
- E.R. Kaal, G. Alkema, M. Kurano, M. Geissler, and H. Jannsen, J. Chrom. A1143, 182 (2007).
- V.P. Senthil, J. Anal. Appl. Pyrolysis21, 163 (1991).
- J. Sharp, Analyst103, 517 (1980).
- J. Beens, U.S. patent 6838288
Aschwin van der Horst is a principal chemist analytics and department head of the analysis, materials, and instrumentation department at Nuplex in Bergen op Zoom (The Netherlands). He is a specialist in resin determination and has published several papers on the determination of polymers by means of (two-dimensional) liquid chromatography.
Yannic van Hooijdonk is a student of Avans Hogeschool in Breda (The Netherlands). He has performed the twoâdimensional SEC×py-UHPLC analysis of the waterborne resin for his bachelor thesis.
Afke Kroes is a chemist working at Nuplex in Bergen op Zoom. She has performed most of the –OH functional acrylic resin analysis for her thesis on py-UHPLC analysis at the Hogeschool van Utrecht (The Netherlands) to get her bachelor degree.

New TRC Facility Accelerates Innovation and Delivery
April 25th 2025We’ve expanded our capabilities with a state-of-the-art, 200,000 sq ft TRC facility in Toronto, completed in 2024 and staffed by over 100 PhD- and MSc-level scientists. This investment enables the development of more innovative compounds, a broader catalogue and custom offering, and streamlined operations for faster delivery. • Our extensive range of over 100,000 high-quality research chemicals—including APIs, metabolites, and impurities in both native and stable isotope-labelled forms—provides essential tools for uncovering molecular disease mechanisms and exploring new opportunities for therapeutic intervention.
New Guide: Characterising Impurity Standards – What Defines “Good Enough?”
April 25th 2025Impurity reference standards (IRSs) are essential for accurately identifying and quantifying impurities in pharmaceutical development and manufacturing. Yet, with limited regulatory guidance on how much characterisation is truly required for different applications, selecting the right standard can be challenging. To help, LGC has developed a new interactive multimedia guide, packed with expert insights to support your decision-making and give you greater confidence when choosing the right IRS for your specific needs.

.png&w=3840&q=75)

.png&w=3840&q=75)


.png&w=3840&q=75)


.png&w=3840&q=75)


