Precision of Internal Standard and External Standard Methods in High Performance Liquid Chromatography
Special Issues
Internal standard methods are used to improve the precision and accuracy of results where volume errors are difficult to predict and control. A systematic approach has been used to compare internal and external standard methods in high performance liquid chromatography (HPLC). The precision was determined at several different injection volumes for HPLC and ultrahigh‑pressure liquid chromatography (UHPLC), with two analyte and internal standard combinations. Precision using three methods of adding the internal standard to the analyte before final dilution was examined. The internal standard method outperformed external standard methods in all instances.
Internal standard methods are used to improve the precision and accuracy of results where volume errors are difficult to predict and control. A systematic approach has been used to compare internal and external standard methods in high performance liquid chromatography (HPLC). The precision was determined at several different injection volumes for HPLC and ultrahighâpressure liquid chromatography (UHPLC), with two analyte and internal standard combinations. Precision using three methods of adding the internal standard to the analyte before final dilution was examined. The internal standard method outperformed external standard methods in all instances.
A systematic approach was used to compare internal standard (IS) and external standard (ESTD) methods used in high performance liquid chromatography (HPLC). The experiments described were specifically designed to examine the precision of the IS method as compared to the ESTD method using the last two generations of HPLC and ultrahigh-pressure liquid chromatography (UHPLC) systems. Two methods of introducing the IS were compared; these methods involved either weighing the amount of IS added as a solid or an internal standard solution of known concentration. Along with two types of instruments, HPLC and UHPLC, we used three analytes at different concentrations and injection volumes. A review of the literature revealed a limited number of papers that discussed the use of the internal standard in HPLC. None of the references used the approaches described herein to evaluate the effect of using an internal standard compared to the external standard approach.
In an external standard calibration method, the absolute analyte response is plotted against the analyte concentration to create the calibration curve. An external standard method will not provide acceptable results when considerable volume errors are expected because of sample preparation or injection-to-injection variation. An IS method, which is a method where a carefully chosen compound different from the analyte of interest is added uniformly to every standard and sample, gives improved precision results in quantitative chromatographic experiments. The internal standard calibration curves plot the ratio of the analyte response to the internal standard response (response factor) against the ratio of the analyte amount to the internal standard amount. The resultant calibration curve is applied to the ratio of the response of the analyte to the response of the internal standard in the samples and the amount of analyte present is determined.
Several approaches have been used to determine the amount of internal standard that should be used in preparing the standards and the samples, but none have illustrated definitive results (1–4). For example, Haefelfinger (1) reports that the IS peak height or area must be similar to that of the analyte of interest, but does not present supporting data. Araujo and colleagues (2) show that experimental design strategies can be used to determine the optimal amount of internal standard used while Altria and Fabre (3) show that the IS should be used in the highest possible concentration.
Calculation of the response factor assumes that the detector gives a linear response for both the analyte and the internal standard over the entire range of the experiment. Since this is not always the case, it is essential to understand the behaviour of the response factor as the concentration or amount of analyte and internal standard are varied. Knowing the behaviour of the response factor allows one to set limits on the useful range of the chosen analyte or internal standard concentration combinations.
The internal standard method is used to improve the precision and accuracy of results where volume errors are difficult to predict and control. Examples of types of errors that are minimized by the use of an internal standard are those caused by evaporation of solvents, injection errors, and complex sample preparation involving transfers, extractions, and dilutions. An internal standard must be chosen properly and a known amount added carefully to both sample and standard solutions to minimize error and be utilized to its full advantage. The resulting internal standard peak should be well resolved from other components in the sample and properly integrated. If all of these conditions are not met, the use of an internal standard may actually increase the variability of the results. One report suggests that whenever detector noise or integration errors are the dominant sources of error, the use of an internal standard will likely make the results of the experiment worse (5).
A paper published by P. Haefelfinger in the Journal of Chromatography in 1981 (1) discussed some limitations of the internal standard technique in HPLC. Using the law of propagation of errors, the paper showed conditions that need to be met for the internal standard procedure to improve results. In addition to the mathematical illustration, Haefelfinger detailed practical examples where either internal or external standard methods were advantageous.
The Journal of the Pharmaceutical Society of Japan published a study in 2003 (6) that found that the internal standard method did not offer an improvement in precision with the then current autosampler technology. Interestingly, they also found that if the peak of the internal standard was small, the relative standard deviation (RSD) was actually larger than the RSD for the external standard method (6). The limitation of this study was that only one injection volume (10 µL) was used to establish the conclusions.
In our work, a systematic approach has been used to compare the internal to the external standard method using two analytes and two internal standards. The precision resulting from both an internal and external standard method were determined at several injection volumes and on two different instruments. Three methods of adding the IS to the analyte before final dilution have been compared.
In the first, a solid internal standard was weighed directly into the glassware containing the sample before dilution with solvent. In the second, a solution of a known concentration of the IS was prepared and a known volume of this solution was added to the sample prior to dilution. In the third, the IS was added in the same manner as the second method, but the internal standard solution was weighed and the weight, not the volume, was used in the IS calculations. We examined the effect of weight of analyte and internal standard on the precision of the results. Initially, the weights of the analyte were varied versus a constant IS concentration, and then the concentration of the internal standard was varied versus a constant weight of the analyte.
Standard deviation was chosen to monitor precision. All possible errors are reflected in the standard deviations of the final measurements, including each step in the sample preparation, sample transfer, and sample introduction into the HPLC or UHPLC system, as well as the HPLC or UHPLC analyses themselves. Both external and internal standard calibration methods were used to calculate the percent recoveries for comparison.
ExperimentalChemicals: The mobile phases were binary mixtures of acetonitrile and water (pH adjusted with phosphoric acid). The water was purified house water (EMD Millipore Corp.) and the acetonitrile and phosphoric acid (EM Science) were HPLC grade. Diuron and indoxacarb standards were obtained from DuPont Crop Protection. The internal standards were p-terphenyl (Aldrich Chemicals) and 3-methylâ1,1âdiphenylurea (Aldrich Chemicals). All solutions were prepared as needed or stored in the refrigerator.
Sample Preparation: For the comparison of calibration methods, the official DuPont technical assay methods for indoxacarb and diuron were adapted for use. All standards and samples were prepared in acetonitrile. The indoxacarb standards ranged in concentration from 0.15 to 0.7 mg/mL; samples were prepared at a concentration of 0.5 mg/mL. The internal standard was p-terphenyl at a concentration of 0.08 mg/mL. The diuron standards ranged in concentration from 0.75 to 1.25 mg/mL; samples were prepared at a concentration of 1 mg/mL. The internal standard was 3-methylâ1,1âdiphenylurea at a concentration of 1 mg/mL. Precision data was calculated based on eight individually prepared samples with duplicate injections of each sample.
For the comparison of the method of addition of the internal standard experiments, three DuPont enforcement methods for technical assay of indoxacarb, famoxadone, and diuron were used. Precision data was calculated based on eight individually prepared samples with duplicate injections of each sample.
Instrumentation and Chromatographic Conditions: Agilent 1100 and 1290 Infinity HPLC systems (Agilent Technologies) were used, each consisting of a binary pump, an autosampler, a thermostated column compartment, and a diodeâarray detector. Instrument control and data collection were performed using ChemStation software. Chromatographic conditions are given in Tables 1, 2, and 3. The technical methods were adapted as needed; for example, a method specifies the injection volume, and we collected data using several injection volumes for each compound.
Calibration Methods: Internal Standard Versus External Standard Calibrations: A set of samples was prepared in such a way that results could be calculated for both the internal and external standard methods. All samples were prepared using class A volumetric glassware. Initially, the analyte was weighed directly into the volumetric flask. Next, the internal standard was weighed into the same flask and acetonitrile was added to dissolve the solids. The flask was then diluted to the mark and the mass of the final solution was recorded. This step allowed the results to be calculated using the external standard method in two ways, by using the nominal volume of the volumetric flask and also by using the mass of the solution to calculate the concentrations. In both of these cases, the internal standard added was not included in the calculations. These two methods will be denoted as “ESTD nominal volume” and “ESTD weight”, respectively. The internal standard method, where the weighed volume of the internal standard solution was recorded, will be denoted as “IS solution”. Because the samples were prepared in this manner, the results for the three methods were calculated using the same data files. The difference in the calculated standard deviations in this way is attributed to the calibration method, and is independent of any differences in sample preparation.
Comparison of Methods of Addition of the Internal Standard: Two sets of samples were prepared for each compound analyzed. The first set of samples were prepared by weighing the solid analyte and then weighing the solid IS into the sample container and diluting. The second set of samples were prepared by weighing the solid analyte into the sample container and then adding a specified volume of internal standard solution, which was subsequently also weighed. Standard deviations were calculated for these two internal standard introduction methods.
Results and Discussion
To determine if instruments were functioning properly, eight replicate injections of one prepared sample for each analyte and internal standard were injected into each instrument at different injection volumes. The chromatographic conditions are shown in Tables 1 and 2. The injector linearity was tested for both analytes and both internal standards and the results are given in Table 4. The range tested for the standard HPLC and the UHPLC instruments were 0.2–10.0 µL and 0.2–5.0 µL, respectively. The injection precision at each flow rate was compared to the manufacturer specifications, the instruments performed at or better than the manufacturer’s specifications.
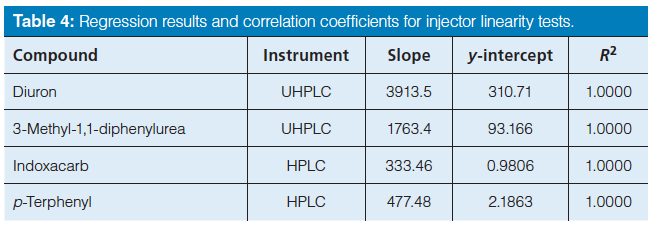
Table 4: Regression results and correlation coefficients for injector linearity tests.
There are other important factors to consider when optimizing chromatographic methods, some of which are carryover, column back pressure, and wavelength (7). Our experiments controlled these parameters.
Comparison of Calibration Methods: In general, there was not a large difference in the calculated standard deviations for the two external standard methods. Any differences seen did not suggest a trend, and appear to be random. An expected trend when using both external standard methods was that standard deviations became larger with decreased injection volume.
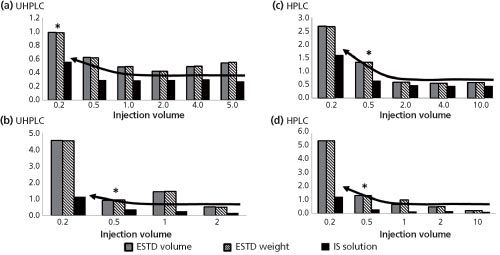
Figure 1: Comparison of external and internal calibration methods: (a) indoxacarb with UHPLC, (b) diuron with UHPLC, (c) indoxacarb with HPLC, (d) diuron with HPLC. Each bar represents eight injections.
The results calculated using the internal standard calibration method always demonstrated improved precision over the results calculated using an external standard calibration. See Figure 1 for precision results for diuron and indoxacarb using HPLC and UHPLC instruments. The graphs in Figure 1 show that at larger injection volumes the precision for the IS method appears constant, but at lower injection volumes the standard deviation increases drastically. This phenomenon does not occur at the same injection volume for both compounds, nor does it occur at the same injection volume for either compound using HPLC or UHPLC.
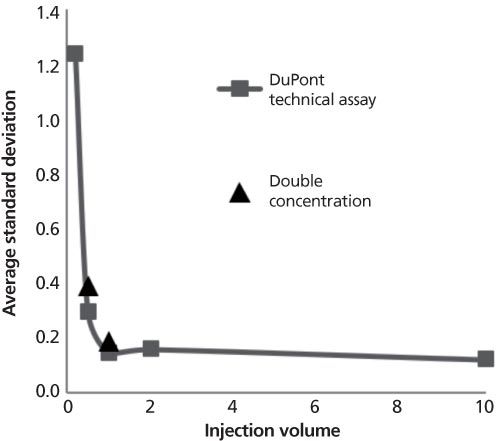
Figure 2: Comparison of results obtained for the DuPont technical assay method when injections at two different volumes were made.
Logically, overall peak areas are smaller with smaller injection volumes and loss of precision is caused by integration errors. Larger integration errors occur with smaller areas being integrated and lead to larger standard deviations calculated for the percent error. To determine if this effect of volume injected was the cause for the increase in RSD for low peak areas, samples of diuron were prepared at twice the concentration level of the original experiment and two different volumes were injected. If the loss of precision was solely because of the smaller size of the peak, then the standard deviation calculated using the higher concentration samples should be smaller than the standard deviation calculated for the original samples. This was not the case; Figure 2 shows that the standard deviations calculated when peaks were two times as large as the original were not significantly different from the original standard deviation. Again, the loss of precision was not explained by the smaller absolute size of the peak.
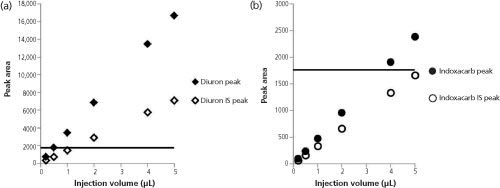
Figure 3: Graphs of peak area versus injection volume for (a) diuron and (b) indoxacarb. The solid line corresponds to the peak area for the IS in the diuron method.
Figure 3 shows the peak areas corresponding to different injection volumes for diuron and indoxacarb standards and their corresponding internal standards. With diuron, the internal standard method did not produce acceptable results at injection volumes lower than 1 µL; the internal standard peak area was smaller than the analyte peak area at all injection volumes. The horizontal lines drawn in Figure 3 correspond to the peak area of the internal standard, 3-methyl-1,1âdiphenylurea, in the diuron solutions. If the peak size was completely responsible for loss of precision at small injection volumes, then any results calculated using peak areas below this line at any injection volume should show similar loss of precision. Correspondingly, for indoxacarb, a similar loss of precision would have been seen at all the chosen injection volumes. Indoxacarb was not consistent with this hypothesis. The loss of precision is not completely explained by the absolute size of the peak.
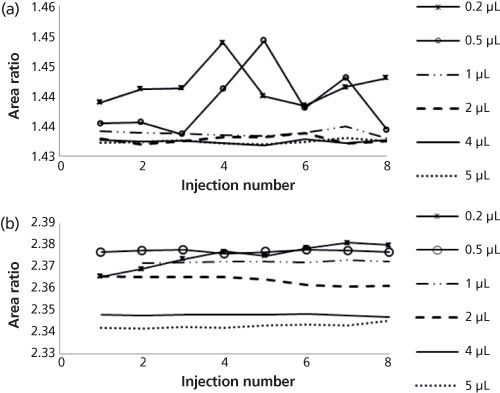
Figure 4: Comparison of peak area ratios at different injection volumes for (a) indoxacarb and (b) diuron.
Peak Area Ratios: To further investigate this precision loss when smaller injection volumes (0.2, 0.5, and 1 µL) were used, two separate samples of diuron and indoxacarb, each with IS, were injected eight times using the conditions described in Tables 1 and 2. The resulting peak area ratios (analyte peak area/internal standard peak area) were plotted against the injection number as shown in Figure 4. At these smaller injection volumes, the responses are less precise than at the larger injection volumes. The exact injection volume where this is seen varies from compound to compound, but generally occurred at injection volumes smaller than 2 µL. Figures 1 and 2 show that on average, the peak area ratio is changing as the injection volume changes and is greater at smaller injection volumes. Thus, confirming a calibration curve prepared using one injection volume should not be used with data resulting from a different injection volume. The difference in area ratio over the range of injection volumes appears small, but is significant. For the diuron analysis using UHPLC, the percent recoveries calculated using the highest and lowest calculated peak area ratios shown in Figure 4 (0.2 µL and 5.0 µL, respectively), resulted in a difference of 0.86% overall recovery. For the diuron analysis using HPLC data, percent recoveries determined using the highest and lowest calculated peak area ratios (0.2 µL and 10.0 µL, respectively) resulted in an overall recovery difference of 4.28%. Small differences in the area ratios at different injection volumes can have a large impact on the calculated recoveries.
Figure 4 shows that the peak area ratios used for the IS method do not remain constant over the range of injection volumes examined. Some peak area ratios varied by as much as 0.05 units. This change as the injection volume is changed can cause a systematic error in the calculated recoveries that results from the use of an IS calibration curve. As previously discussed, the error in percent recovery because of the changing value of the peak area ratios over the range of injection volumes used was as small as 0.86% for the UHPLC analysis and as large as 4.28% for the HPLC analysis. This topic warrants further investigation.
Comparison of the Methods of Internal Standard Addition: Three methods of internal standard addition were compared. In the first method, the internal standard was added directly as a solid. In the second method, a solution of the internal standard was prepared, added, and weighed into the analyte solution before final dilution. Calculations were then performed using the weight of the added solution. For the third method, the internal standard preparation and introduction were the same as the second method; however, the calculations were performed using the nominal volume from the Class A volumetric pipette. Table 5 gives the injection volumes used in the chromatographic methods, the masses of the analyte and IS used, the volume of the IS used, the average peak areas for both the analyte and the IS, and the resulting response factors. Table 6 shows the standard deviations that were calculated when the IS was added by these three different methods. An F-test showed a significant difference in the resulting standard deviations between the first method (weighing the IS as a solid) and the other two methods (introducing a solution of the IS). There were small differences in the standard deviations using the two separate methods of introducing the internal standard as a solution and calculating via either the volume or weight; however, no specific trend was obvious.
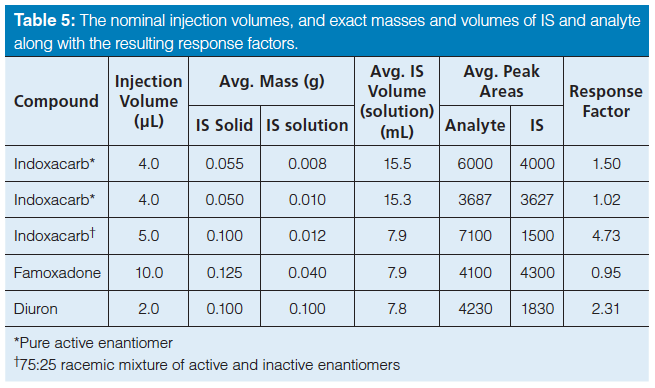
Table 5: The nominal injection volumes, and exact masses and volumes of IS and analyte along with the resulting response factors.
When the IS was weighed as a solid, the precision was almost a factor of three and 13 times larger, for diuron and famoxadone, respectively, than when the IS was added as a weighed solution (see Table 6). These results suggest the precision could potentially be limited by the accuracy of the balance. Supporting this, whenever the weight of either the analyte or IS was less than 100 mg, the standard deviation was large, generally 1.4%; conversely, when the weight was 100 mg or higher, the standard deviation was less than 0.5%. Nearly a threefold improvement in standard deviation was obtained by increasing the weights being used to at least 100 mg, or adding another significant digit to the mass measurement. Overall, the standard deviation was significantly smaller when the internal standard was added as a solution rather than as a solid, attributed to the larger mass of solution versus solid being weighed. To confirm this, the measured weights of the analyte and the IS were varied separately using the diuron enforcement method. This method was chosen because it exhibited the lowest inherent standard deviation. Table 7 shows the results where the mass of the analyte was varied from 25 mg to 175 mg while the IS amount was held constant. Both methods of internal standard introduction were used; the constant amount of solid and internal standard solution weighed into the analyte solution was 100 mg, and 7.8 g, respectively. Table 7 shows the standard deviations for the varied amount of analyte, from 75 to 175 mg. These calculated standard deviations are all 0.25% or less for both IS introduction methods. Decreasing the analyte mass to 25 mg, the standard deviation quadruples to 0.69% for solid introduction and 0.37% for the weighed solution of internal standard. The standard deviations for the samples prepared by adding the IS as a solution are always lower than for those prepared by adding the IS as a solid. Conversely, when the mass of analyte was kept constant at 100 mg and the mass of the IS was varied, similar results were obtained. Specifically, the calculated standard deviations were less than 0.3% except when the IS mass was 25 mg for the weighed solid internal standard. For 25 mg of weighed solid internal standard, the precision was 0.8%. These results are given in Table 8. Therefore, it can be concluded that excellent precision in chromatographic results is affected by the precision of the balance, the weight of the internal standard, and the introduction method of the internal standard.
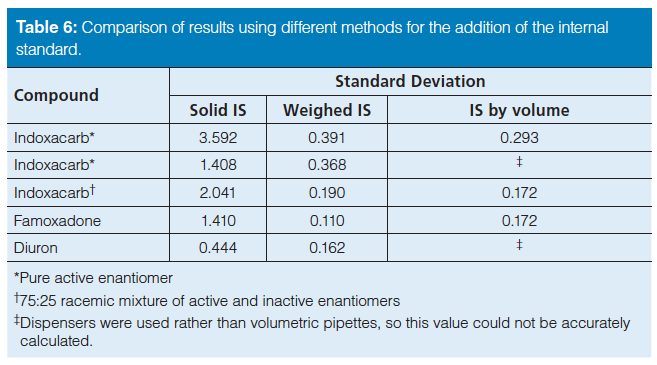
Table 6: Comparison of results using different methods for the addition of the internal standard.
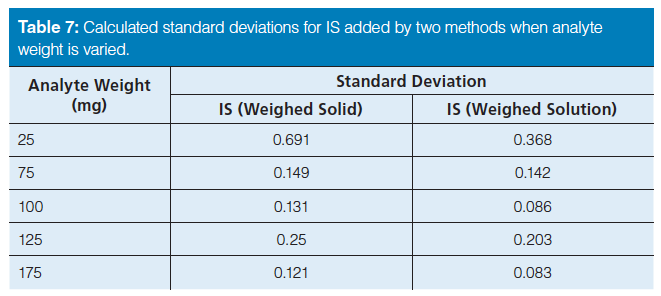
Table 7: Calculated standard deviations for IS added by two methods when analyte weight is varied.
Further analysis of the data disputes some of the ideas regarding the internal standard that were previously reported. Haefelfinger (1) reported that the IS peak area must be similar (response factor close to 1) to that of the analyte of interest. The data and results given in Tables 5 and 6 do not support this and do not suggest any specific correlation between the response factor and the standard deviation. Altria and Fabre (3) state that the IS should be used in the highest possible concentration. The results in Table 8 elucidate the standard deviation for some of the samples with lower concentrations of IS showing better precision than some with higher concentrations of IS. Our results illustrate that injection volumes and the method of addition of the internal standard are more important than having a response factor close to one or using high concentrations of IS.
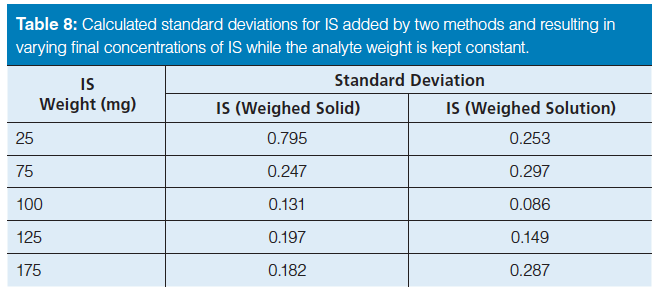
Table 8: Calculated standard deviations for IS added by two methods and resulting in varying final concentrations of IS while the analyte weight is kept constant.
Conclusions
When precision is an important factor, the chromatographic instrument should be tested before the start of any analysis to ensure that it is working properly. Injection-to-injection variation and the injector linearity both have a pronounced effect on precision at smaller injection volumes, so it is important to confirm that the instrument being used is capable of providing acceptable results at the chosen injection volume. The internal standard method corrects for different sources of volume errors, including injectionâtoâinjection variation, volume errors in sample preparation, and accounts for routine variations in the response of the chromatographic system.
We have shown the internal standard method outperformed external standard methods in all experiments, regardless of the analyte, choice of internal standard, method of introduction of internal standard, and the injection volume. Even so, at low injection volumes the resulting precision, when using the internal standard method, was poor. For the compounds used, this breakdown typically occurred at injection volumes of less than 2 µL and was dependent on the specific compound and IS being used, and not the instrument. Loss of precision did not coincide with a specific minimum peak area, so poor precision cannot be attributed to the smaller size of the peaks at smaller injection volumes. The breakdown in precision was also not because of larger injection variability at smaller injection volumes. If that was the case, the loss of precision would occur at the same injection volume on each instrument regardless of what compound was being studied.
The results of this study show that when poor precision occurs at injection volumes less than 2 µL, significant improvement in results may be achieved by simply increasing the injection volume without the need for developing a new method. This is true whether an external standard or an internal standard method is being used.
With an internal standard method, the precision of the experiment is affected by how the internal standard is measured. For solutions prepared to have the same final concentration of analyte and IS, there is a significant difference in the precision when the internal standard is added as a solid or a solution of known concentration. For all the analyte and IS combinations tested, the precision was significantly better when a solution of the IS was first prepared at a known concentration then added to the analyte before dilution.
Our chromatographic resultant precision was not limited by the precision of the balance when the masses being used were larger than 25 mg. There was no direct correlation between the response factors and the calculated standard deviations. Our data also did not support the common perception of an IS being used in the highest concentration possible.
Overall, the results show that the internal standard method can significantly improve the precision of a chromatographic method. However, attention must be paid to the injection volume and the method by which the internal standard is added to the analyte. To achieve better precision, increasing the injection volume of the sample solution is effective.
Acknowledgements
The authors would like to acknowledge Steve Platz for many contributions, including being a safety mentor and training on using the HPLC instrument. We would also like to thank Jim Schmittle, Peter Schtur, and Jennifer Llewelyn for their support of this project.
References
- P. Haefelfinger, J. Chromatogr. 218, 73–81 (1981).
- P. Araujo, F. Couillard, E. Leirnes, K. Ask, A. Bøkevoll, and L. Frøyland, J. Chromatogr. A1121, 99–105 (2006).
- K.D. Altria and H. Fabre, Chromatographia40, 313–320 (1995).
- K. Baumann and H. Wätzig, Process Control Qual.10, 59–73 (1997).
- Y. Hayashi and R. Matsuda, Anal. Sci.11, 389–400 (1995).
- R. Ohtaka, M. Maeda, T. Iwagami, T. Ueda, Y. Kimura, K. Imai, C. Yomota, R. Matsuda, and Y. Hayashi, J. Pharm. Soc. Jpn.123(5), 349–355 (2003).
- K.M. Usher, S.W. Hansen, and M.P. McNalley, LCGC Europe 26(S10), 9–13 (2013).
Steven W. Hansen, Jennifer S. Amoo, and Mary Ellen P. McNally are with DuPont Crop Protection at the Stine Haskell Research Center in Newark, Delaware, USA. Karyn M. Usher is an associate professor at Metropolitan State University, Minnesota, USA. She contributed to this work as a visiting scientist at DuPont Crop Protection. Allison P. Bernstein is with DuPont Industrial Biosciences in Cedar Rapids, Iowa, USA. Direct correspondence to: Mary-Ellen.McNally@dupont.com

Determining the Effects of ‘Quantitative Marinating’ on Crayfish Meat with HS-GC-IMS
April 30th 2025A novel method called quantitative marinating (QM) was developed to reduce industrial waste during the processing of crayfish meat, with the taste, flavor, and aroma of crayfish meat processed by various techniques investigated. Headspace-gas chromatography-ion mobility spectrometry (HS-GC-IMS) was used to determine volatile compounds of meat examined.
University of Tasmania Researchers Explore Haloacetic Acid Determiniation in Water with capLC–MS
April 29th 2025Haloacetic acid detection has become important when analyzing drinking and swimming pool water. University of Tasmania researchers have begun applying capillary liquid chromatography as a means of detecting these substances.
Using GC-MS to Measure Improvement Efforts to TNT-Contaminated Soil
April 29th 2025Researchers developing a plant microbial consortium that can repair in-situ high concentration TNT (1434 mg/kg) contaminated soil, as well as overcome the limitations of previous studies that only focused on simulated pollution, used untargeted metabolone gas chromatography-mass spectrometry (GC-MS) to measure their success.

.png&w=3840&q=75)

.png&w=3840&q=75)


.png&w=3840&q=75)


.png&w=3840&q=75)


