Polar Vapor-Enhanced Separations with Planar Differential Mobility Spectrometry-Mass Spectrometry
Special Issues
A brief historical overview of DMS, followed by a synopsis of the instrumentation, physics, and chemistry behind the separation principles
This article provides a brief historical overview of differential mobility spectrometry (DMS) and its coupling to mass spectrometry (MS). This overview is followed by a qualitative description of the instrumentation, physics, and chemistry behind the separation principles with particular reference to the use of polar molecules to enhance gas-phase separations. Practical analytical examples are also shown, demonstrating that this technique, when used as the entrance to a mass spectrometer, can improve the analytical power of MS measurements because the principles of DMS operation are orthogonal to MS.
High-field asymmetric waveform ion mobility spectrometry (FAIMS) and differential ion mobility spectrometry (DMS) are both a form of radio frequency, field-driven ion mobility that share the same physical separation principle, fundamentally based on the difference in the high- and low-field ion mobilities of a particular ionic chemical species. FAIMS and DMS are distinguished on the basis of their analyzer geometries, which impart important different analytical properties. One of the unique characteristics of curved cell geometry FAIMS is the ability to focus ions at atmospheric pressure (1). One of the unique characteristics of the planar DMS geometry is that it provides optimal conditions to enhance separations by using polar chemical vapors as clustering agents (2), and several examples of its utility have been demonstrated (3–6). Analyte ions interact with the chemical vapors in ways that reflect their specific gas-phase clustering chemistry. Although the mechanisms are different, chemically enhanced mobility separations of this type are reminiscent of liquid-phase high performance liquid chromatography (HPLC) separations. One practical difference is that with the gas-phase technique, separations occur in the millisecond time frame whereas with the liquid-phase techniques separations are measured in a time frame of seconds to tens of seconds.
In this article we provide a brief historical overview of DMS, followed by a synopsis of the instrumentation, physics, and chemistry behind the separation principles. Practical analytical examples are shown that demonstrate why this technique, when used as the entrance to a mass spectrometer, can be expected to improve mass spectral selectivity because of its strongly orthogonal nature to the mass spectrometer. In this respect, it bears some resemblance to HPLC coupled to mass spectrometry (MS). DMS prefiltering can reduce the chemical noise for MS, improve the limits of detection and quantification (LOD and LOQ) for various analytes, and increase sample throughput by reducing or eliminating the necessary LC run time.
History
With the advent of chemical warfare agents during the First World War, the development of handheld chemical sensors has been of great interest for the military, as well as industrial and security applications. One of the many technologies emerging from this century of research and development was a form of ion mobility that operates at atmospheric pressure and utilizes radio frequency (rf) fields to separate ions of chemical species. It was invented in the 1980s in the Soviet Union (7), with the vision for it to ultimately become a compact device to detect landmines on the battlefield. Over the years this form of ion mobility has assumed a variety of different names; the earliest ones were nondescriptive, such as "gas analyzer of ions," "field ion spectrometer," and "drift spectrometer."
By the late 1980s, the geometry of the separation cell began to diverge down two different pathways. A pair of flat planar electrodes defined one approach (8) and a pair of curved or coaxially cylindrical electrodes defined the other (9) (see Figure 1). These geometries each represent important, different analytical properties to the devices that are particularly relevant to the content of this paper.

Figure 1: Historical development and migration of DMS (planar cell geometry) and FAIMS (curved cell geometry) technology from the Soviet Union to the West. IAP = Applied Physics Institute (SU); DTI = Design-Technological Institute of Geophysical and Ecological Engineering (SU); TIE = Tashkent Institute of Electronics (SU); MSA = Mine Safety Appliance (USA); PNNL = Pacific North National Laboratory (USA); IA = Ionalytics (Canada); NMSU = New Mexico State University (USA); Sionex Corp. (USA); OWL = Owlstone (UK); Thermo Electron (USA); GAI = gas analyzer of ions; DS = drift spectrometer; DMS = differential mobility spectrometry; IMIS = ion mobility increment spectrometer; FIS = field ion spectrometer; and FAIMS = high field asymmetric waveform ion mobility spectrometry.
The technology transferred to the West in the mid-1990s and at that point the nomenclature became both more descriptive and associated with specific cell geometries. The cylindrical geometry moved from Russia to a company in Pittsburgh, Pennsylvania called Mine Safety Appliances (MSA) (10). The MSA device was adapted as a front end to a mass spectrometer at the National Research Council in Ottawa, Canada headed by Roger Guevremont. At this point the devise took on the descriptive title high-field asymmetric waveform ion mobility spectroscopy (1). FAIMS was commercialized by Ionalytics, later bought by Thermo Electron Corp., and continues to be associated with the curved electrode geometry of this type of ion mobility.
Differential mobility sensors with planar electrodes were developed at research sites in Uzbekistan and Siberia in the late 1980s and early 1990s (11). After the migration of Drs. Erkin Nazarov (Tashkent, Uzbekistan) and Evgeny Krylov (Siberia) to Gary Eiceman's laboratory at New Mexico State University (NMSU), the planar geometry evolved further and was referred to at that time in the western literature as differential mobility spectrometry (3). The first prototype of a micromachined DMS sensor was built in Charles Stark Draper Laboratory in Cambridge, Massachusetts, and was characterized at NMSU. Later on, the base of this technology, a handheld gas chromatography (GC)–DMS analyzer, was developed in a new spin-off company (Sionex Corp.). AB Sciex worked with the Sionex team to develop a planar DMS-MS system that was commercialized under the trade name Selexion (details in http://www.absciex.com/products/ion-mobility-spectrometry/ab-sciex-selexion-technology). The term DMS continues to be associated with the planar electrode geometry today.
Several academic laboratories, government institutions, and instrumentation companies further refined and commercialized both planar and cylindrical geometries during the last decade. For a recent overview of commercial mobility and MS instrumentation see reference 12.
Because the focus of this paper is on using transport gases modified with vaporized solvents, attention is drawn to DMS because the planar geometry provides the best conditions to take advantage of the chemical shift with polar transport gases.
Separation Principles
The DMS cell operates at atmospheric pressure. The transport gas that moves the ions through the cell is typically an inert nitrogen curtain gas that can be modified by adding vaporized volatile liquids.
As shown in Figure 2, the separation cell is sealed to the mass spectrometer inlet aperture and the electrospray ion source is near the entrance of the mobility cell. Approximate dimensions are indicated in the figure for the DMS system described throughout this paper. The vacuum pulls the transport gas, and the ions being carried with it, through the device into the mass spectrometer analyzer with high transfer efficiency. Flight times through the cell are approximately 5 ms. For a more in-depth description of this approach see reference 13.
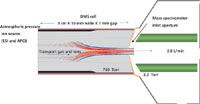
Figure 2: Schematic drawing of the planar DMS-MS system described in this article. Approximate dimensions are cited (not drawn to scale). The cell is sealed to the mass spectrometer inlet aperture, which allows the transport gas flow through the cell to be driven by the MS vacuum system. This also provides high ion transfer efficiency from the DMS cell into the mass spectrometer.
Figure 3 is a computer simulation of the trajectory of four different ions with different mobility characteristics in the presence of the applied rf and dc voltages. The high-field portion of the rf period displaces the ions from the central axis of the electrodes and the low-field portion drives them back in the other direction, creating a sawtooth ion trajectory. If the mobility of a particular ion differs between the high- and low-field portions of the rf waveform, it will drift toward and eventually strike one of the electrodes as seen with three of the four ions in Figure 3. A compensation dc voltage is used to steer an ion back on axis, as is shown occurring in Figure 3 with one of the four ions. This ion will traverse the cell and be detected by the mass spectrometer when this particular compensation voltage is applied. The compensation voltage can be swept sequentially, allowing all ions to pass at their respective compensation voltage in a way similar to the scanning of a quadrupole mass spectrometer. Alternatively, the dc voltage can be fixed allowing only the targeted species to pass. The rf is approximately 3 MHz. Given an ion flight time through the cell of approximately 5 ms, determined by the gas flow rate, this process results in 15,000 high-to-low field oscillations during transit through the entire length of the cell. During this time, the ions are colliding with the neutral background transport gas (nitrogen), as well as clustering and declustering with the background chemical vapors if they have been added to the transport gas.
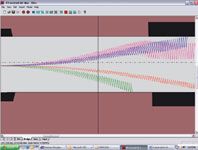
Figure 3: Computer simulation of the trajectories of four different ions through a planar DMS system with the rf separation voltage on and the dc compensation voltage set to a specific value (not scanning).
The addition of clustering agents to the transport gas enhances the separation power of DMS by amplifying the difference in the high- and low-field mobilities of a particular ion and it does this in a chemically specific way. As shown in Figure 4, ions cluster in the low field then decluster in the high field of each period of the waveform as a result of rf heating. This clustering and declustering occurs approximately 15,000 times during the flight through the cell. The separation amplification is a consequence of the phenomena of ions clustering with neutral molecules in accordance with their specific ion–molecule chemistry. The clustered ion is large, which dramatically reduces its mobility, and it has a unique shape established by the interaction of the molecular bonds of the ion with the polar transport gas. The declustered ion is small, which increases its mobility, and its shape is established by the naked ion. The improvements to the selectivity of the separation are fundamentally based on the unique gas-phase ion chemistries of individual ions. A rigorous derivation of the clustering model was developed in Gary Eiceman's laboratory (14,15).
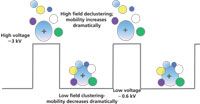
Figure 4: Conceptual drawing of the clustering and declustering that occurs between an ion and the polar background gas during the high and low field portions of each period of the rf cycle.
Clustering agents have been used in classical constant low-field ion mobility instruments for many years. However, the same separation power amplification is not achieved, because with the constant low field mobility analyzers there is no alternating between clustered and declustered states. Successful application of this approach to improved peak capacity has been limited to planar DMS devices (2). The reasons for this limited applicability are not entirely clear, but the primary difference between the two geometries is the electric field densities within the cells (16). Planar geometries produce homogeneous fields. The fields within cylindrical devices are inhomogeneous; this results in operational modes in which ion focusing can occur to improve transmission (1), but resolution is lost in the presence of polar transport gases. It is speculated that the inhomogeneity of the fields within a curved device reduces resolution in the presence of vapor modified transport gases because the clustering and declustering effect is highly dependent on the radial position of the ion within the separation cell. Because the fields are variable at different positions within a curved cell and the clustering and declustering process occurs at different positions relative to the electrodes throughout the length of the analyzer, a loss of resolution can be expected. Planar devices, comprising two flat plates, do not suffer from distorted field effects. Because the fields are homogeneous, the cluster–decluster process is not affected by position within the analyzer, resulting in good resolution.
Data and Examples
The descriptive term ionogram was coined by Roger Guevremont to describe the experiment in which a sample containing a chemical mixture is infused and the compensation voltage is scanned, and the mass spectrometer is used as the detector (17). All ionograms presented in this work were obtained with SelexIon Technology on the AB Sciex Triple Quad 5500. Figure 5 shows three ionograms of a three-compound mixture taken using different transport gas compositions. Figures 5a and 5b are ionograms generated with different compositions of inert gases, showing marginal improvements in selectivity. Figure 5c shows the effect of a transport gas containing 1.5% isopropanol and 98.5% nitrogen; dramatic improvement is evident in the separation as a result of the chemical manipulation of the transport gas, which is somewhat analogous to the mobile phase in HPLC.
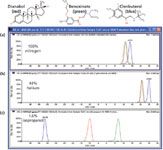
Figure 5: Three ionograms of the same three drug mixtures under different transport gas conditions. All ionograms in this paper were acquired by infusing the sample into an electrospray ion source and scanning the compensation voltage at a fixed rf separation voltage (separation field = 116 Td). All data in this paper were acquired using AB Sciex SelexION DMS device coupled to an AB Sciex QTrap 5500 mass spectrometer operating in the multiple reaction monitoring (MRM) mode. In this case, the sample flow rate was 10 µL/min and the compensation voltage was scanned from -50 to +40 V. (a) 100% nitrogen as the transport gas. No clustering reaction occurring. (b) 44% helium in the nitrogen transport gas. No clustering reactions occurring.(c) 1.5% vaporized isopropanol in the nitrogen transport gas. Cluster reactions occurring and the separation mechanism shifts to a chemically dominated model.
The term ionogram seems even more appropriate now than ever before because of its linguistic similarity to chromatogram. Because chemistry is being leveraged to improve separations, the results are reminiscent of HPLC. It is clear that the fundamental mechanisms are different in the gas and liquid phases, but the observation that the two leverage chemical interactions to produce separations and gain specificity is clear from this example. This is quite distinct from MS where differences in nuclear properties of molecules are the basis of separations.
Another example of this concept is illustrated in Figure 6, in which different polar modifiers are added to the transport gas to effect the separation of a seven-compound mixture. As would be expected, the separation resolution is affected differently with the different gases. Closer inspection shows that the relative location of the individual drug molecules within the ionogram is reversed. This can be seen to be the case with ephedrine and acyclovir in Figures 6a and 6b (isopropanol vs. acetone modifier). This is reminiscent of reversing the order of elution or relative retention times of compounds in HPLC by changing the mobile or stationary phases.
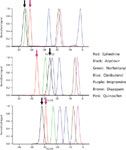
Figure 6: Ionograms of a seven compound mixture using different transport gas modifiers at 1.5% of the total nitrogen gas flow. In each case the nitrogen transport gas has 1.5% of the modifier. Compensation voltage scanned -60 to +10 V and sample infusion flow rate = 10 µL/min. The mixture was composed of ephedrine (red), acyclovir (black), norfentanyl (green), clenbuterol (blue), imipramine (purple), diazepam (brown), and quinoxifen (pink). (a) Isopropanol-modified transport gas. (b) Acetone-modified transport gas. (c) Acetonitrile-modified transport gas.
Although we are indicating a relationship between HPLC and chemically driven DMS, the two have distinctly different mechanisms and therefore should show some degree of orthogonality and demonstrate different types of selectivity. Figures 7a and 7b show two LC–MS-MS chromatograms of the same sample from a targeted quantitative assay for testosterone. In Figure 7a the DMS filter is turned off, and in Figure 7b the filter is turned on and set to the compensation voltage to pass testosterone. A polar modifier has been added to the transport gas to enhance separation. Under these particular assay conditions chemical interferants are apparent without the mobility separation activated (Figure 7a). Figure 7b shows an improvement in the signal-to-noise ratio resulting from the additional selectivity imparted by the chemically based mobility separation.
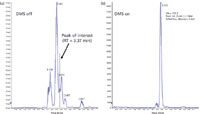
Figure 7: (a) LCâMS-MS chromatogram of a precipitated human female plasma sample monitoring an MRM transition for low level testosterone, m/z 289 â m/z 97. The DMS rf and dc voltages are off enabling transmission of all ions through the mobility cell without separation. A Shimadzu HPLC system was used, with a flow rate of 200 µL/min. (b) A repeat injection of the same sample as in (a) with the DMS filter on and set to the compensation voltage that transmits testosterone.
Because of the speed of separations, it is an attractive proposition to use DMS to substitute for HPLC in situations where this approach could offer practical advantages. One good example is the chemical profiling of tissue slices for the location of dosed drugs and metabolites using electrospray ionization (ESI) (18,19). Localized areas of the tissue are extracted and infused into a nanoESI ion source without HPLC separation with this technique. It is based on the surface sampling probe developed at Oak Ridge National Laboratories by Gary Van Berkel. Figure 8a is a magnified view of the liquid junction that is used to extract chemical species from surfaces. The spatial resolution is on the order of hundreds of micrometers. Figure 8b shows the device extracting a region of a whole mouse body tissue slice. The junction is maintained for a few seconds to maximize extraction efficiency and then is withdrawn into the pipette, transferred to the ion source, and ionized by electrospray into a DMS cell for mobility separation followed by MS detection.

Figure 8: (a) A magnified view of the liquid junction formed between a surface and the delivery pipette. The delivery pipette transports the sample postextraction to an Advion chip-based nanoelectrospray nozzle for electrospray ionization followed by DMS separation. (b) A view of a microscope slideâmounted whole body mouse section being surface sampled by a liquid extraction surface analysis (LESA) instrument commercialized by Advion.
Figures 9a and 9b show an example of using this surface-sampling system with DMS-MS to profile the tissues and organs of a whole body mouse cross section for the dosed drug propranolol and its glucuronide metabolites. The optical image in Figure 9a shows four of the regions interrogated. Figure 9b is the ionogram from region 2 (an 800-µm-wide section of the liver) showing the mobility-based separation of the parent drug and two isomeric and isobaric glucuronide metabolites. Using acetonitrile as the transport gas modifier in the DMS cell, the two metabolites having identical molecular weights are readily separated. The mass spectrometer cannot distinguish them based on the molecular weight of these species.
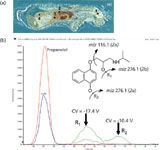
Figure 9: (a) The optical image of a whole body mouse cross section approximately 40 µm thick. Four regions were initially interrogated at a spatial resolution of 800â1000 µm. (b) The ionogram obtained while infusing sample from region 2 at 500 nL/min. The DMS compensation voltage was scanned from â30 to 0 volts and the triple quadrupole mass spectrometer was used to detect the drug and metabolites using multiple reaction monitoring of the molecular ions and two characteristic fragment ions. A concentration of 1.5% acetonitrile in nitrogen gas was used as the transport gas to effect separations. The structures of propranolol and its two glucuronide metabolites (R1 and R2) are shown.
Conclusions
The geometries and nomenclature for asymmetric rf mobility analyzers has evolved during the past 30 years. Planar DMS cells have been shown to provide optimal conditions for polar transport gas–enhanced separations and demonstrate a capacity to add a useful new dimension of selectivity for MS. In the present paper, we demonstrated that DMS devices can reduce the chemical background and improve the signal-to-noise ratio. In addition, the removal of interfering peaks from an analysis offers the possibility to improve analysis throughput by either shortening the total chromatographic analysis time, or, for some assays, eliminating it completely.
Every technique has some caveats and both FAIMS and DMS are no exception. There are thermodynamic limitations with gas-phase ion-cluster chemistry. When the proton affinity of the transport gas modifier is higher than the analyte, the charge will be transferred to the modifier and a loss of analyte ions will result.
At LC flow rates in the hundreds of microliters per minute range, as opposed to nano- or microflow rates, ions are created as highly heterogeneous clusters in electrospray ion sources with varying numbers of different solvent molecules attached to the analyte. Without a mobility cell in place this poses no problem because the clusters are removed in the entrance optics of the mass spectrometer vacuum system. However, with a mobility cell in place it will do what it is supposed to do and separate components of different size and shape. Consequently, the ion current from the analyte will spread out over compensation voltage space, depending on how heterogeneous the cluster ion populations are. Sensitivity will be reduced in a compound dependant way.
Finally, one practical difference between HPLC and DMS is that HPLC separates components of mixtures preionization and DMS separates post-ionization. The implications of this center on the issue of ionization suppression. HPLC offers a means to reduce or eliminate suppression. DMS does not. There are situations where ionization suppression is not an issue. When it is, a combination of some form of chromatography before DMS-MS is warranted. The added selectivity of DMS reduces the need for high-resolution HPLC. HPLC methods can be run faster and method development can be simpler.
Thomas R. Covey, Bradley B. Schneider, and J.C. Yves Le Blanc are with AB Sciex in Concord, Ontario, Canada.
Erkinjon G. Nazarov is with the Charles Stark Draper Laboratory in Cambridge, Massachusetts. Please direct correspondence to: enazarov@draper.com.
References
(1) R. Guevremont and R.W. Purves, Rev. Sci. Instr.70, 1370–1383 (1999).
(2) L.C. Rorrer, III and R.A. Yost, Int. J. Mass Spectrom. 300, 173–181 (2011).
(3) G.A. Eiceman, E.V. Krylov, N.S. Krylova, E.G. Nazarov, and R.A. Miller, Anal. Chem. 76, 4937–4944 (2004).
(4) B.B. Schneider, T.R. Covey, S.L. Coy, E.V. Krylov, and E.G. Nazarov, Anal. Chem. 82, 1867–1880 (2010).
(5) B.B. Schneider, T.R. Covey, S.L. Coy, E.V. Krylov, and E.G. Nazarov, Eur. J. Mass Spectrom. 16, 57–71 (2010).
(6) D.S. Levin, P. Vouros, R. Miller, E.G. Nazarov, and J.C. Morris, Anal. Chem. 78, 96–106 (2006).
(7) M.P. Gorshkov, Inventor's Certificate of USSR, No. 966583,G01N27/62.
(8) I.A Buryakov, E.V. Krylov, and V.P. Soldatov, USSR Invention #1486808 G01N 27/62, 1989.
(9) I.A. Buryakov, E.V. Krylov, A.L. Makas, E.G. Nazarov, V.V. Pervukhin, and U.Kh. Rasulev, Sov. Tech. Phys. Lett. 17, 446–447 (1991).
(10) B. Carnahan, S. Day, V. Kouznetsov, and A. Tarasov, "Development and Applications of a Transverse Field Compensation Ion Mobility Spectrometer," presented at the 3rd International Workshop on Ion Mobility Spectrometry, Cambridge, UK, 1995.
(11) I.A. Buryakov, E.V. Krylov, A.L. Makas, E.G.Nazarov, V.V. Pervukhin, and U.Kh. Rasulev, Pis'ma Zh. Tech. Fiz 17(12),61–65 (1991) (Russian).
(12) C. Lapthorn, B.Z. Chowdhry, and F. Pullen, Mass Spectrom. Rev. (2012, in press).
(13) B.B. Schneider, T.R. Covey, S.L. Coy, E.V. Krylov, and E.G. Nazarov, Int. J. Mass Spectrom. 298, 45–54 (2010).
(14) E.V. Krylov and E.G. Nazarov, Int. J. Mass Spec. 285, 149 (2009).
(15) G.A. Eiceman, E.V. Krylov, N.S. Krylova, E.G. Nazarov, and R.A. Miller, Anal. Chem. 76(17), 4937–4944 (2004).
(16) E.V. Krylov, Int. J. Mass Spectrom. 225, 39 (2003).
(17) R.J. Guevremont, Chromatogr. A 1058, 3–19 (2004).
(18) W.B. Parsons, B.B. Schneider, V. Kertez, J.J. Corr, T.R. Covey, and G.J Van Berkel, Rap. Commun. Mass Spectrom. 25, 3382–3386 (2011).
(19) S. Schadt, S. Kallbach, R. Almeida, and J. Sandel, Drug Metab. Dispos. 40(3), 419–425 (2012).

Determining Enhanced Sensitivity to Odors due to Anxiety-Associated Chemosignals with GC
May 8th 2025Based on their hypothesis that smelling anxiety chemosignals can, like visual anxiety induction, lead to an increase in odor sensitivity, a joint study between the University of Erlangen-Nuremberg (Erlangen, Germany) and the Fraunhofer Institute for Process Engineering and Packaging (Freising, Germany) combined behavioral experiments, odor profile analysis by a trained panel, and instrumental analysis of odorants (gas chromatography-olfactometry) and volatiles (gas chromatography-mass spectrometry).
Investigating 3D-Printable Stationary Phases in Liquid Chromatography
May 7th 20253D printing technology has potential in chromatography, but a major challenge is developing materials with both high porosity and robust mechanical properties. Recently, scientists compared the separation performances of eight different 3D printable stationary phases.
Distinguishing Alcohol- from Non-Alcohol-Associated Liver Cirrhosis with LC-MS
May 7th 2025A pilot study investigating whether nicotinamide adenine dinucleotide kinase (NADK) expression is selectively diminished in alcohol-associated liver cirrhosis (AC), as well as evaluating its potential as a biomarker for this condition, measured AC and non-AC (NAC). Nicotinamide adenine dinucleotide (NAD+) and nicotinamide adenine dinucleotide phosphate (NADP+) levels in human liver samples were measured using liquid chromatography-mass spectrometry (LC-MS).

.png&w=3840&q=75)

.png&w=3840&q=75)


.png&w=3840&q=75)


.png&w=3840&q=75)


